Search results
Architecture of AI Assistant
This document outlines the process flow for using the AI feature within Bold BI to generate visualizations from user queries via natural language processing (NLP).
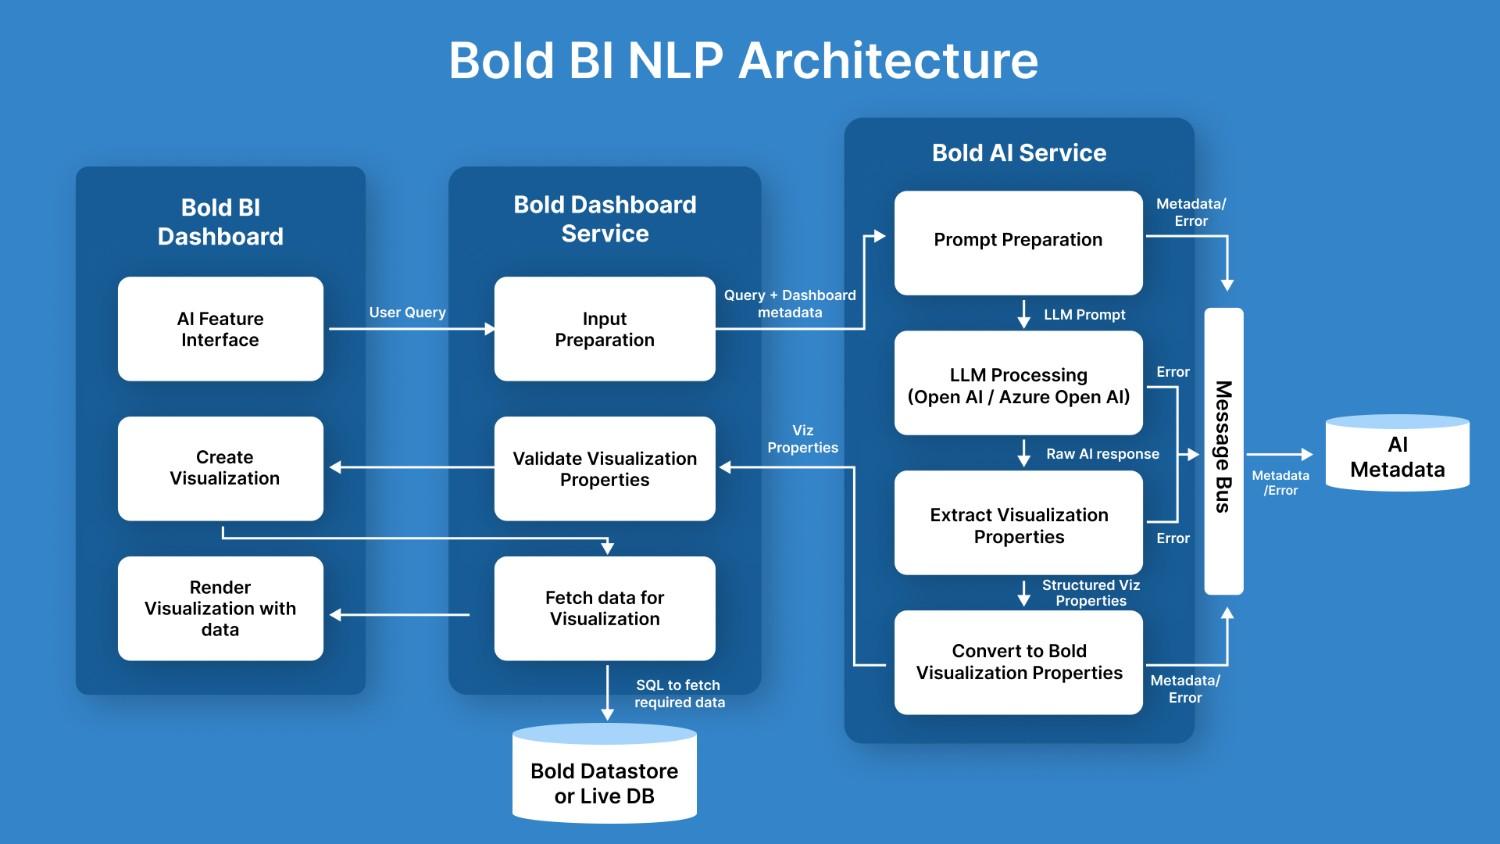
1. AI Feature Interface
- Users can interact with the AI feature interface to submit natural language queries.
- This interface allows users to request visualizations by describing their requirements in a simple query format.
2. Input Preparation
- Once a query is submitted, it is sent to the Bold Dashboard Service.
- The service prepares the input by combining the user’s query with the datasource metadata which will include the customer datasource details such as Table names, columns and their data type.
3. Prompt Creation
- The prepared input (user query + datasource metadata) is then passed to the Bold AI Service for prompt creation.
- A prompt is formulated to contact the large language model (LLM) from OpenAI, requesting an AI-generated response based on the user’s input.
4. LLM Processing
- The created prompt is processed by the selected LLM, which generates a raw AI response.
- This response contains potential data for visualization or appropriate response for the user’s query.
5. Extracting Visualization Properties
- The raw AI response is then analyzed to extract visualization properties, which include information about the type of chart and fields to build the visualization.
6. Converting to Bold BI Visualization Properties
- The extracted visualization properties are converted into a format that is compatible with Bold BI.
7. Validation of Visualization Properties
- The converted visualization properties are validated to ensure they align with the data structure and user preferences.
8. Data Fetching
- Once the visualization properties are validated, the required data is fetched from the Bold Datastore or a Live Database.
- An SQL query is generated to retrieve the relevant data for the requested visualization.
9. Creating and Rendering Visualizations
- The visualization is created based on the retrieved data and the validated properties.
- Finally, the Bold BI Dashboard renders the visualization, which the user can interact with or further customize its properties.
Thank you for your feedback and comments.We will rectify this as soon as possible!