Search results
Prompt to Dashboard
The Prompt to Dashboard feature allows users to generate a complete, interactive dashboard using just a natural language input. This AI-powered capability eliminates the need for manual setup by understanding user intent, selecting relevant data sources, generating visualization queries, and automatically building the dashboard with meaningful widgets.
How It Works
Traditionally, creating a dashboard involves selecting data sources, choosing visualizations, and manually placing widgets. With Prompt to Dashboard, users can simply enter a request like:
“Create a Sales Performance Dashboard for a Sales Manager.”
Based on this prompt, the system will:
- Understand and classify the user’s intent
- Identify and connect to the appropriate data source
- Generate relevant, context-aware visualization queries
- Automatically construct and display a dashboard with suitable widgets
- This streamlines the entire dashboard creation process, saving time and effort.
How to Use Prompt to Dashboard
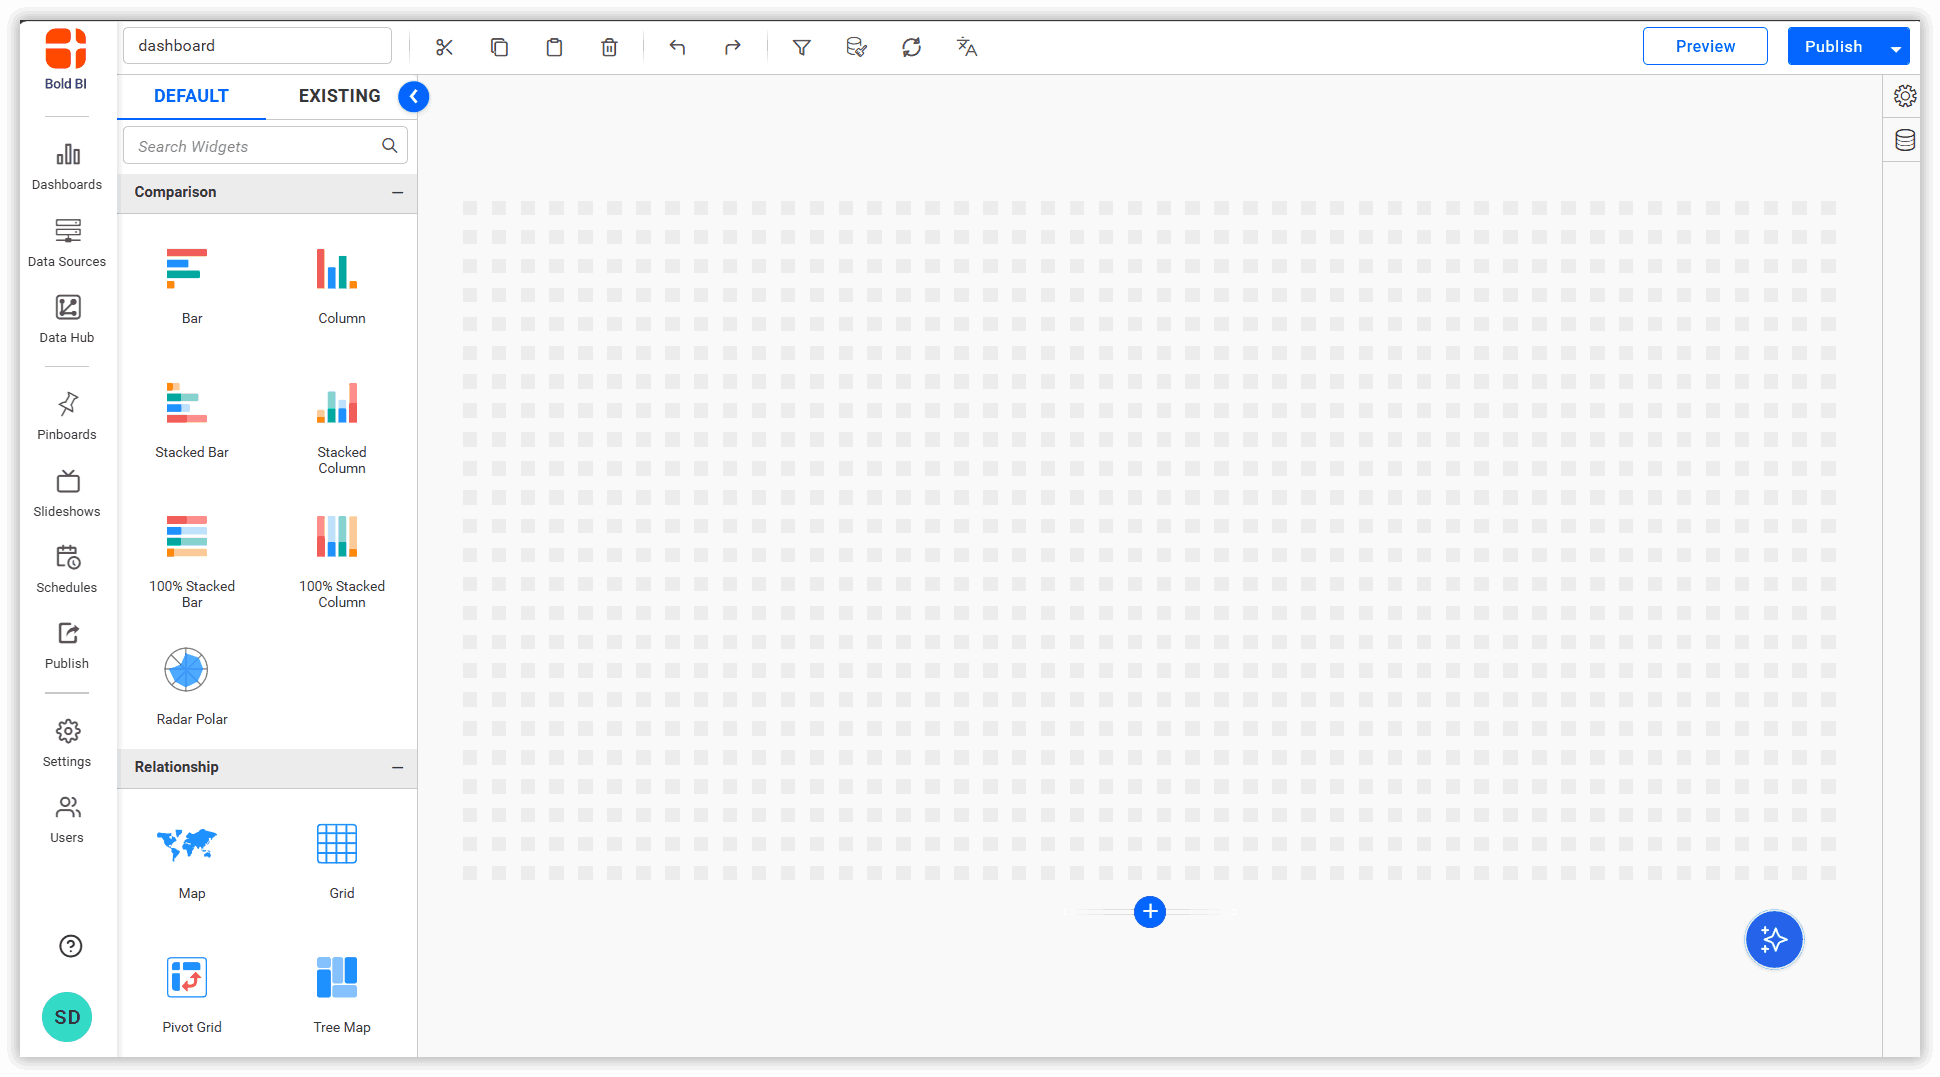
- Create a New Dashboard and open it in an empty state.
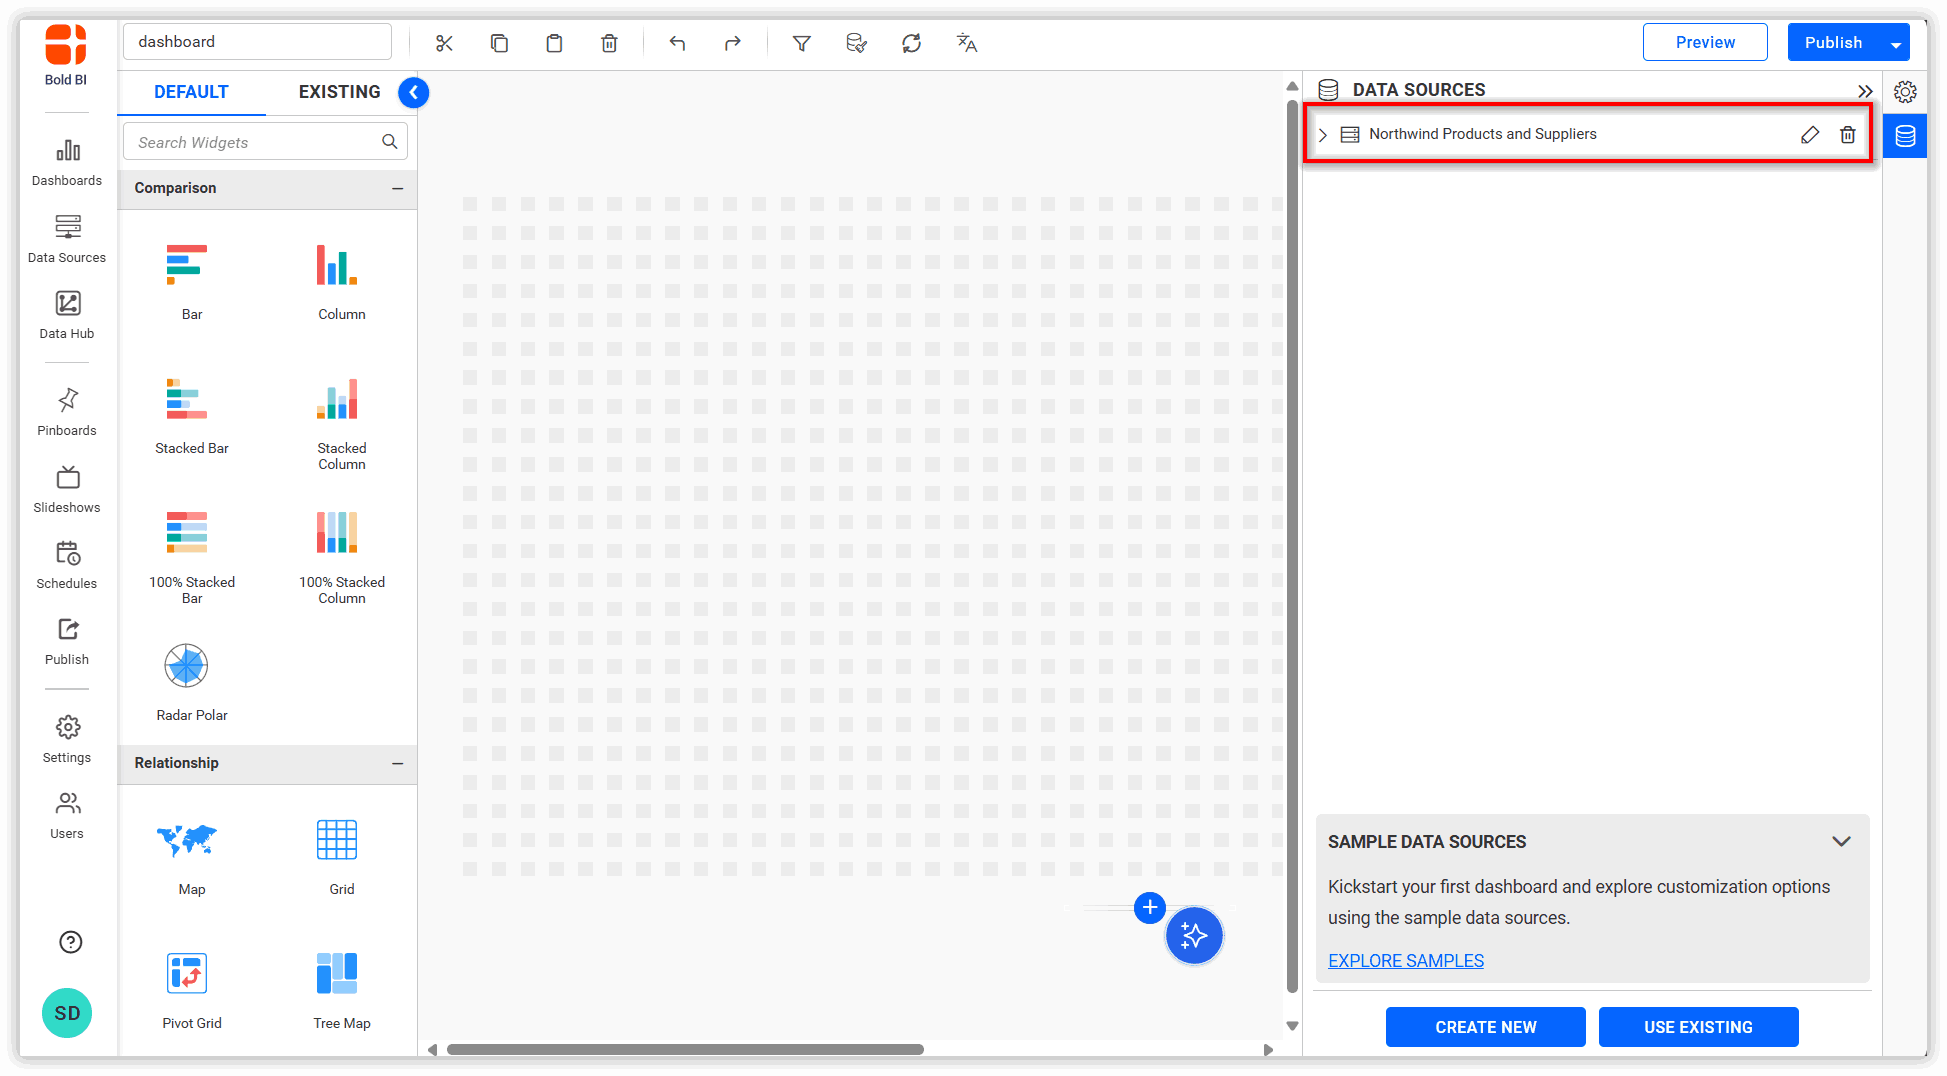
- Connect to a Data Source by linking the dashboard to your dataset.
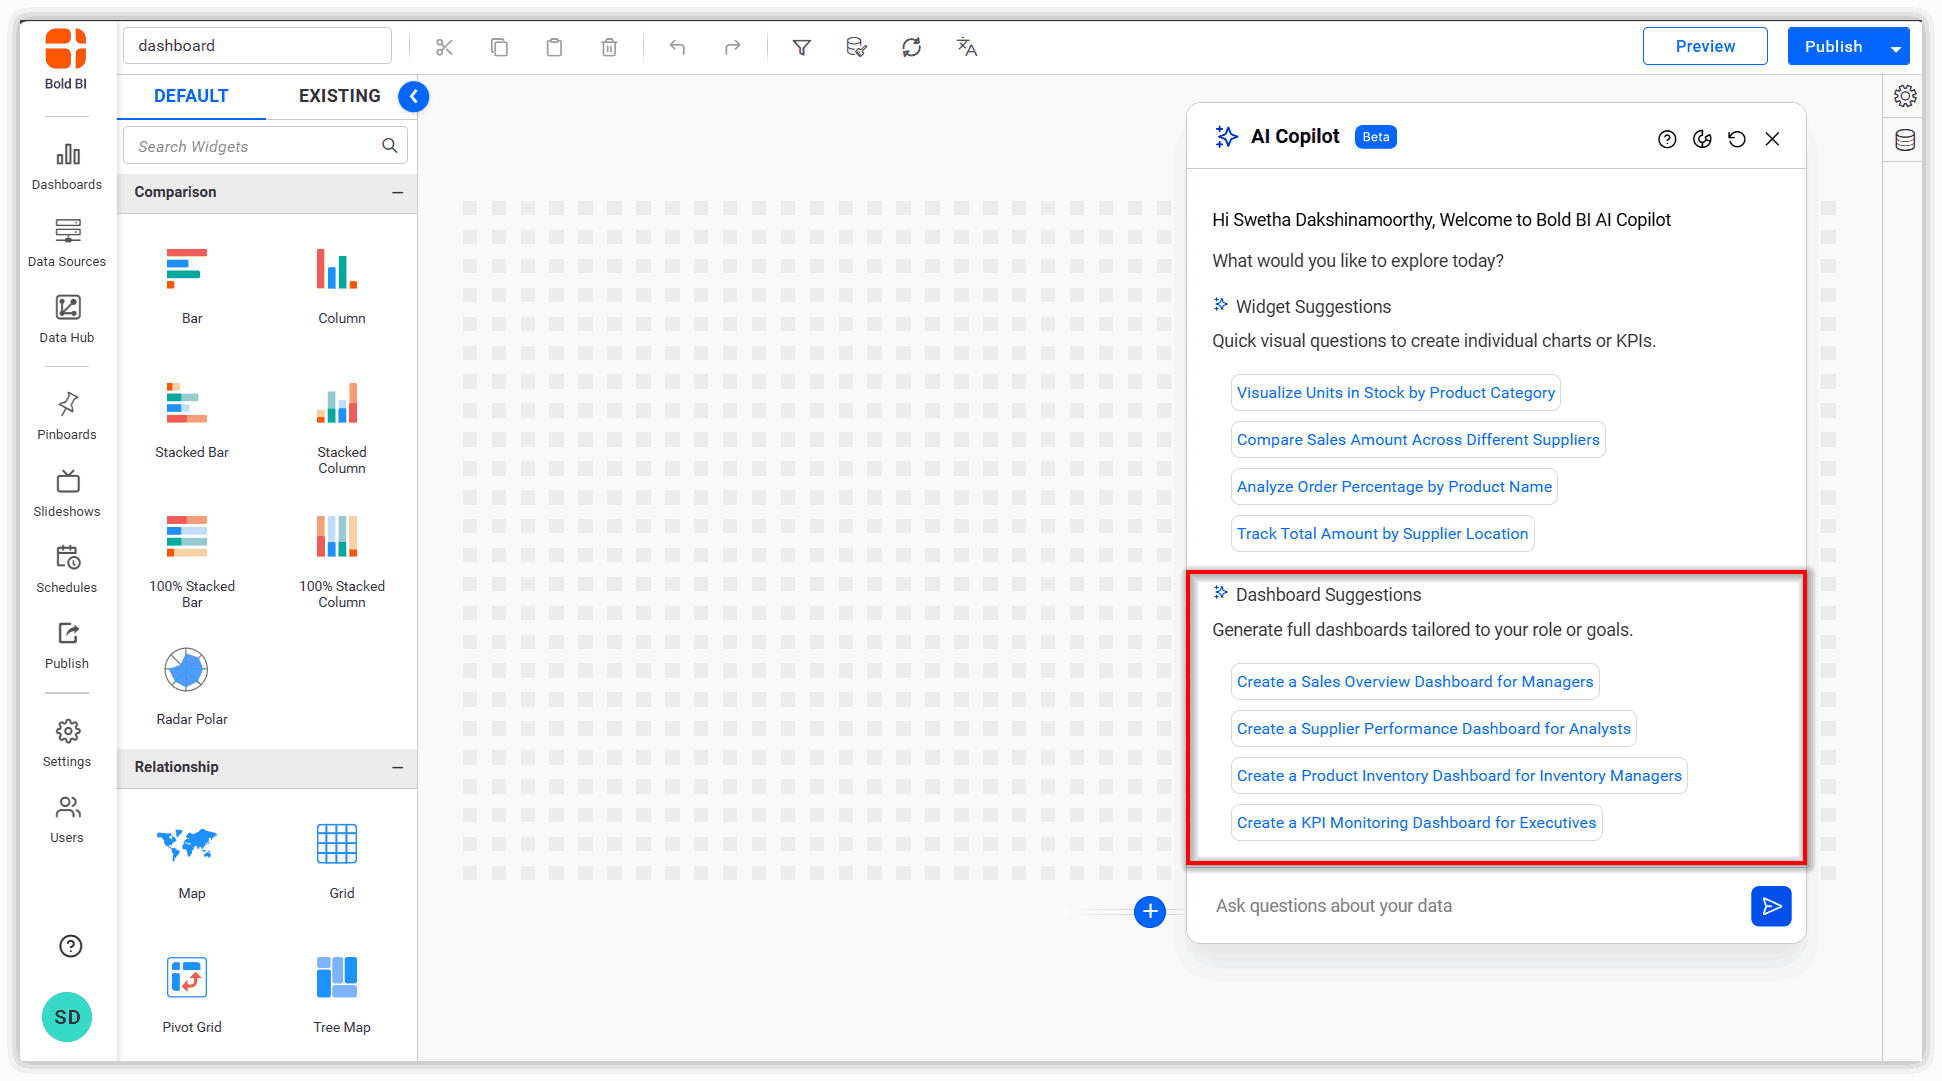
- Open the AI copilot and either select a suggested dashboard creation question or type your own prompt.
- The copilot will generate a dashboard with six widgets, with value labels enabled by default.
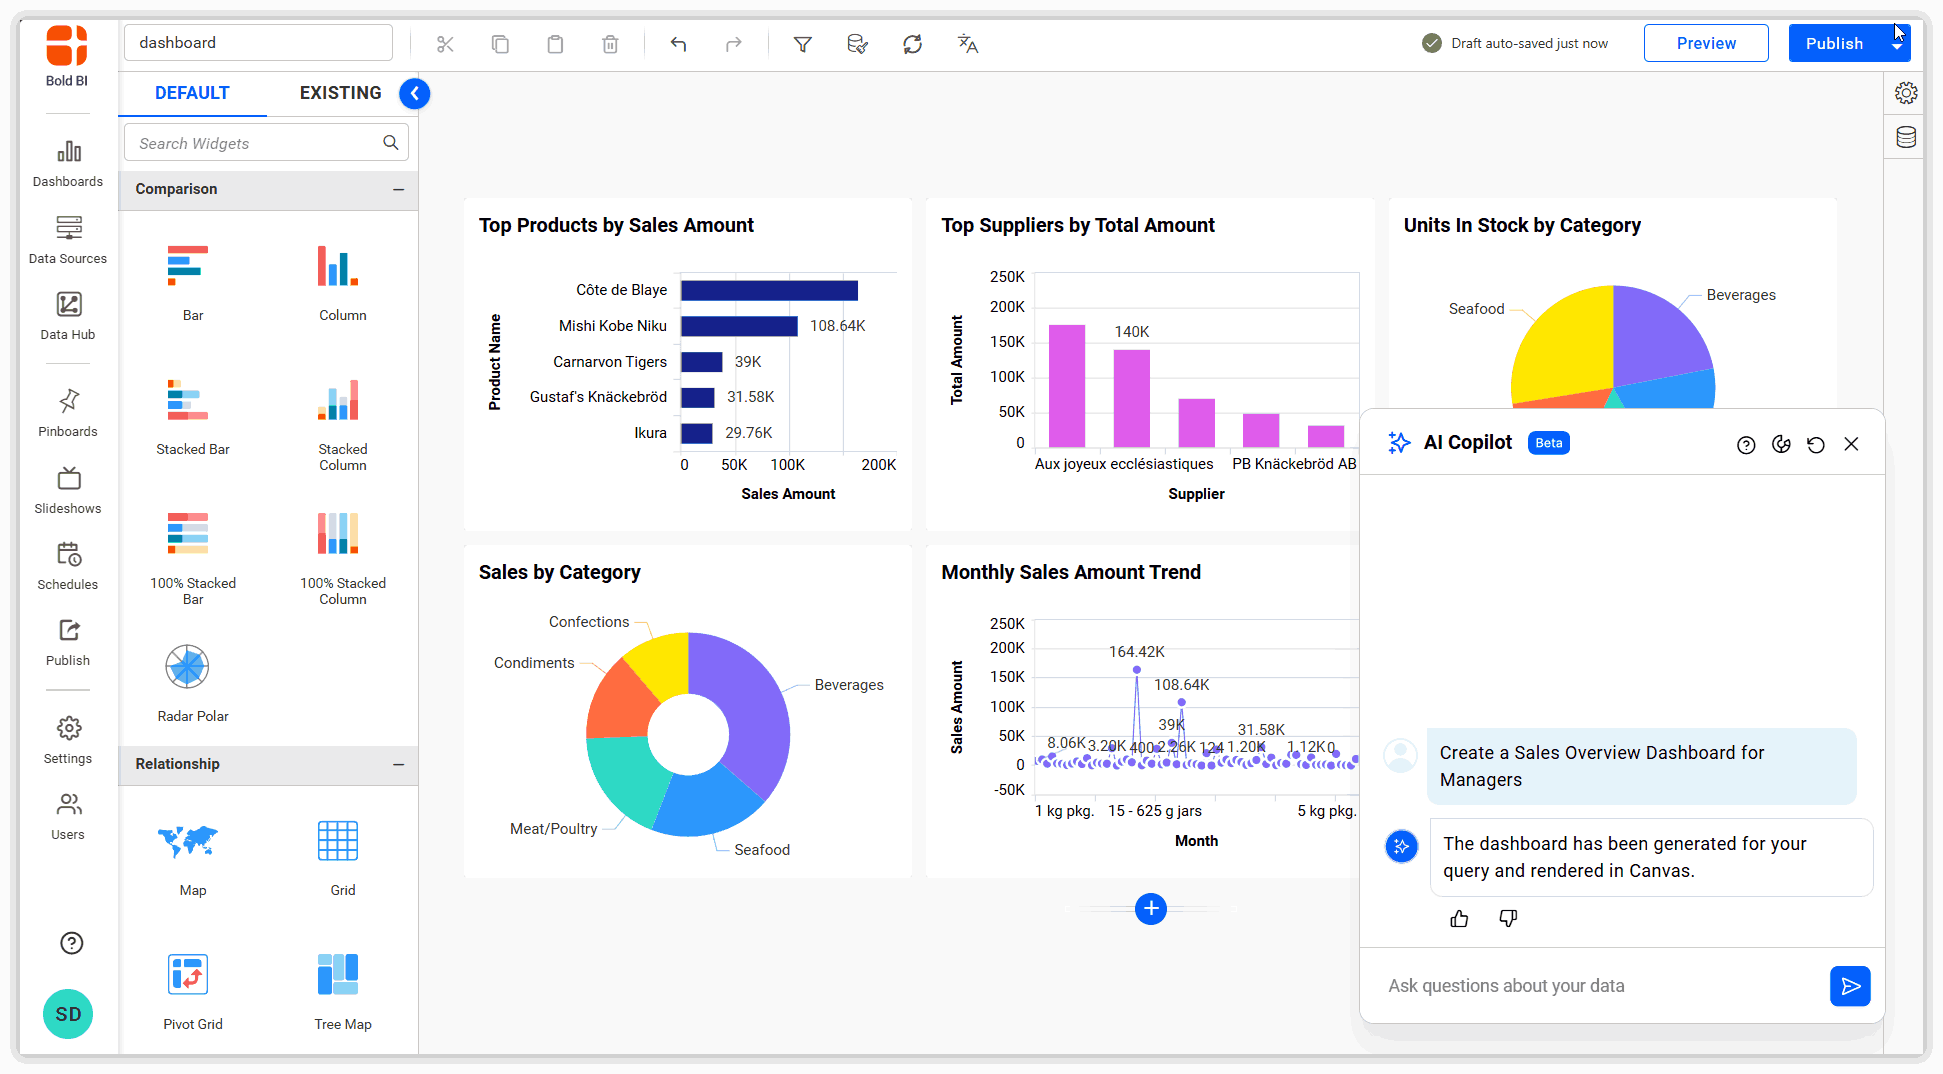
- The dashboard is created and visually rendered according to the user’s input prompt.

Support and Limitations
- Works only on empty dashboards.
- Exactly six widgets are generated per prompt—no more, no less—regardless of the data provided.
- Available only in Design Mode, not in View or Preview modes.
- Dashboard creation is not available if the dashboard already contains widgets.
- Supported widget types: Bar, Column, Pie, Doughnut, Line, Spline, Spline Area, Grid, and Map.
Contents
Having trouble getting help?
Contact SupportContents
Having trouble getting help?
Contact SupportThank you for your feedback and comments.We will rectify this as soon as possible!