Using the dashboard summary
To utilize the dashboard summary feature, you need to configure the AI. Please consult the Configure AI Feature Guide for comprehensive instructions.
Managing Dashboard summary Visibility
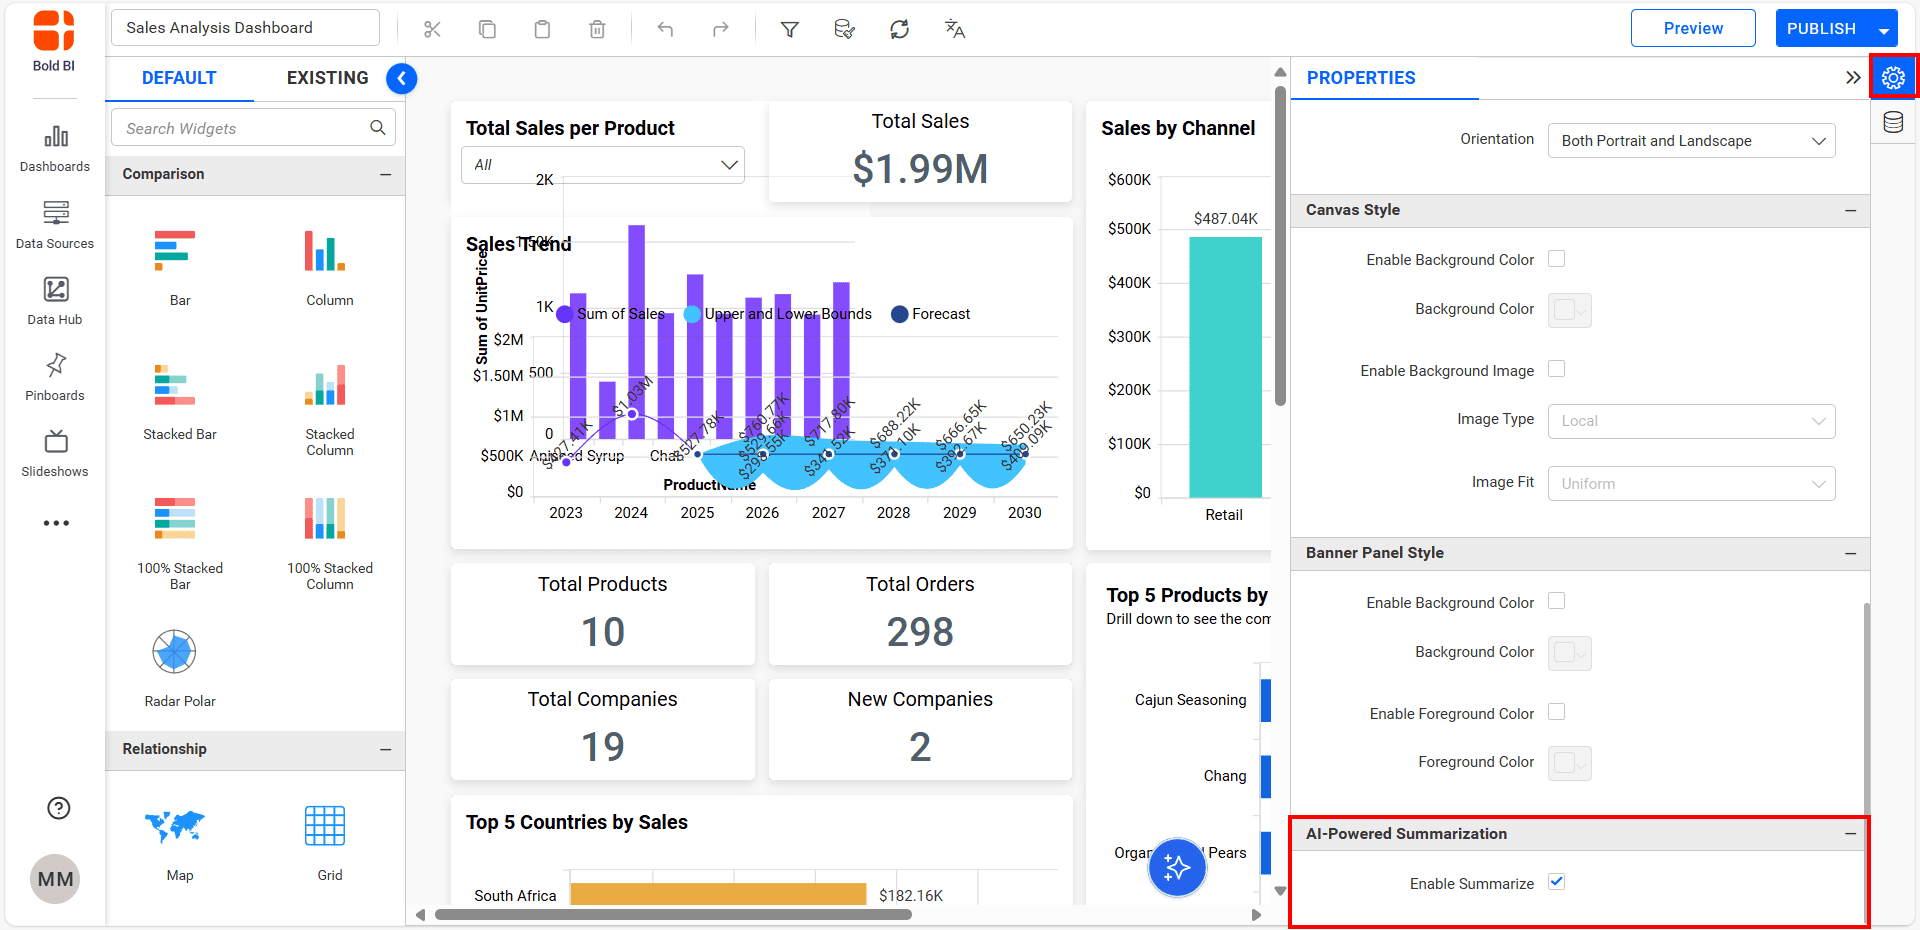
- You can manage the visibility of the dashboard summary by using the
Enable Summarizecheckbox found in the Properties Panel within theAI-Powered Summarizationsection.

-
To modify this setting, click on the Properties Panel and select
Enable Summarize. This option is enabled by default, allowing you to view the dashboard summary in both View Mode and Preview Mode. If you wish to hide the dashboard summary, just uncheck the box to disable it.
How to View and Use dashboard summary
-
To enter
Preview Mode, click the preview icon in the top-left corner of the dashboard designer. -
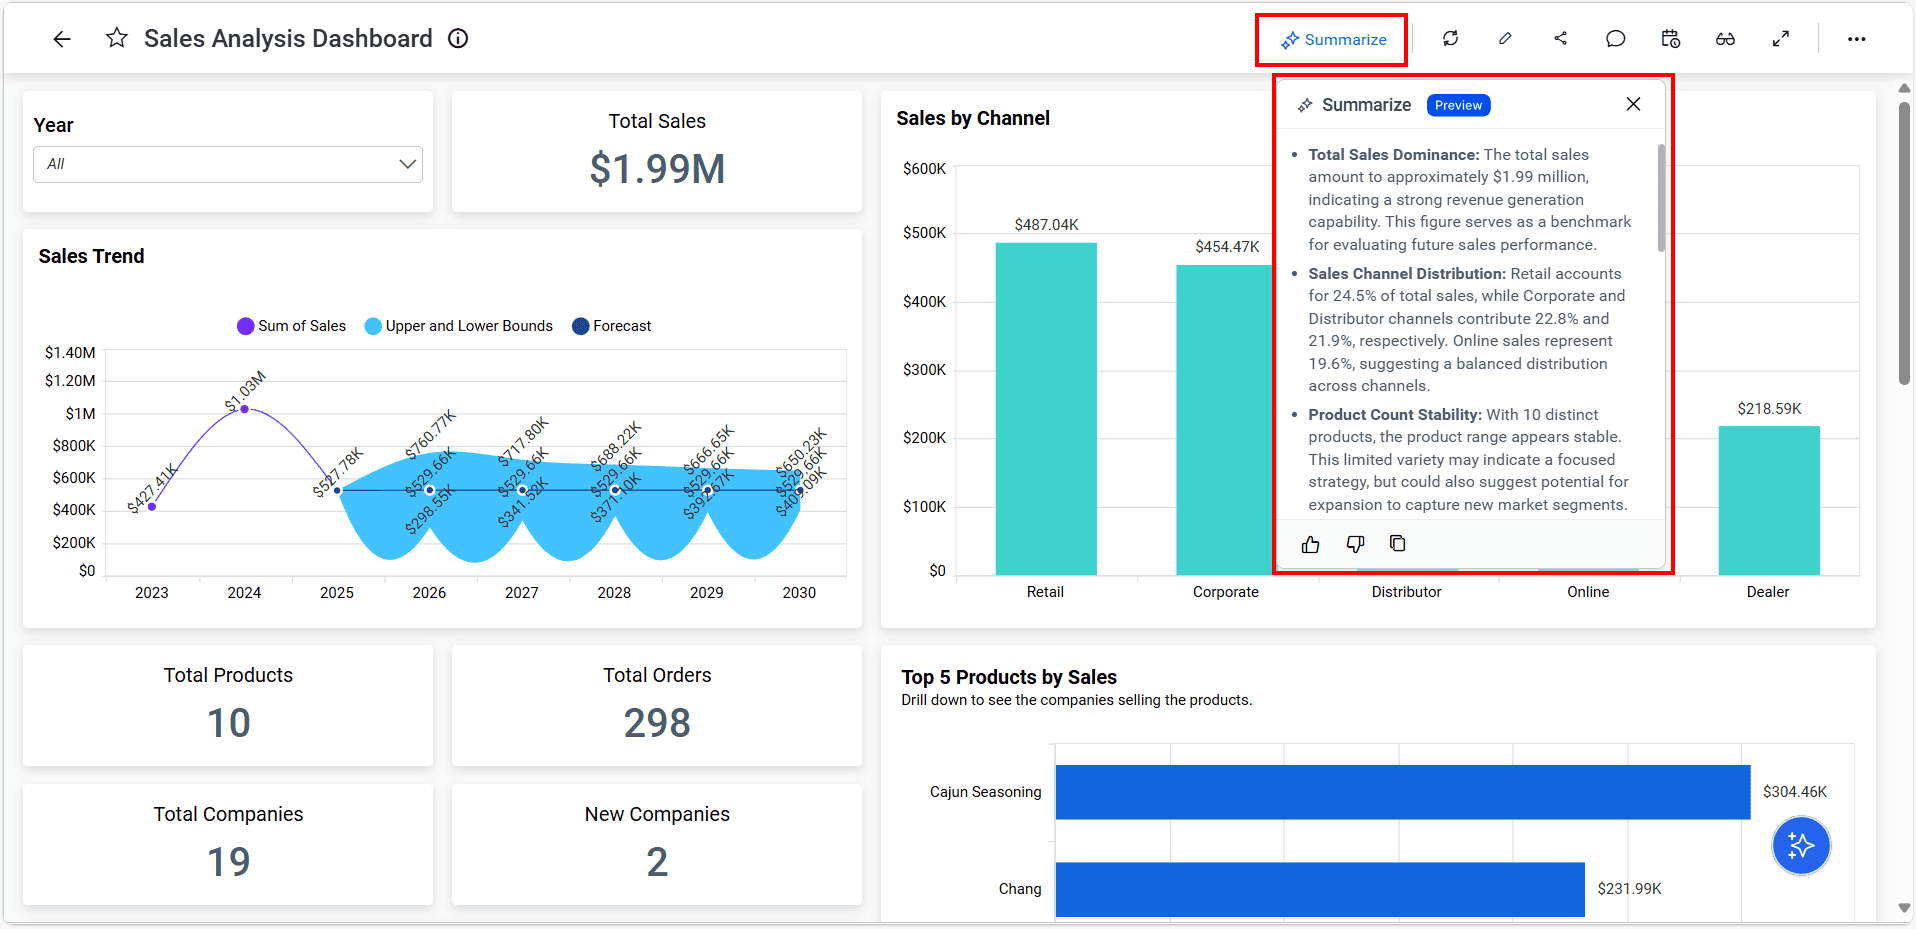
Located the Dashboard Summary icon in the top-left corner of the dashboard, and click on it to view the dashboard summary.
-
The dashboard summary provides concise insights, highlighting trends, anomalies, and statistical data related to your widgets. It enables you to better interpret the dashboard data.
-
To see the dashboard summary in View Mode, you must first publish the dashboard. The publish option can be found in the top-left corner of the dashboard designer.
-
After publishing, click the Dashboard Summary icon in the top-left corner to access the dashboard summary.

-
Once a dashboard summary is generated, you can provide feedback by clicking the like or dislike buttons found in the footer of the Summary container.
-
You can also copy text for your reference by clicking the copy icon.
Data Used for Generating Dashboard summary
To create a dashboard summary, the widgets are filtered according to their titles and purposes for generating dashboard summary the following information from filtered widgets is used: axis data points, column names, widget titles, and widget types. This data is processed using AI to generate insights for the widgets.
Tip: Assign meaningful and accurate titles to your widgets to improve the quality of the dashboard summary.
- Managing Dashboard summary Visibility
- How to View and Use dashboard summary
- Data Used for Generating Dashboard summary
Having trouble getting help?
Contact Support- Managing Dashboard summary Visibility
- How to View and Use dashboard summary
- Data Used for Generating Dashboard summary
Having trouble getting help?
Contact Support