Data
In Data mode, Unified AI Agent enables users to query connected data sources to generate either visualizations or textual responses. This mode can be accessed by selecting the Data option from the dropdown menu within the Unified AI Agent interface.
Visual Generation
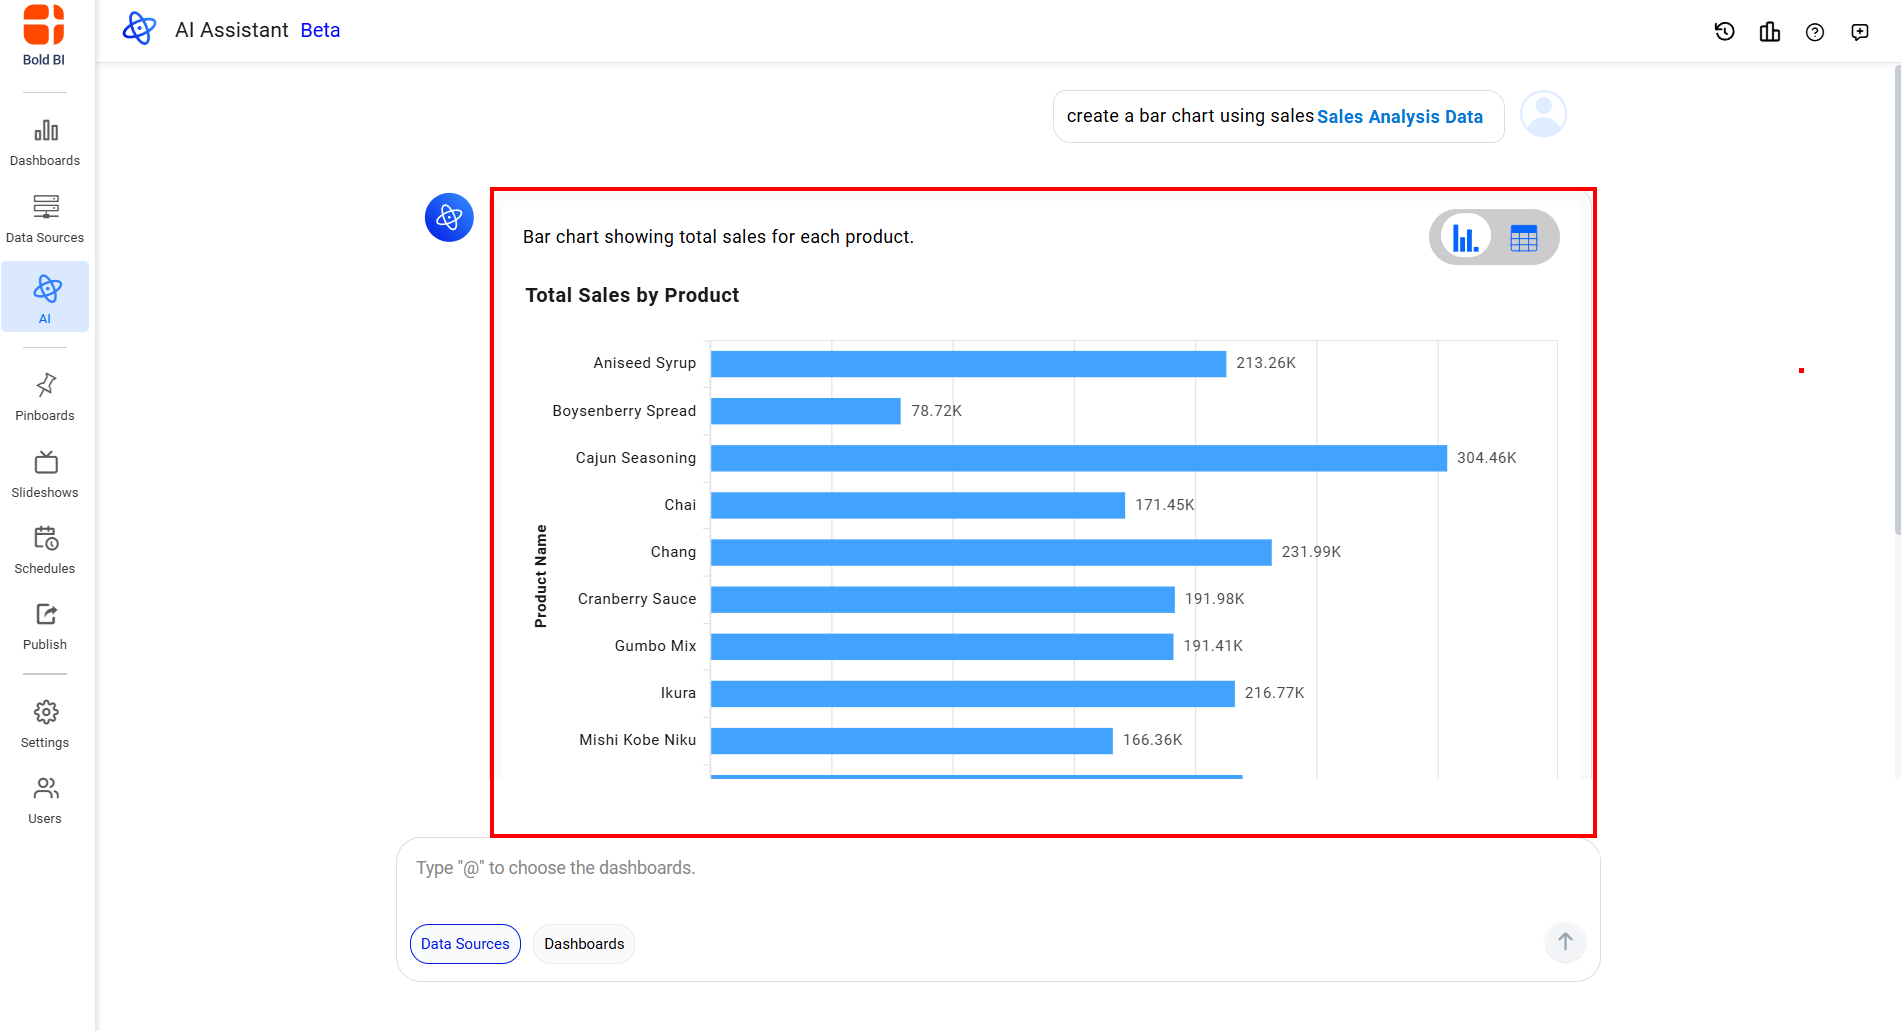
The Unified AI Agent generates visuals in response to user queries by utilizing data from connected data sources.
Steps to Generate a visual:
- Ask a query to create a visual.
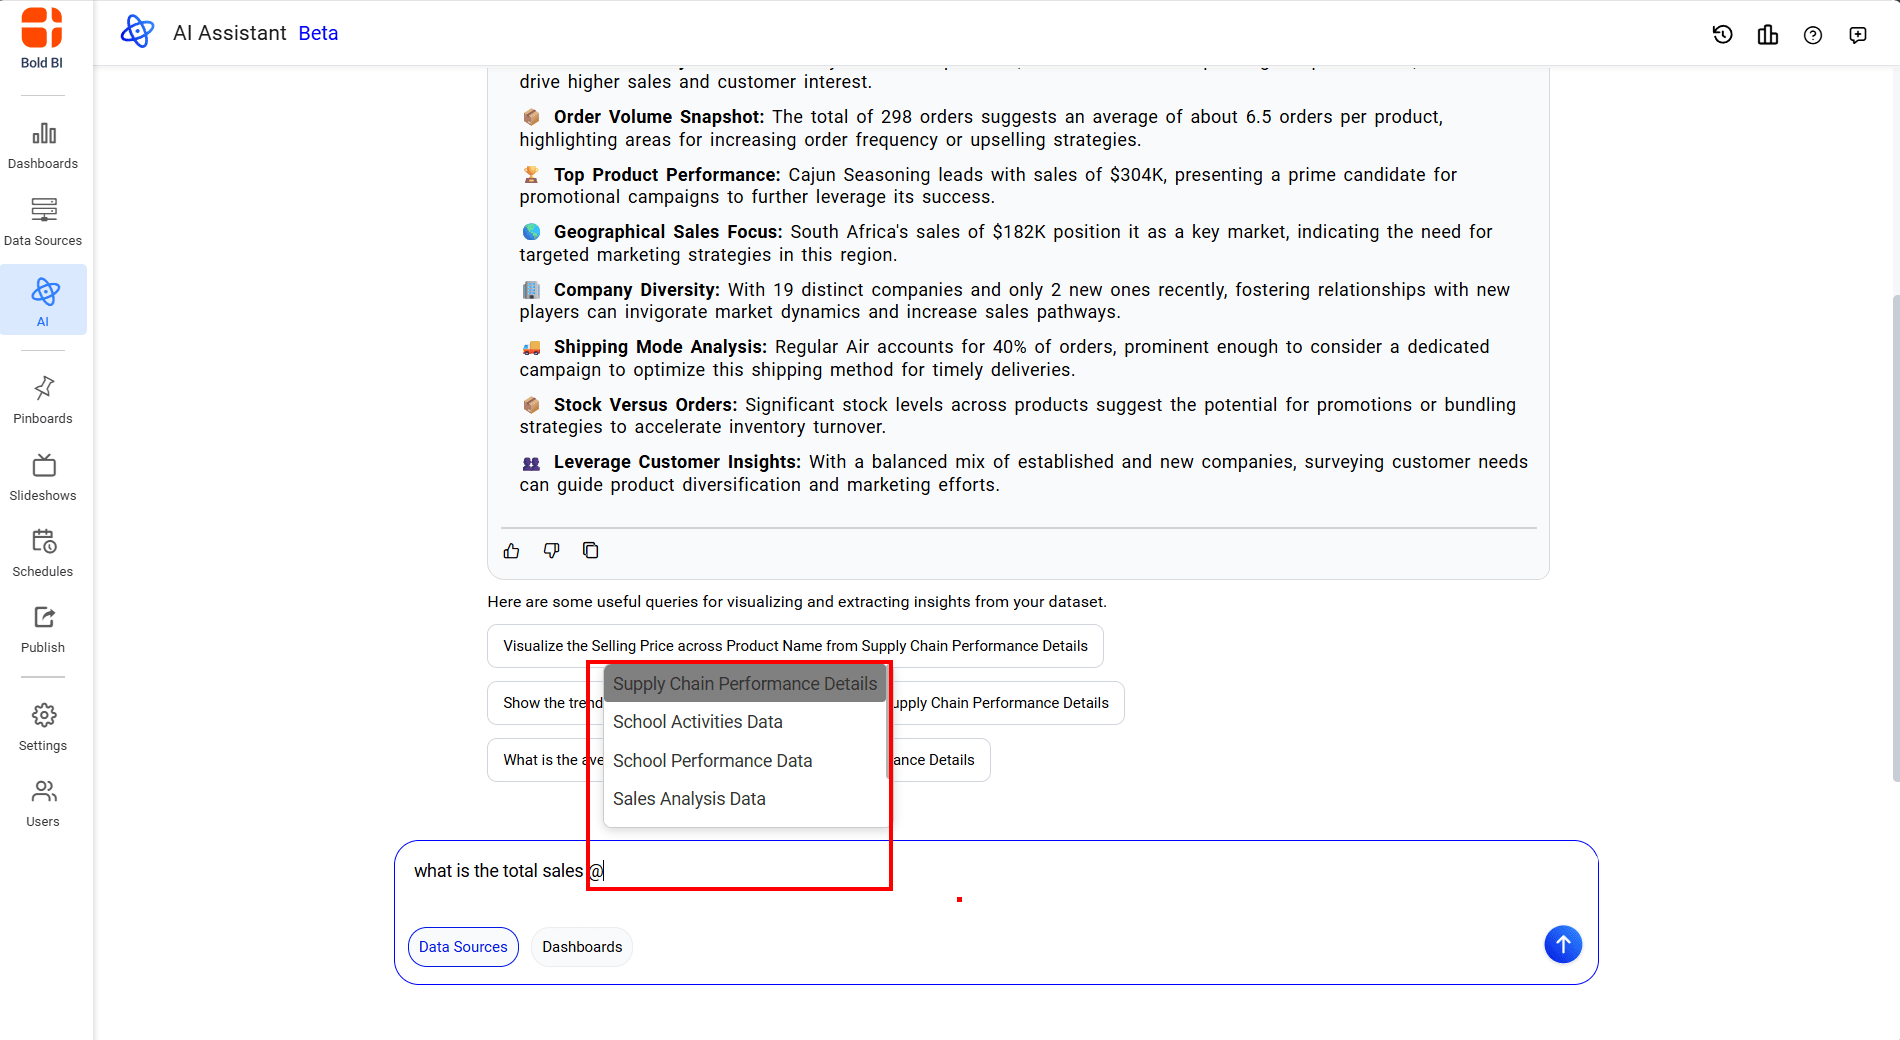
- Type the
@symbol to view the list of available data sources.
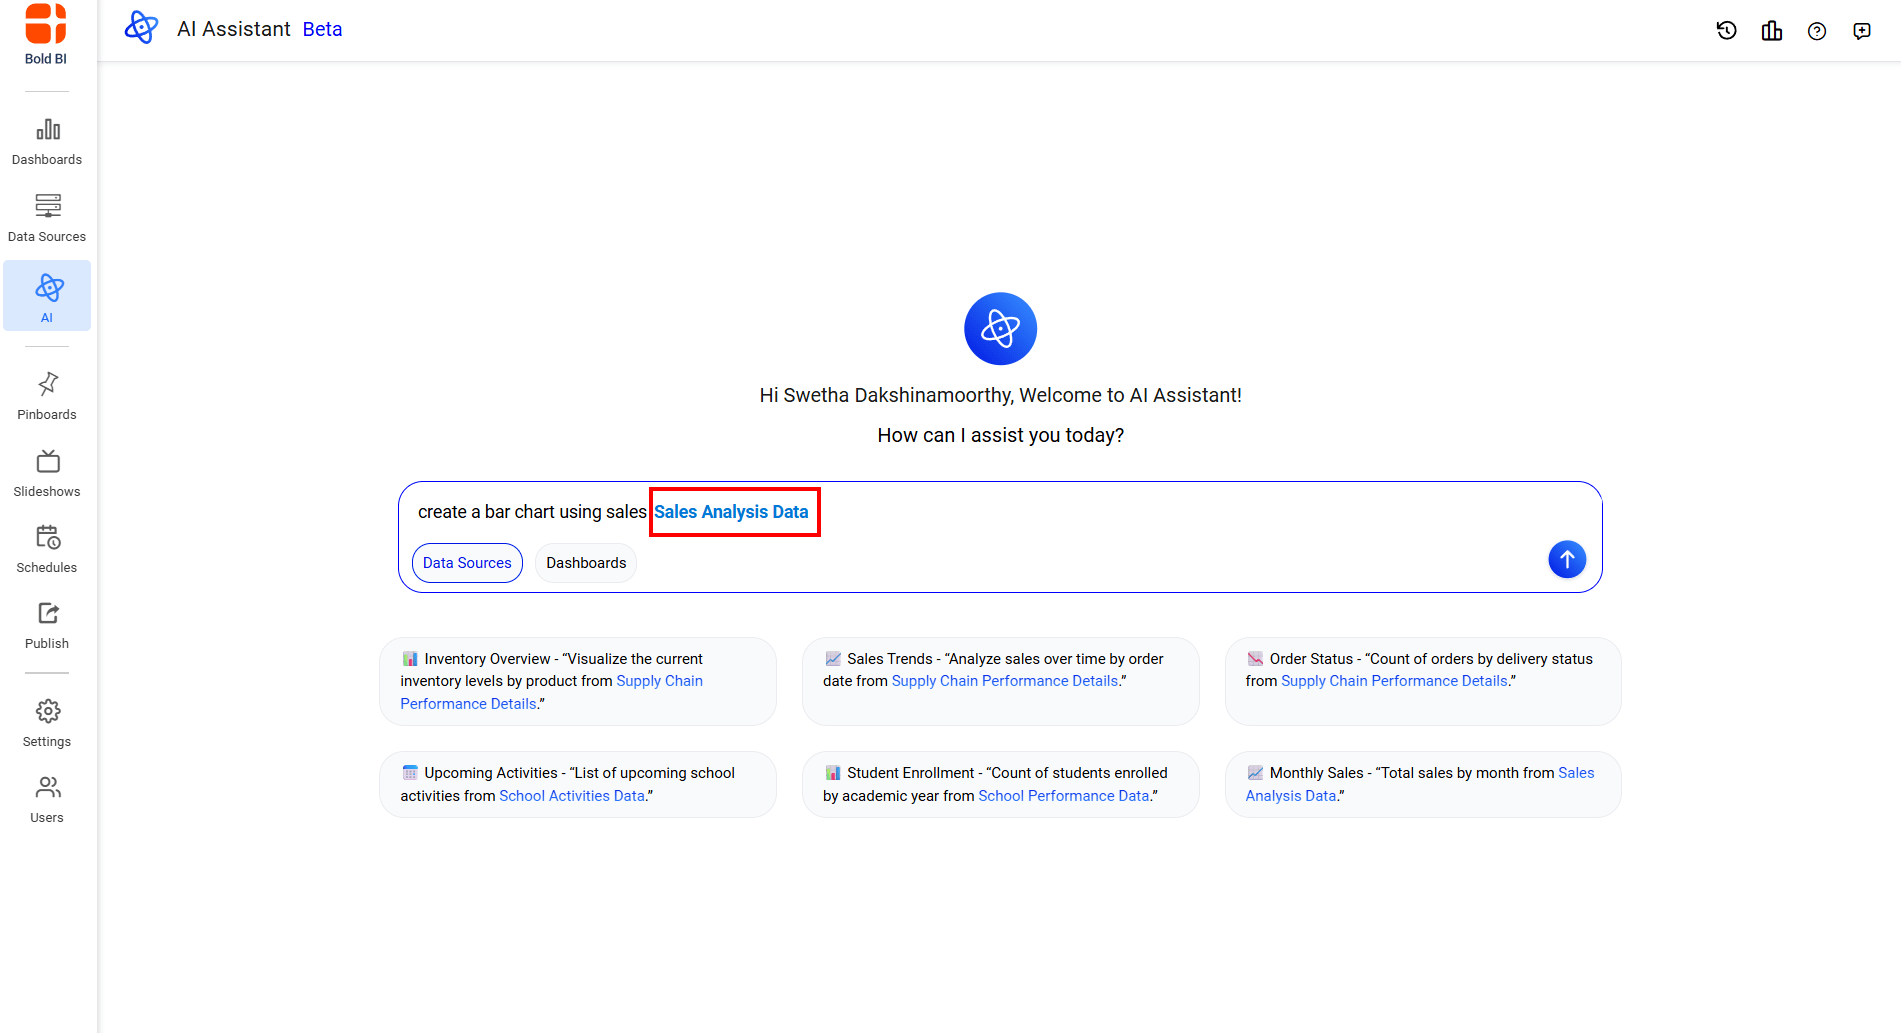
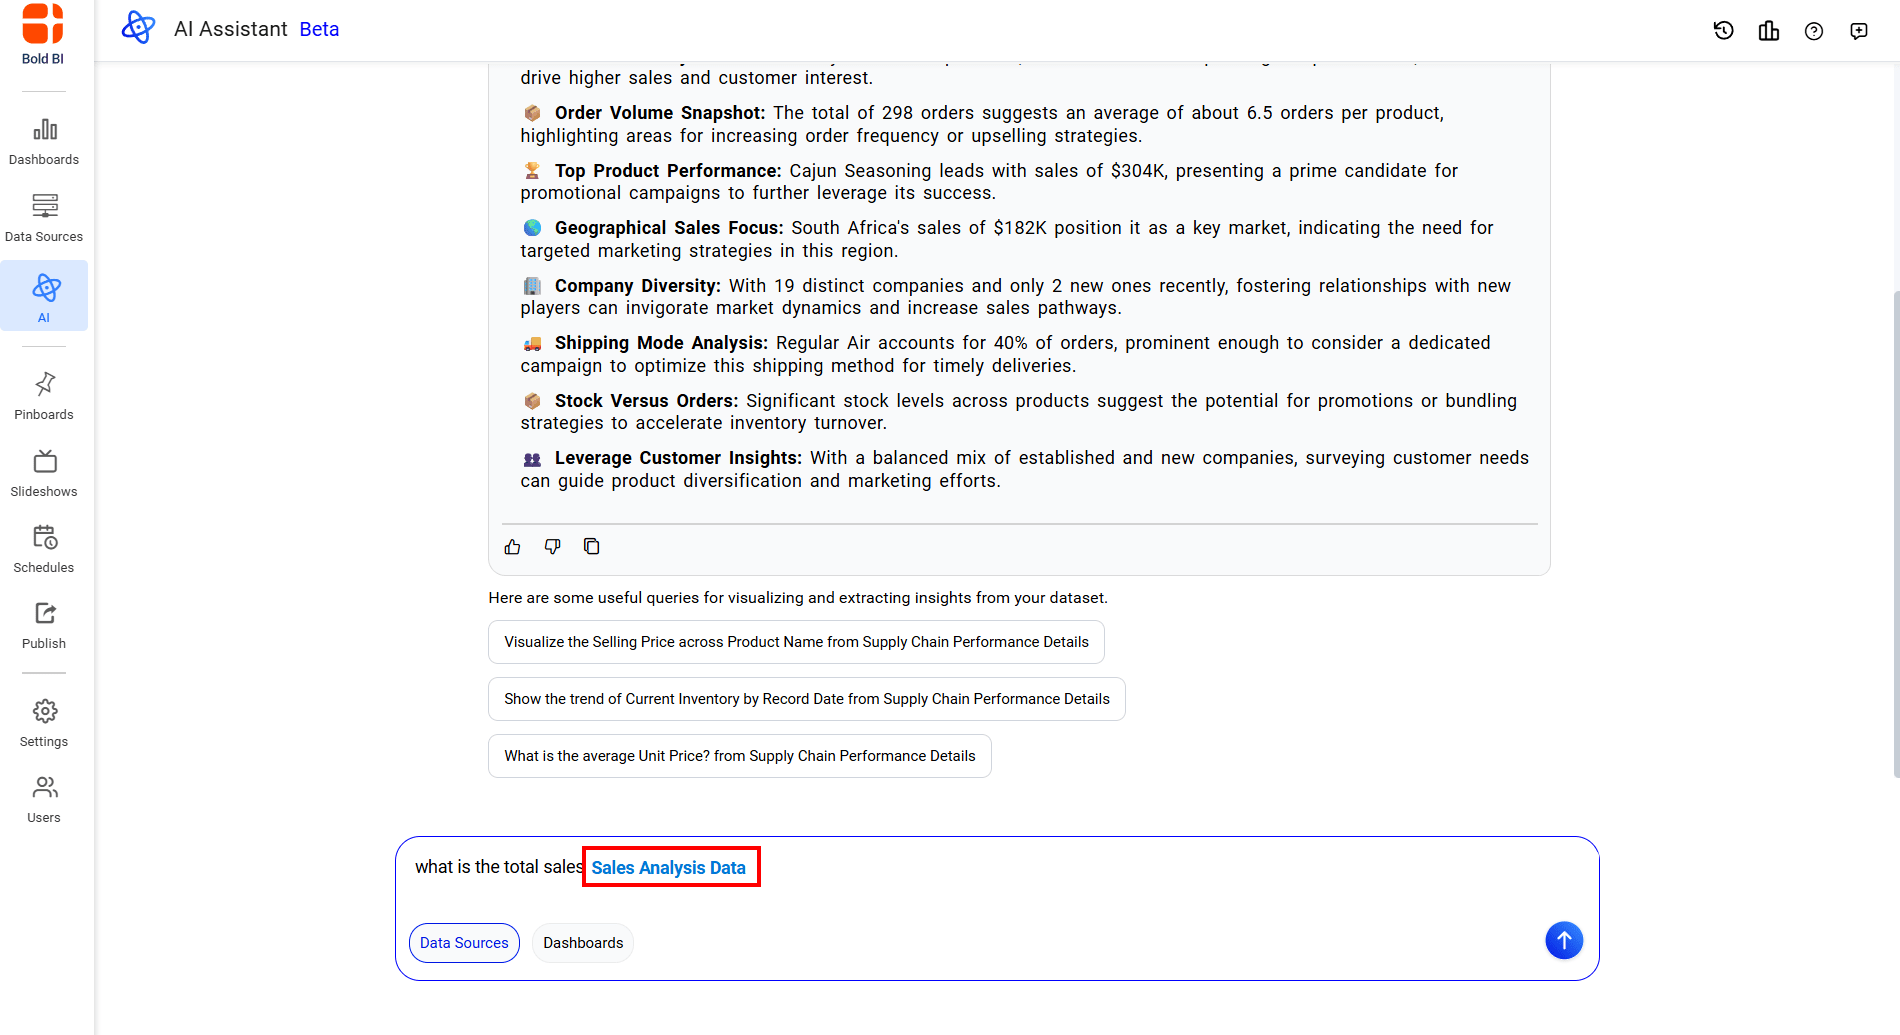
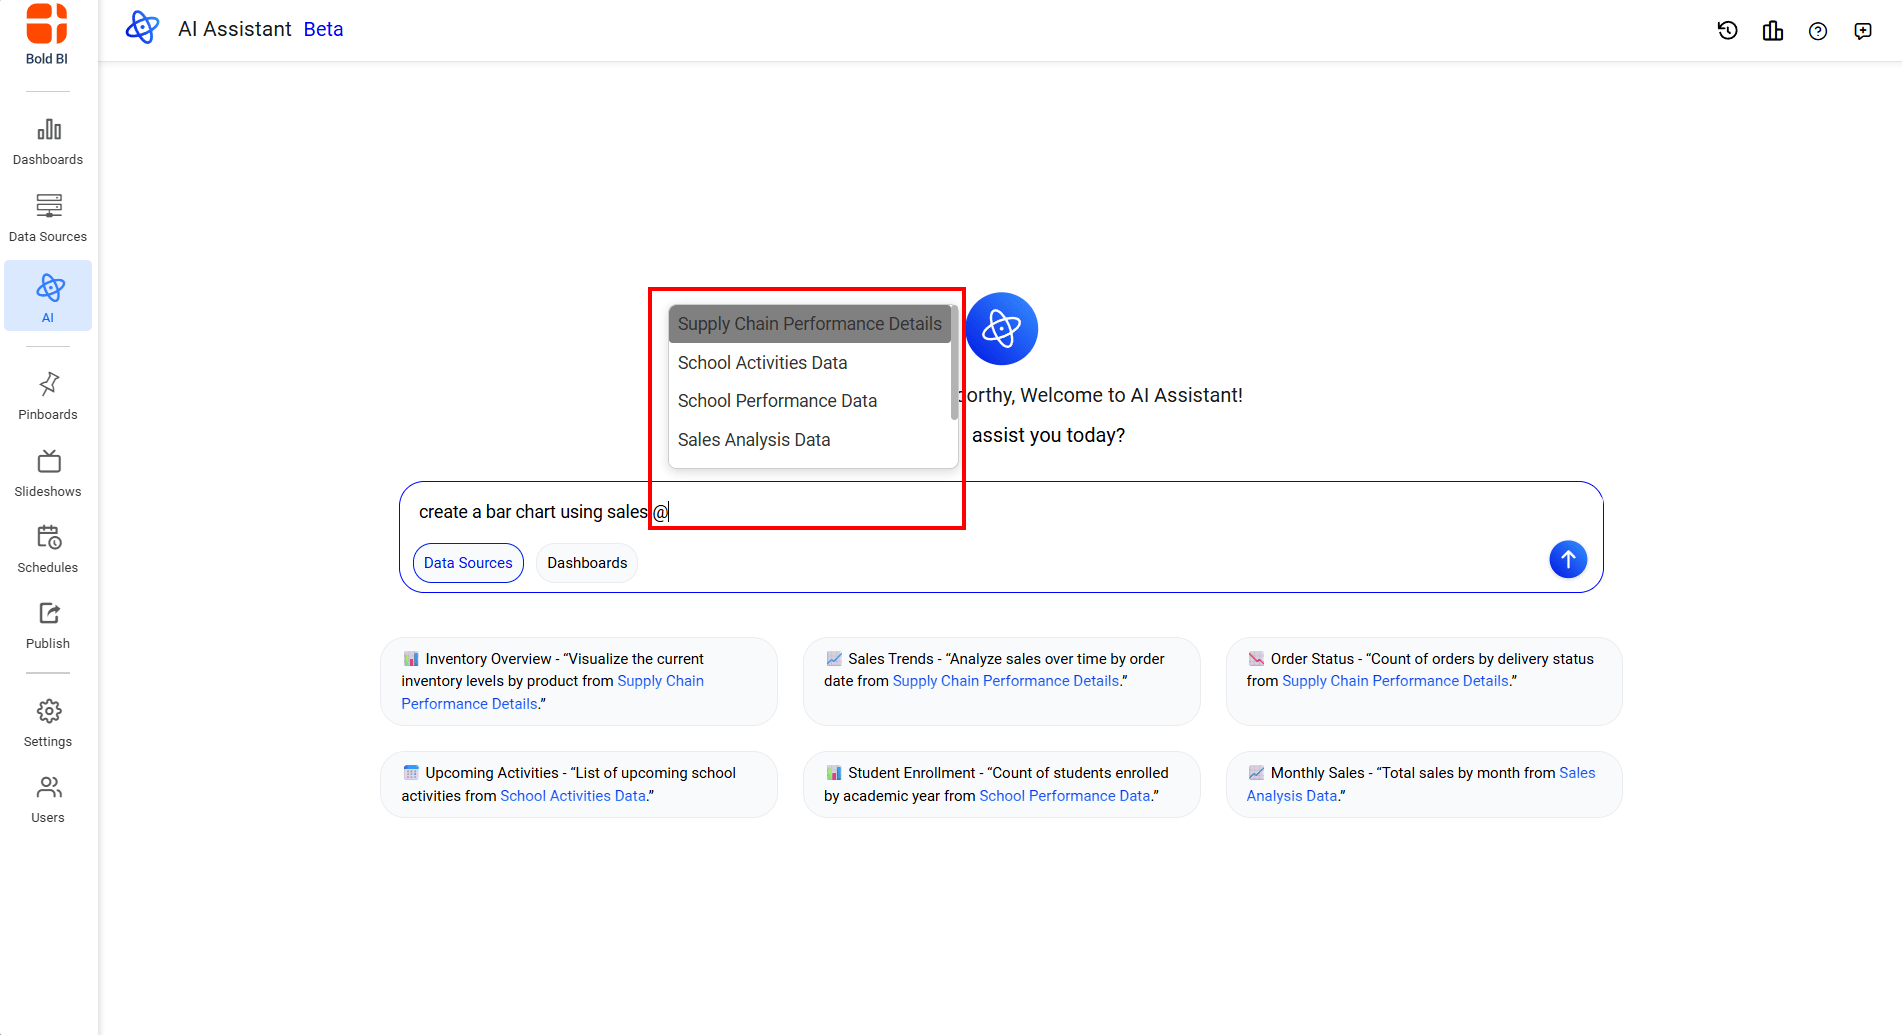 3. Select a required datasource from the list to continue the query.
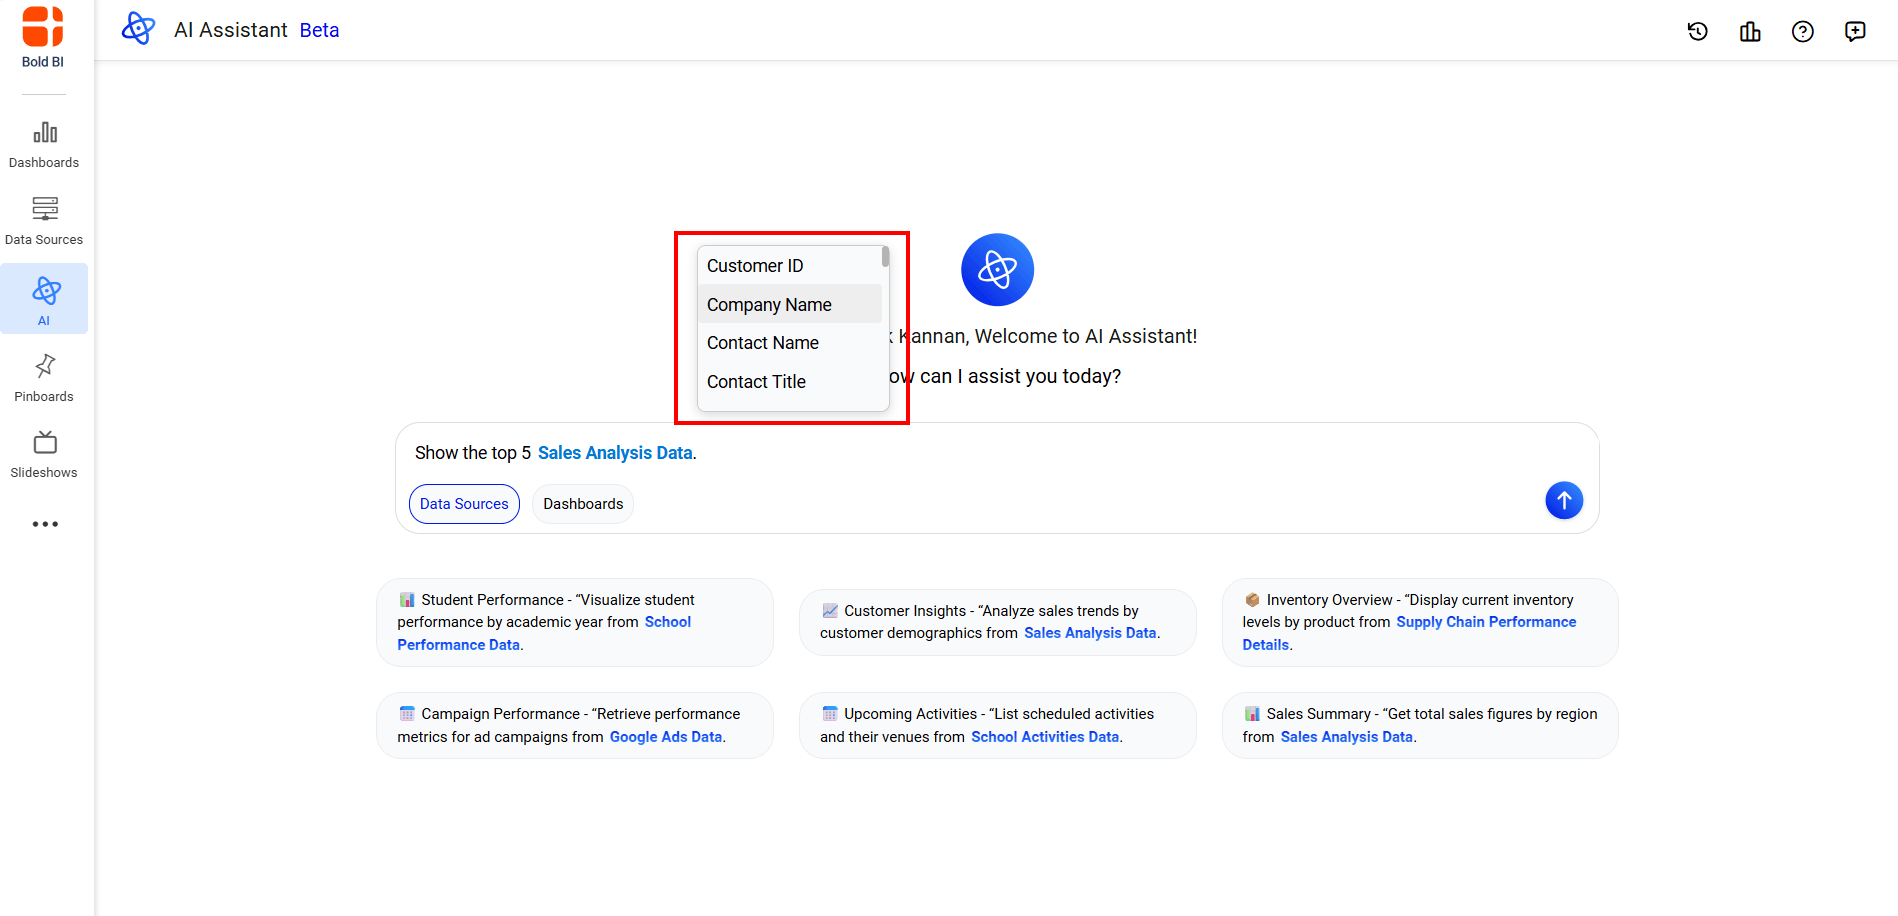
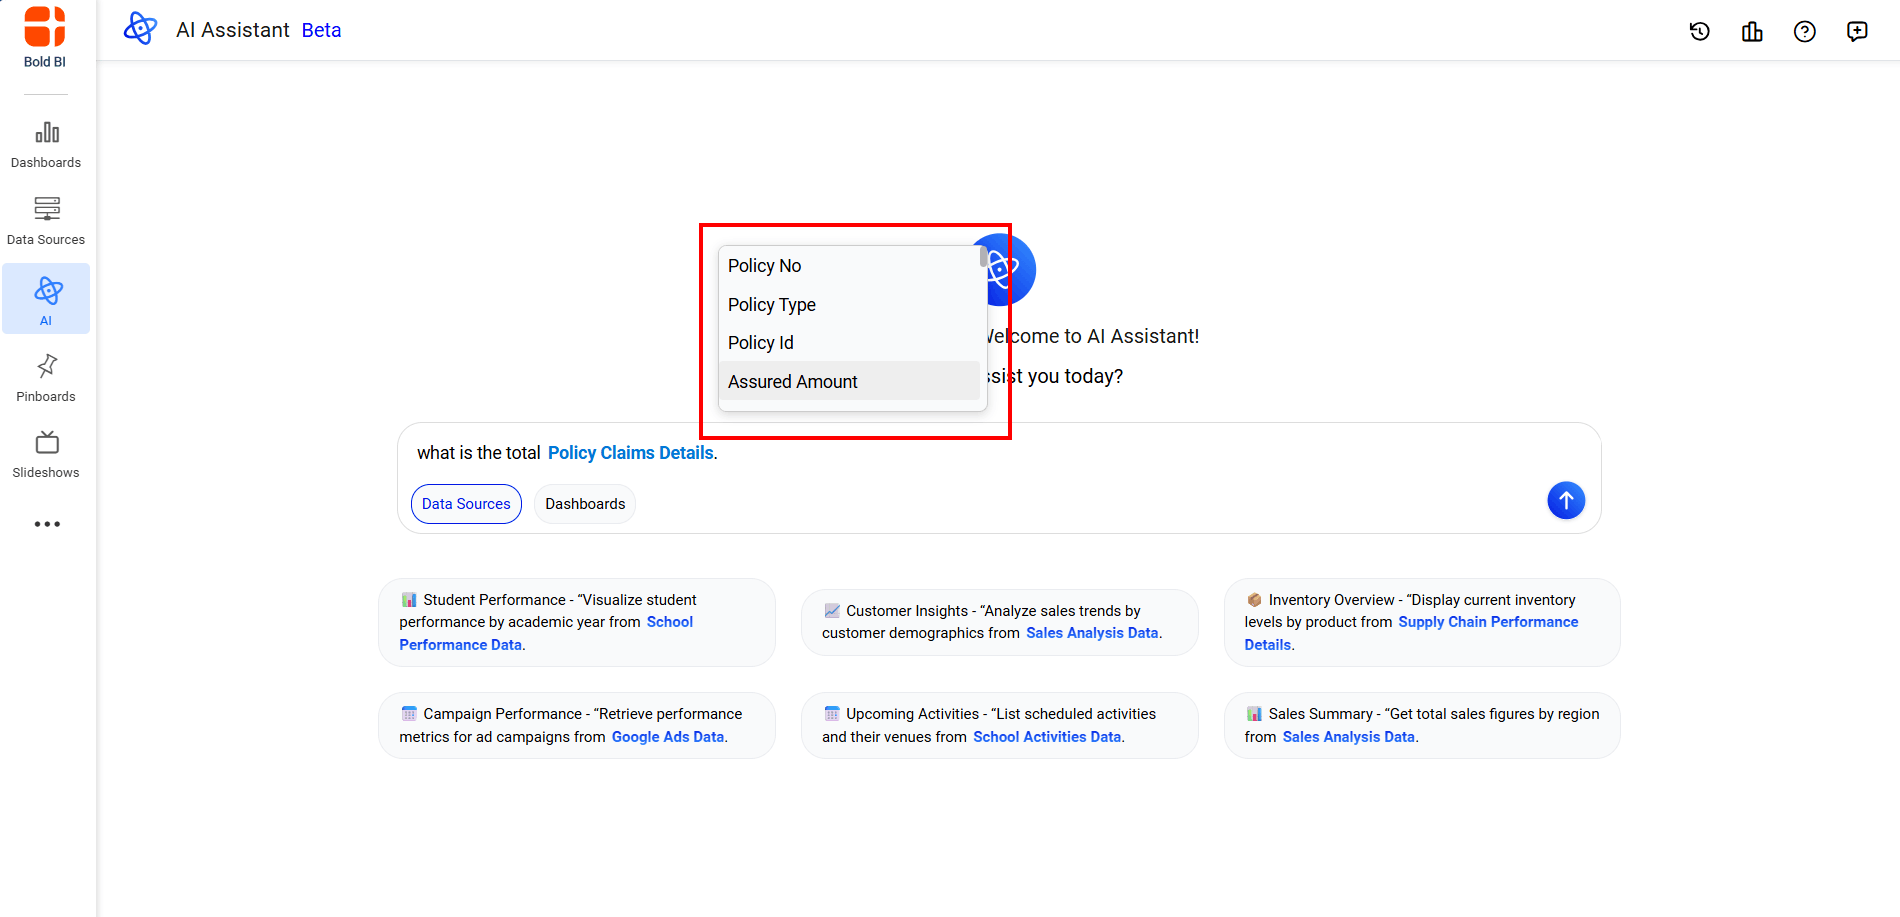
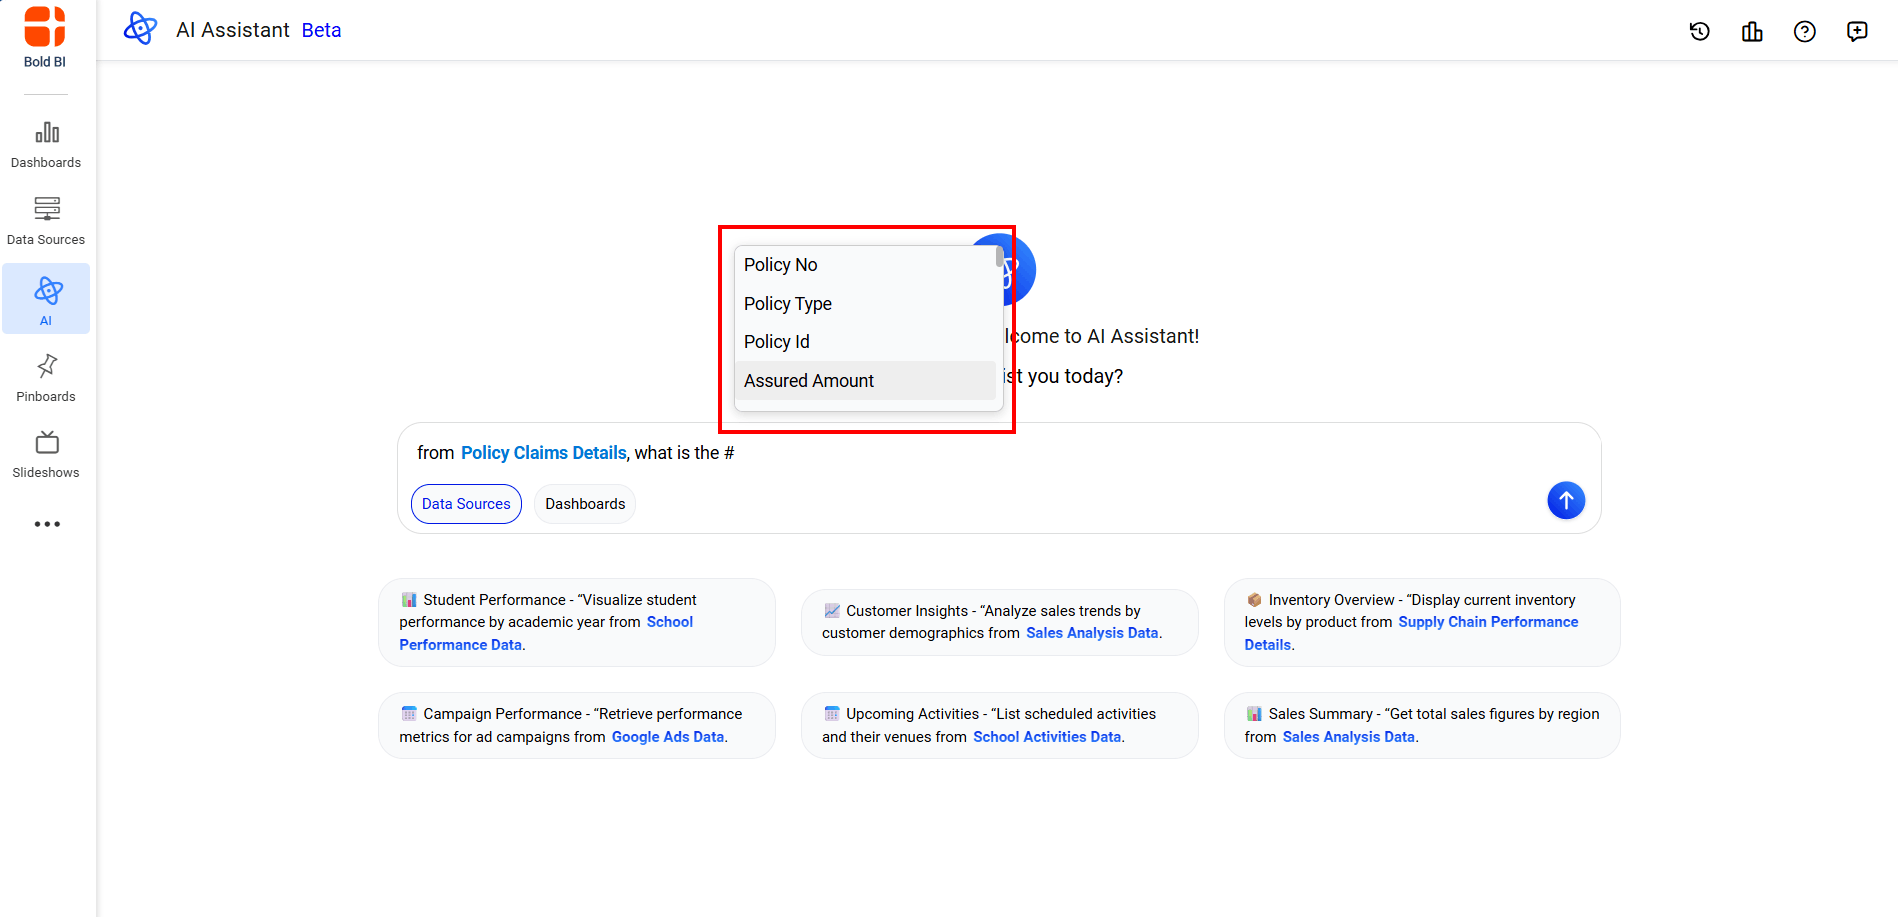
 4. For more accurate responses, type the . symbol after selecting a data source. This will display a popup showing all available columns from that data source. Select the desired column from the list to insert it into your query and help the AI generate more precise results.
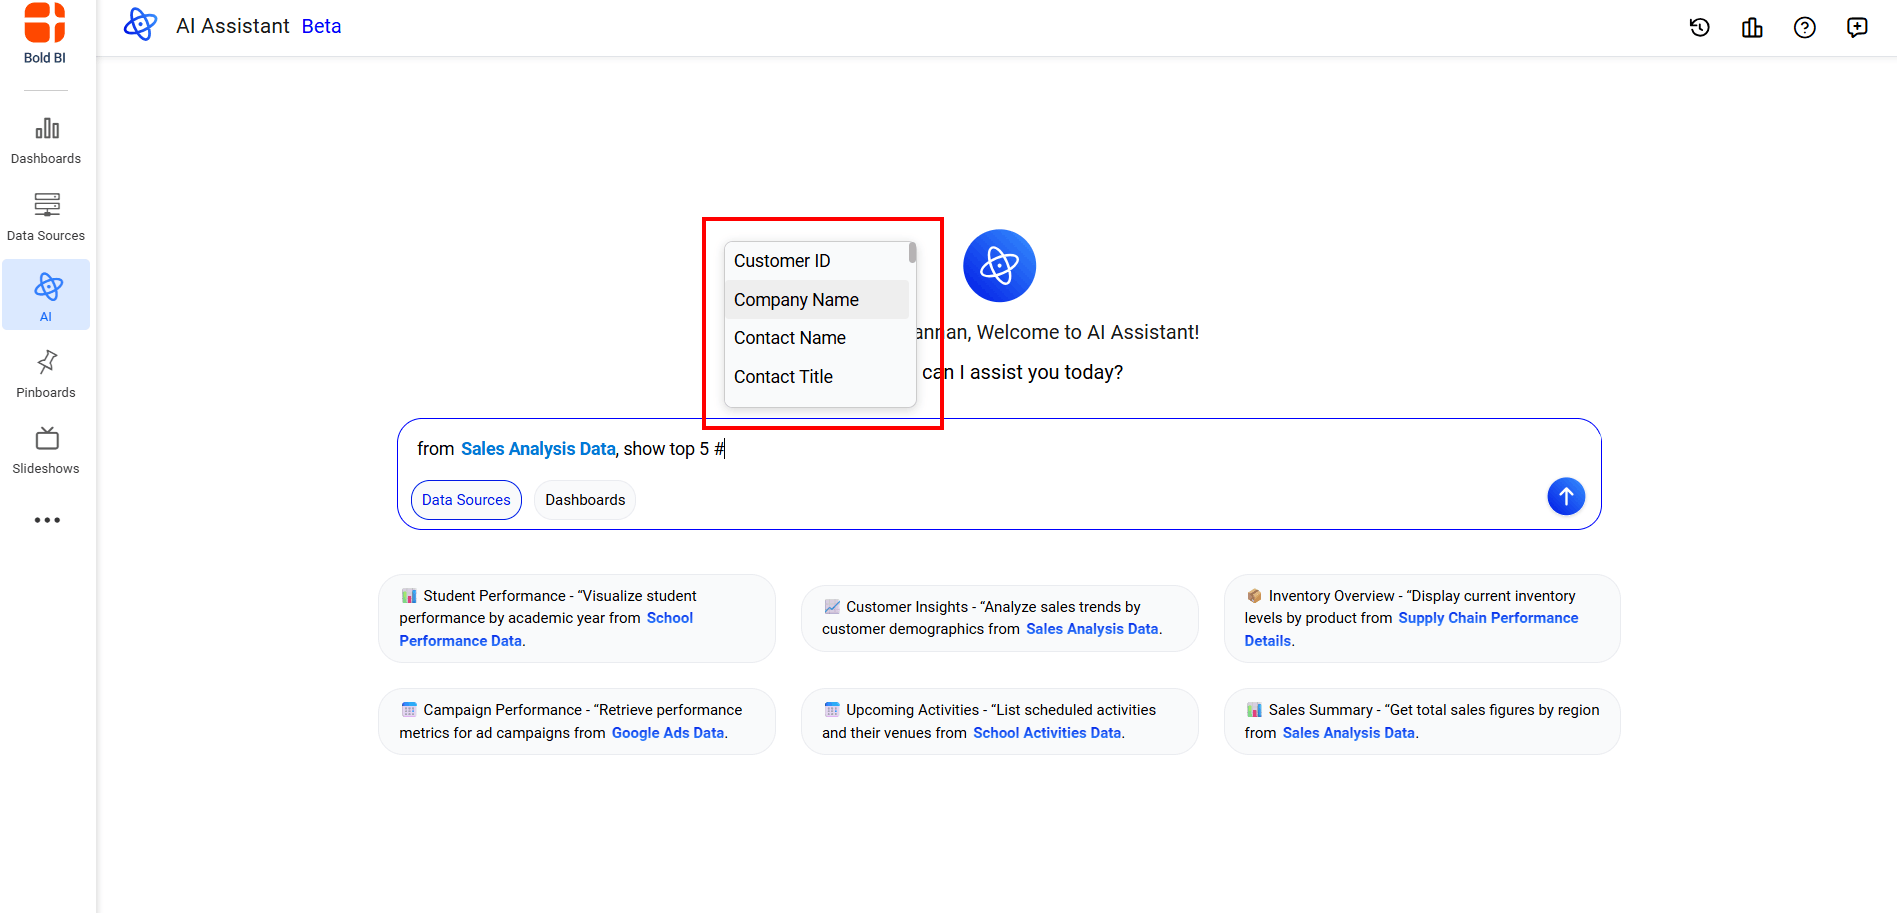
 5. Alternatively, once a data source is selected, you can insert a column reference at any point in your query by typing the
 # symbol. This will display a popup showing all available columns from the selected data source, allowing you to choose and insert the specific column into your query.
 6. Send the query to generate the visual.
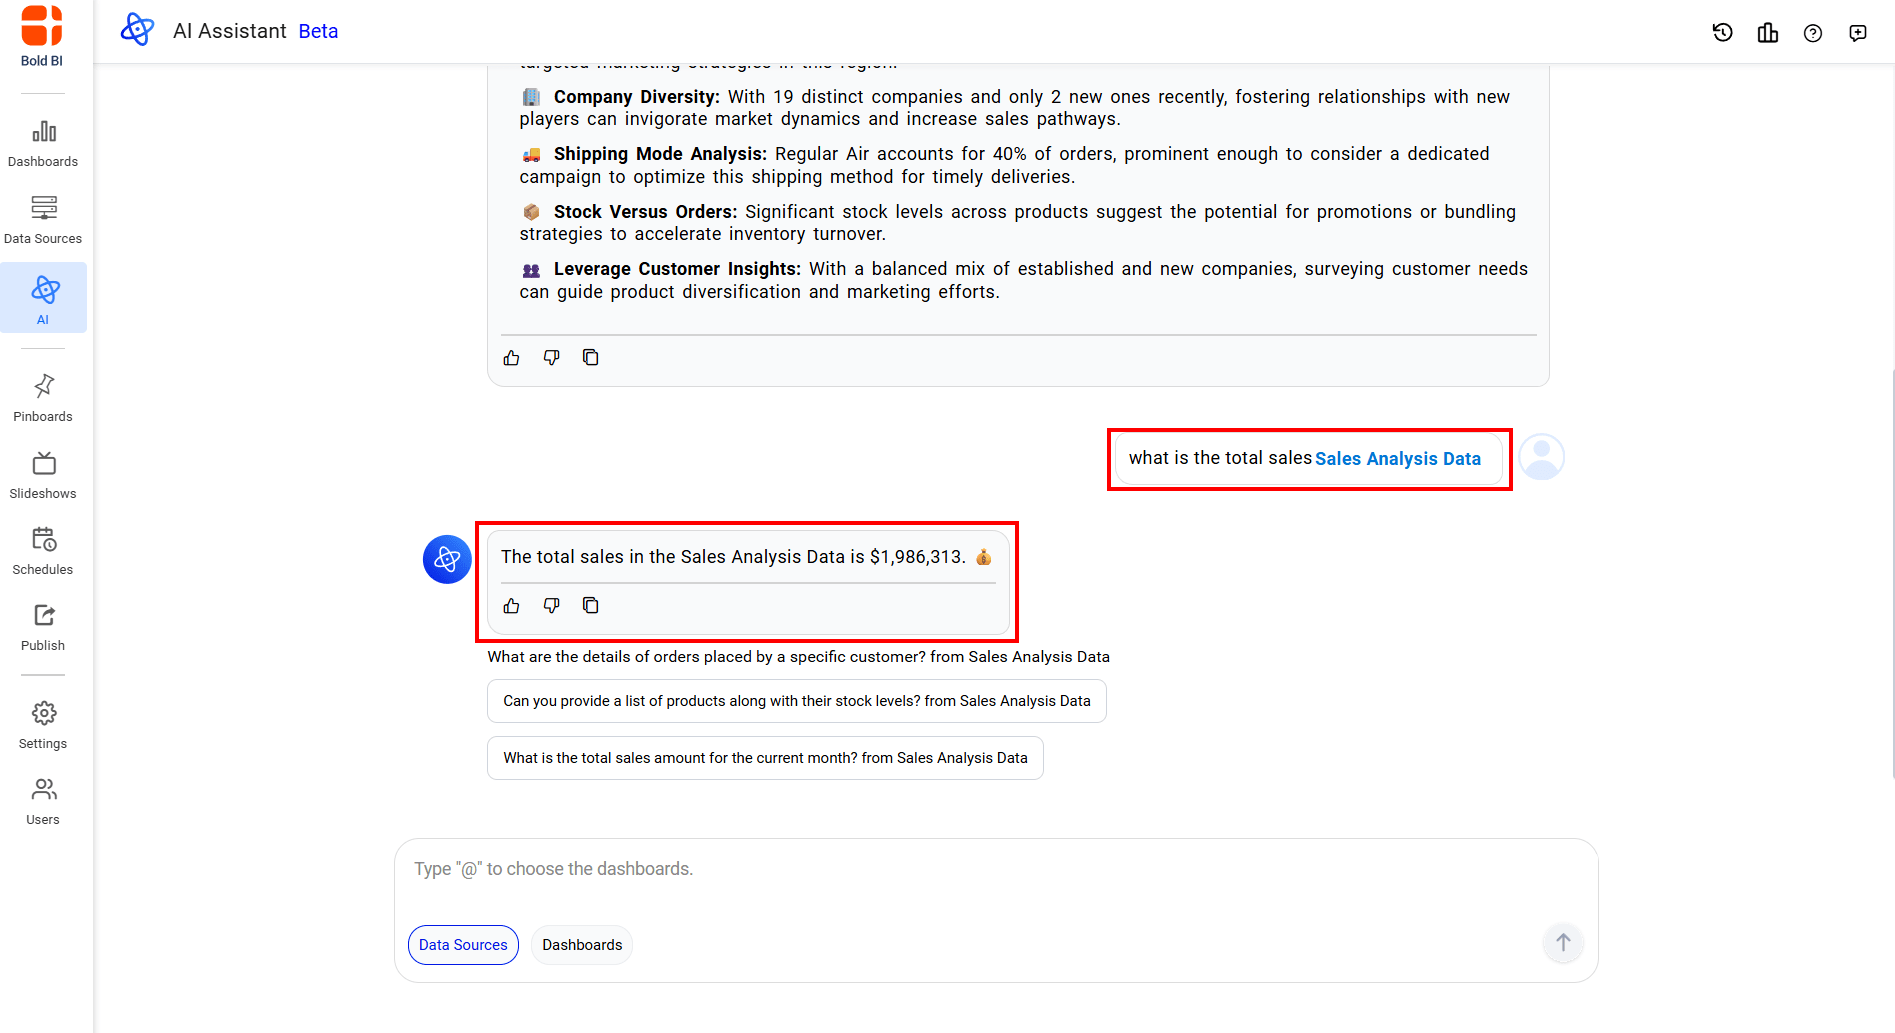
Text-Based Response
Unified AI Agent can provide detailed textual answers based on your data sources, ideal for quick insights without visualizations.
Steps for Text-Based Response:
- Ask a query for a textual response.
- Type the
@symbol to view the list of available data sources.
 3. Select a required datasource from the list to continue the query.
 4. For more accurate responses, type the . symbol after selecting a data source. This will display a popup showing all available columns from that data source. Select the desired column from the list to insert it into your query and help the AI generate more precise results.
 5. Alternatively, once a data source is selected, you can insert a column reference at any point in your query by typing the
 # symbol. This will display a popup showing all available columns from the selected data source, allowing you to choose and insert the specific column into your query.
 6. Send the query to receive a textual response.
Note: Users can submit queries only for data sources to which they have access permissions.
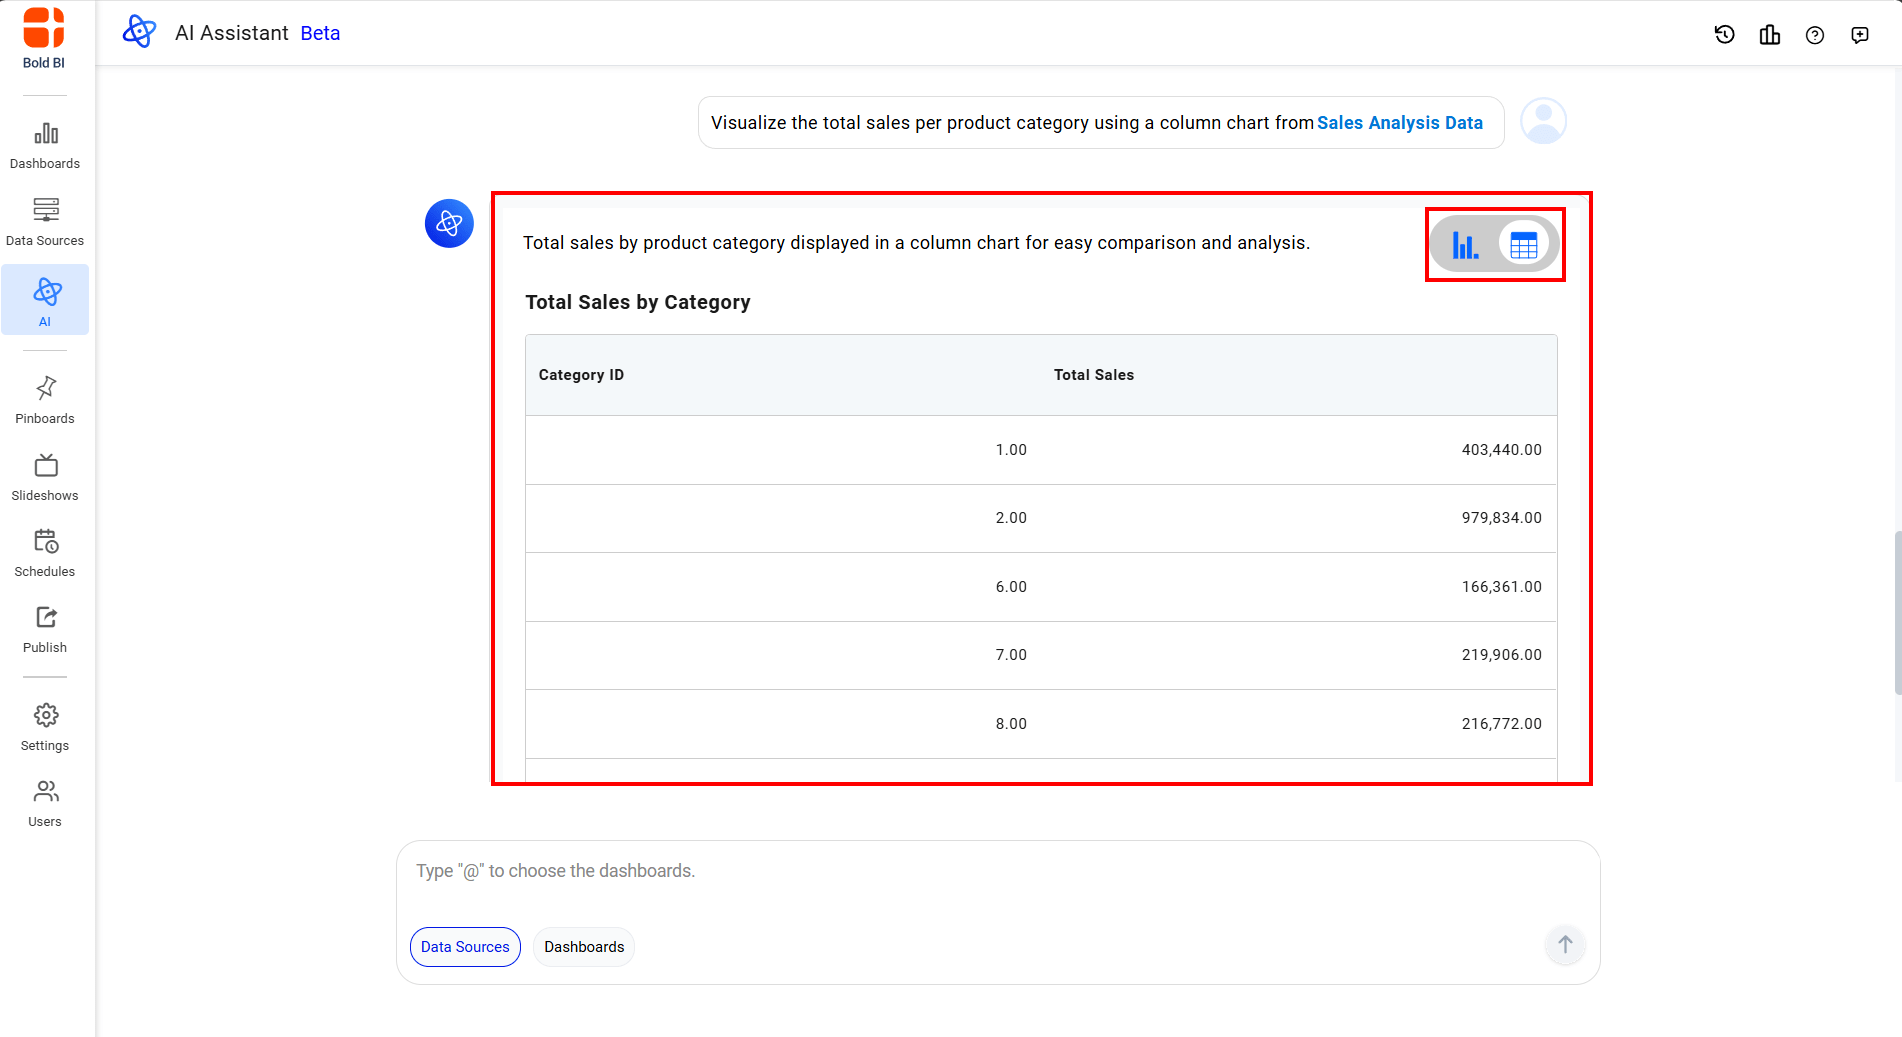
Toggling Widget Types
The Unified AI Agent enables seamless switching between chart and grid views for any AI-generated widget. The initial view is automatically determined by the AI in accordance with your query. Upon the first toggle, the alternate view is likewise generated by the AI. Once both views have been created, subsequent switches occur instantaneously, without invoking the AI again, by reusing the previously generated data and rendering it in the selected format.
Steps to Toggle a Widget
- Locate the toggle icon in the top-right corner of the widget.
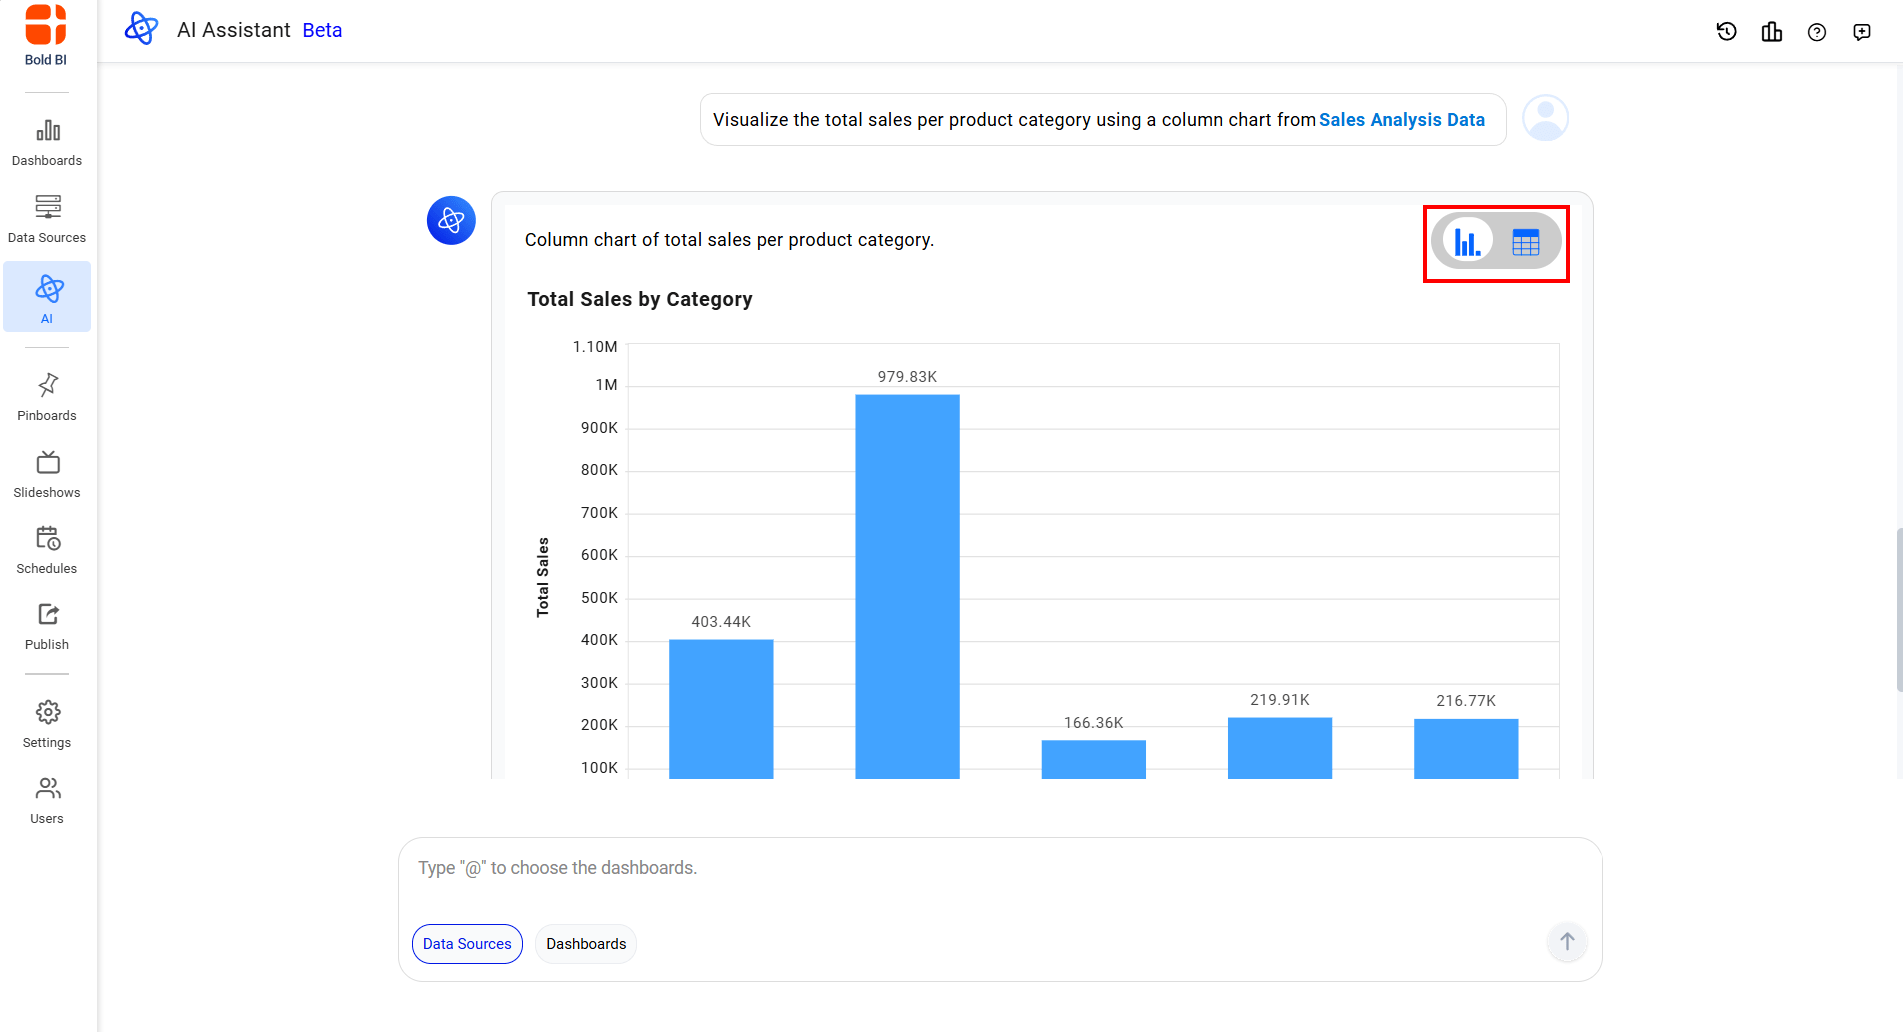 2. Click the opposite side of the switch to change the view.
Summarize Widgets
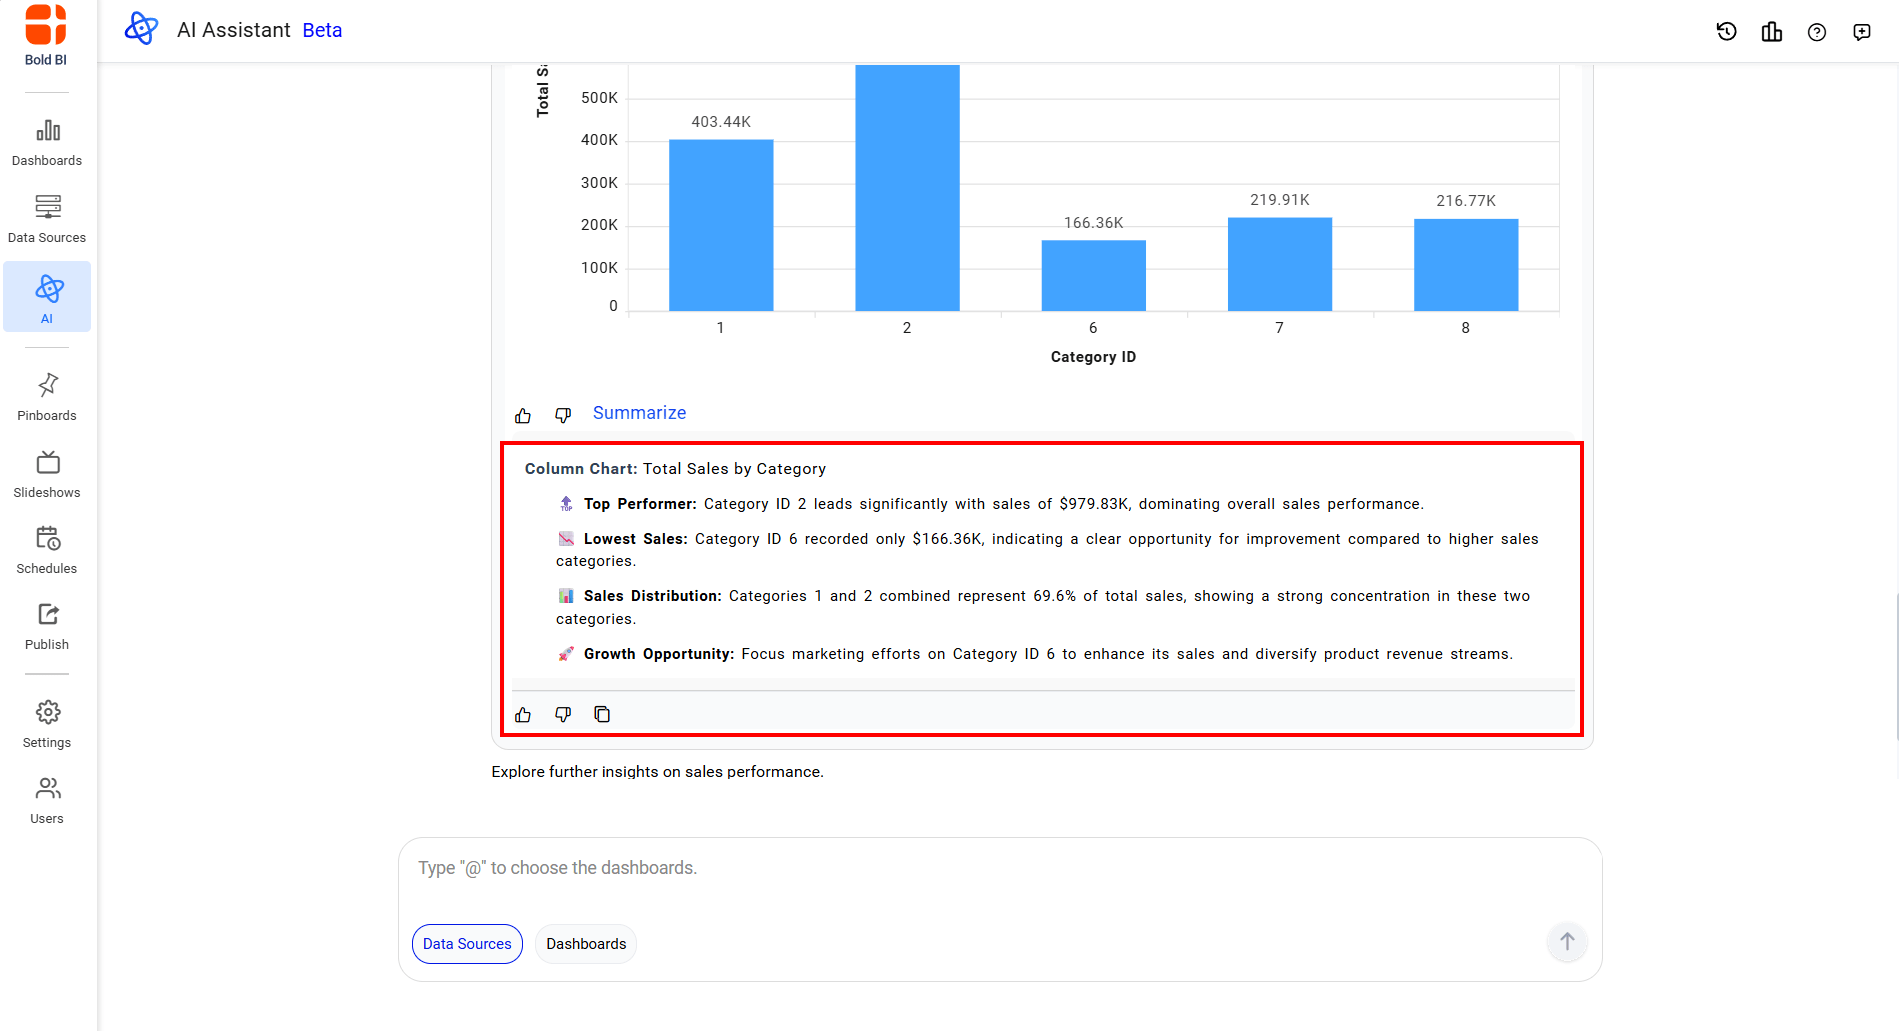
The Unified AI Agent incorporates widget summary support, delivering AI-generated insights that enable you to rapidly detect critical data trends and make well-informed, time-sensitive decisions grounded in clear, actionable intelligence.
This feature is available only when Summary is enabled in UMS or Site Settings.
Steps to Summarize a widget
- Find the summarize icon below the widget.
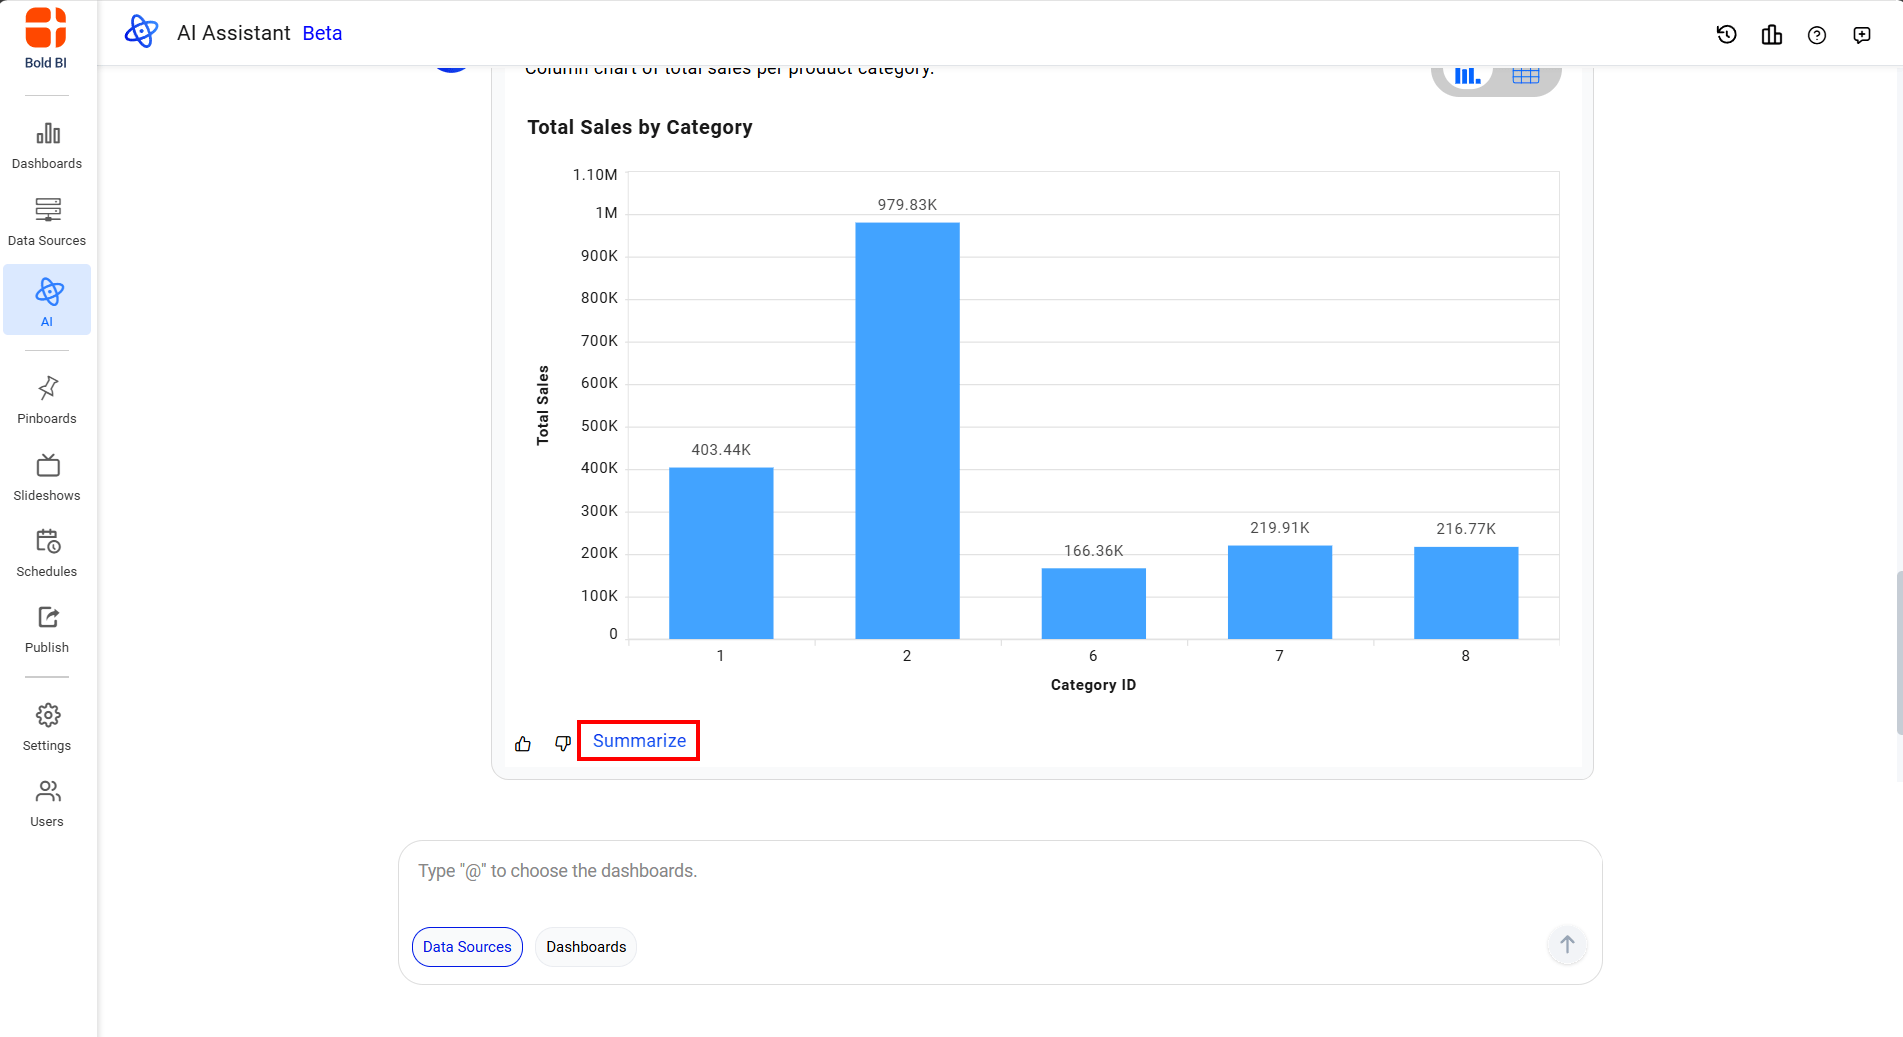
- Click the summarize icon to generate the AI summary instantly.
Note: Enable summarization in UMS or Site Settings to use this feature.
Having trouble getting help?
Contact SupportHaving trouble getting help?
Contact Support