Upload dashboards in the Bold BI application
To upload dashboards to the Bold BI application, you can use the bbix file in Bold BI Embedded. Here is a step-by-step guide on how to upload dashboards to sites in Bold BI:
Prepare dashboards for uploading
To upload the dashboard(s) from site(s), follow these steps:
-
Click on the option to upload the dashboard in
Bold BI.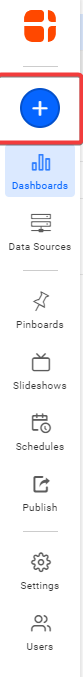
-
Click the
Upload Dashboardsbutton to open the UI where you can upload the dashboards. This action will open the dashboard upload interface, where you can upload the desired dashboards.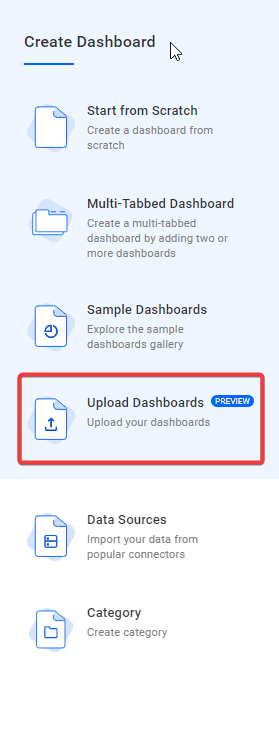
-
In the upload interface, follow the instructions to select the dashboard files you wish to upload.
-
After the dashboard uploads, the interface will be rendered and displayed on the user interface.
-
Click on the
Browseoption to navigate to the downloaded file location. -
The dashboard files can have either
bbixorzipextension.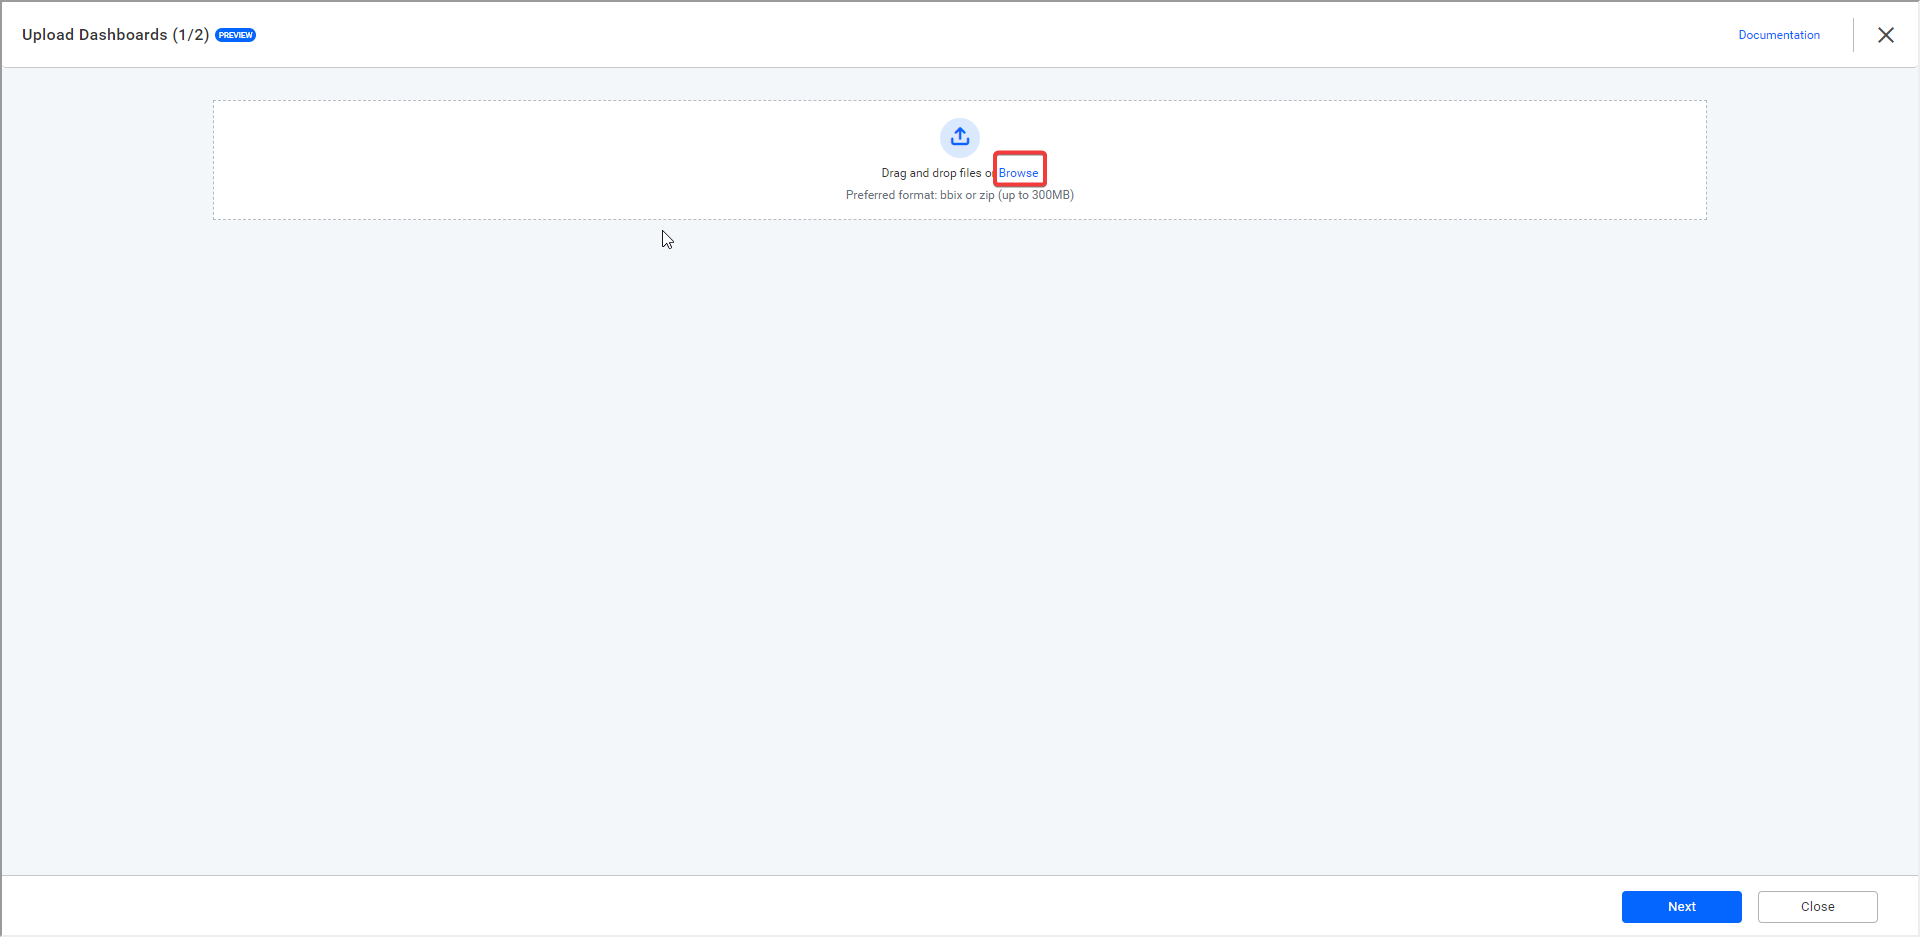
-
-
After selecting the required dashboard files to upload, wait for the upload process to complete.
-
You will receive a message indicating that the files have been successfully uploaded.
-
Once you see this message, you can proceed to the next step by clicking the
Nextbutton.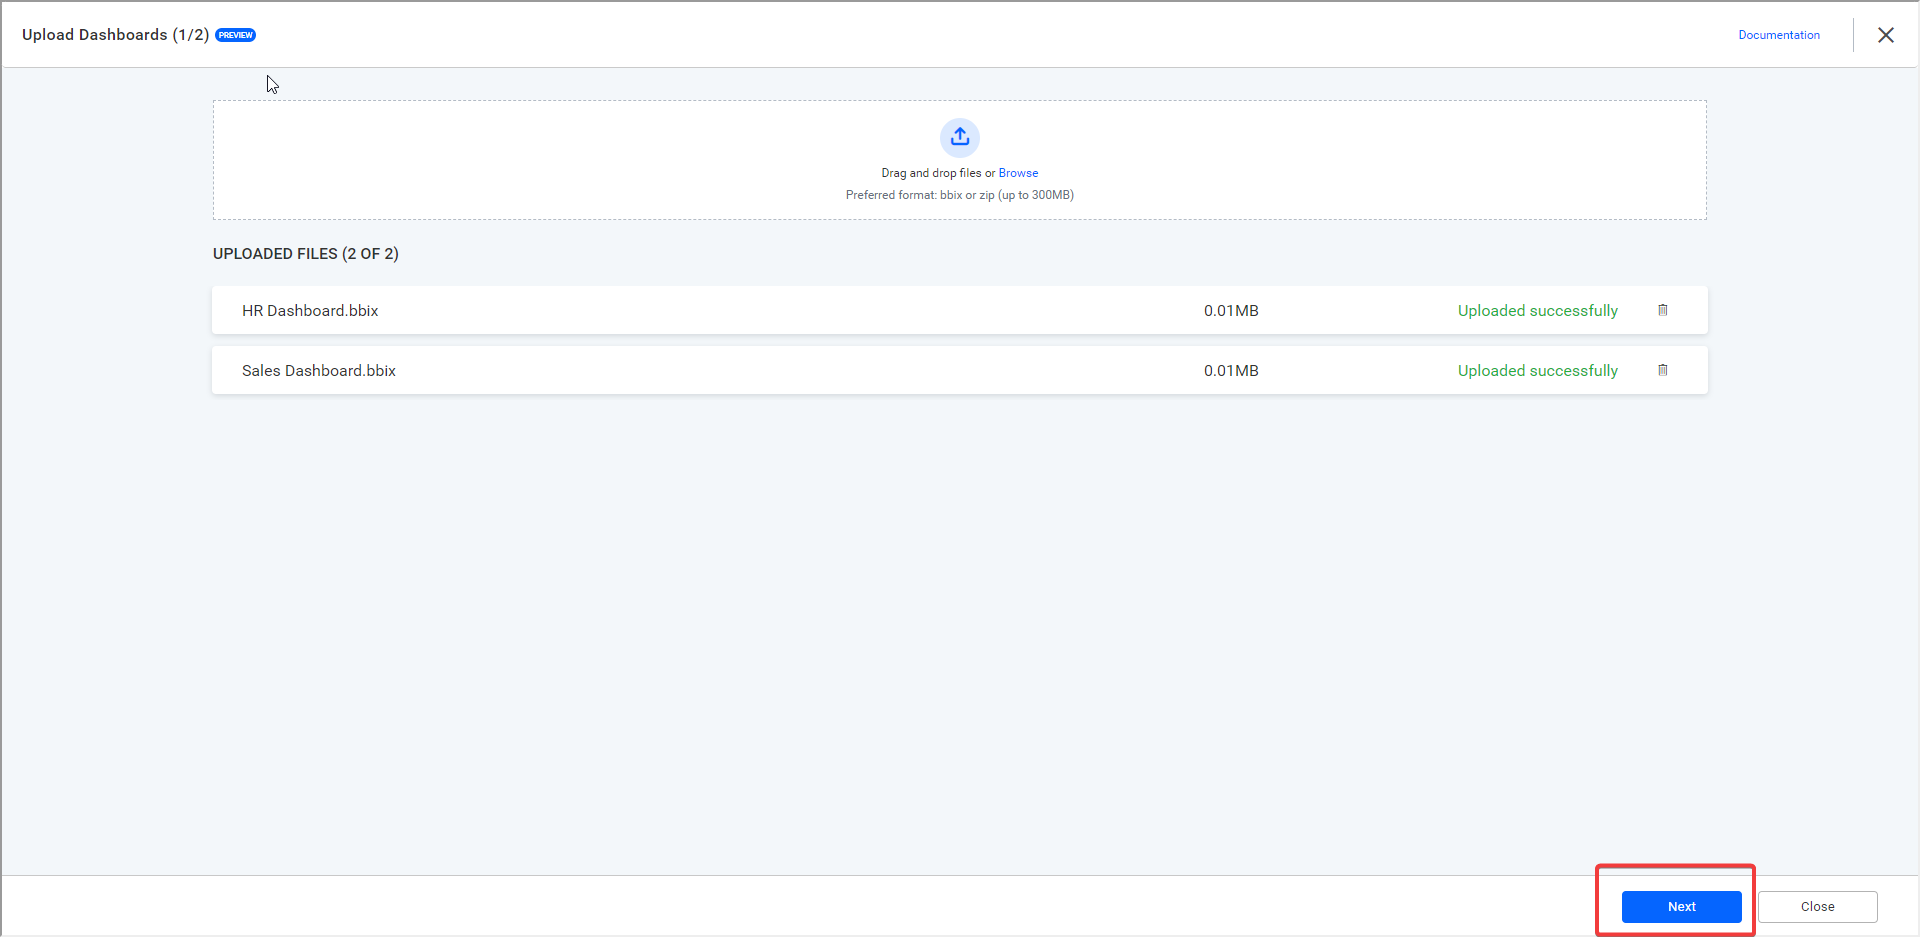
NOTE: Only files that have been successfully uploaded will be considered for the uploading process. If any files do not display the message
Uploaded successfully, they will not be uploaded and will be discarded. Therefore, ensure that all dashboard files have been successfully uploaded before proceeding to the next step.
Updating the dashboard files for uploading
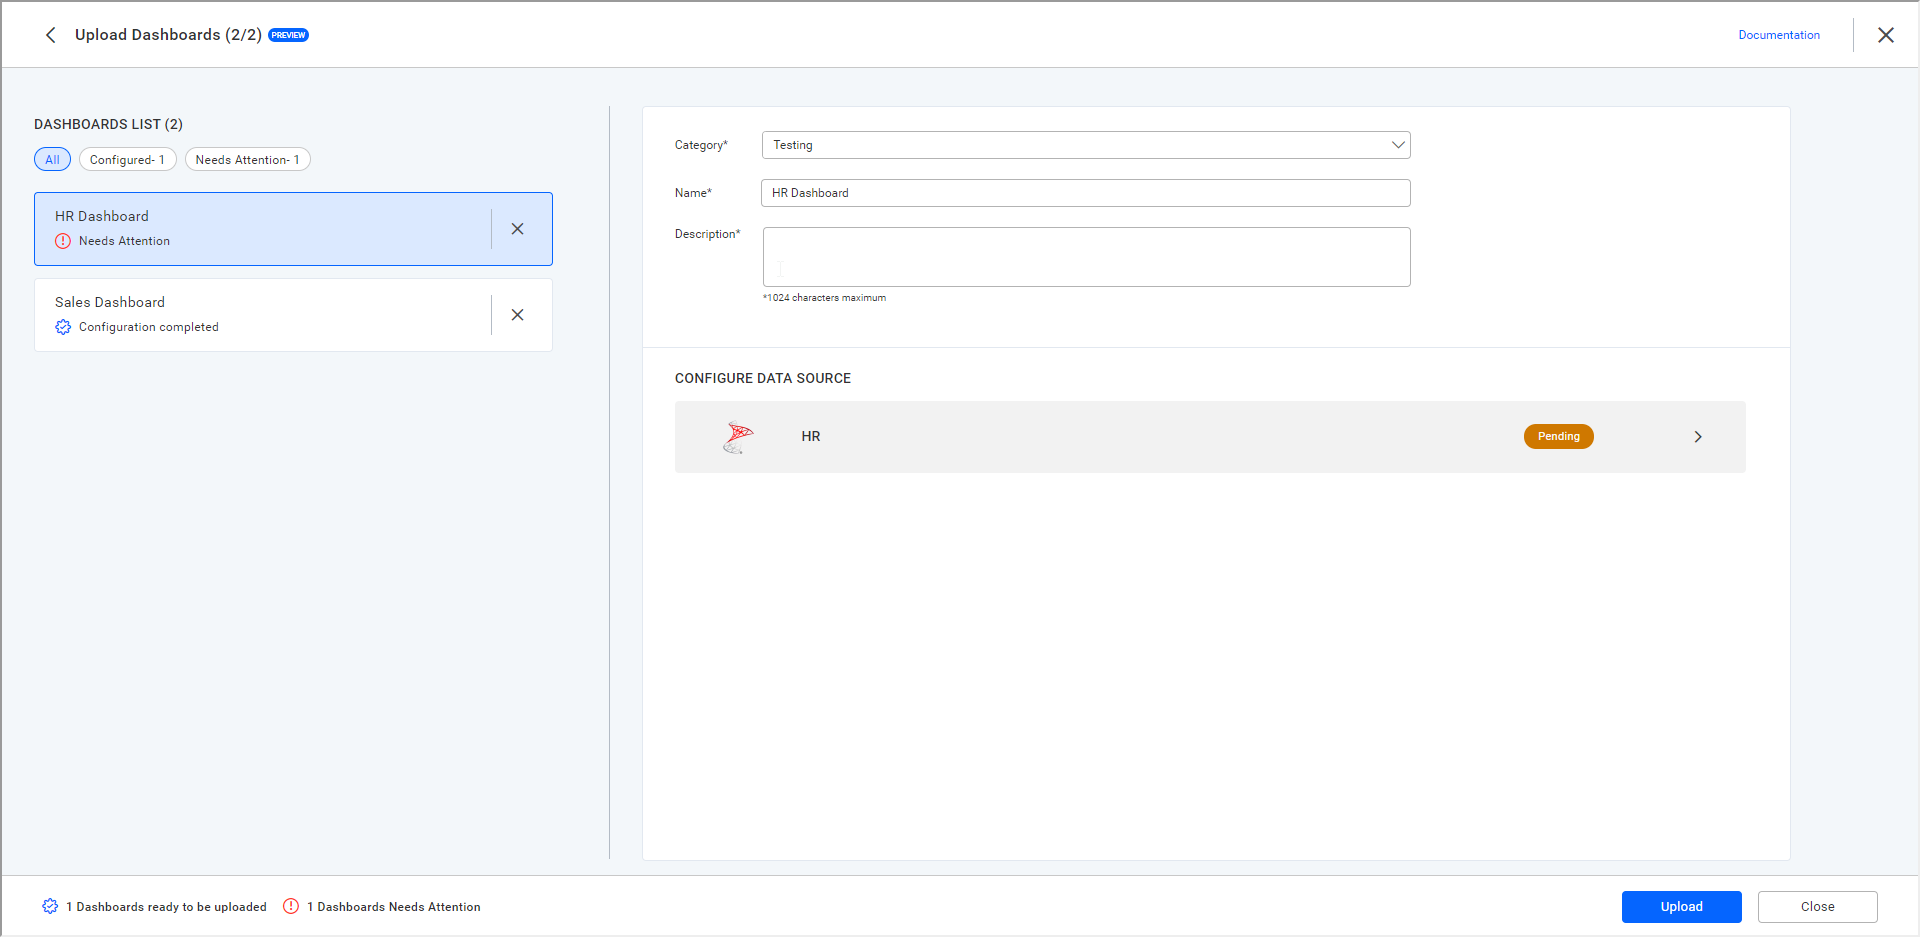
After successfully uploading the required dashboard files, a new user interface will be displayed to update the details of the uploaded dashboards. The updated interface will appear as shown below.
Updating the dashboard information
The following information can be updated in the uploaded dashboards:
-
Updating the category.
On clicking the
Category, the category can be changed. There is also an option to create a new category as shown below.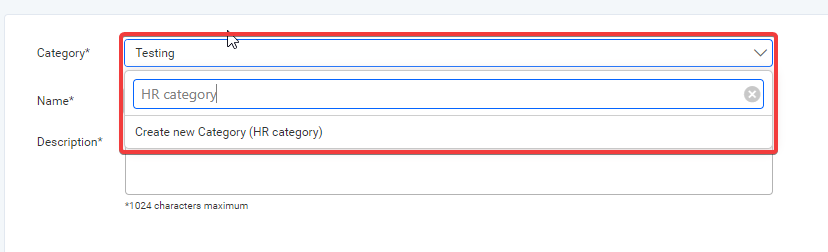
On clicking the
Create new Category, the new category will be created. -
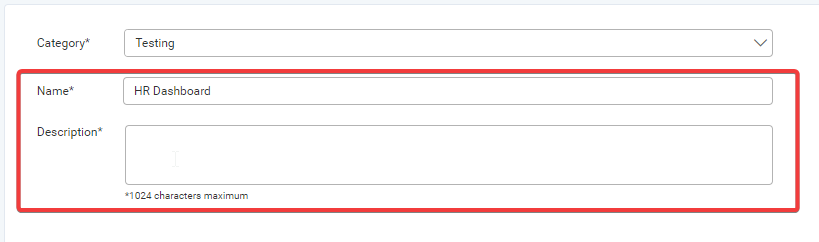
Name and Description.
You can update the name and description of the selected dashboard using the following inputs.
Updating the data source information
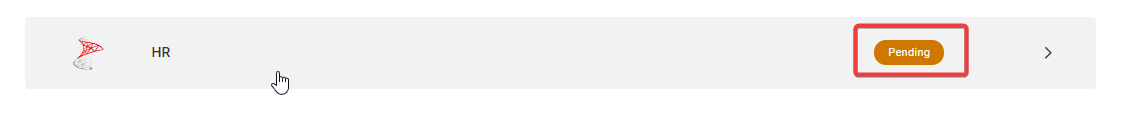
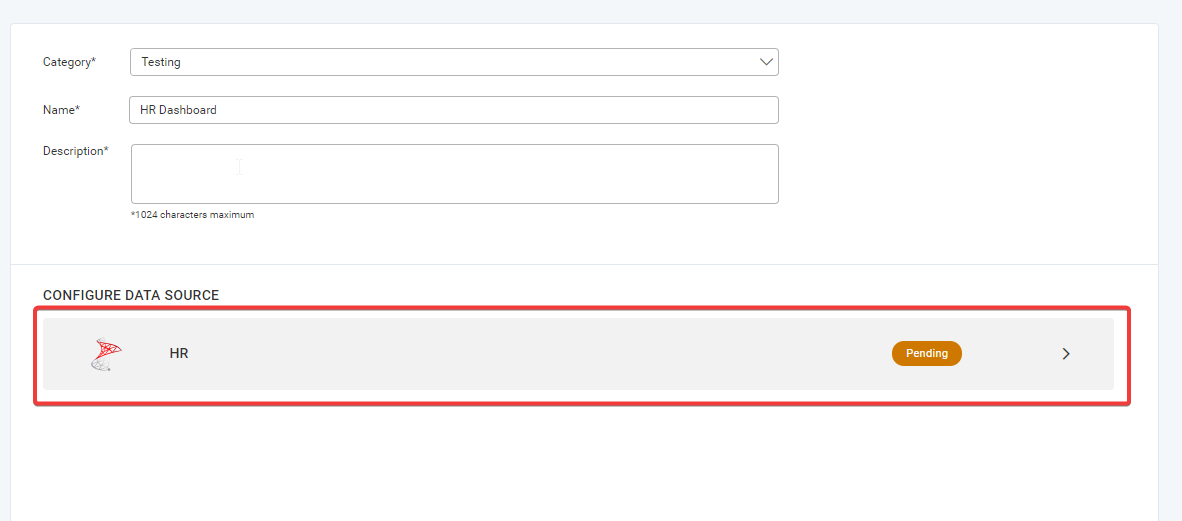
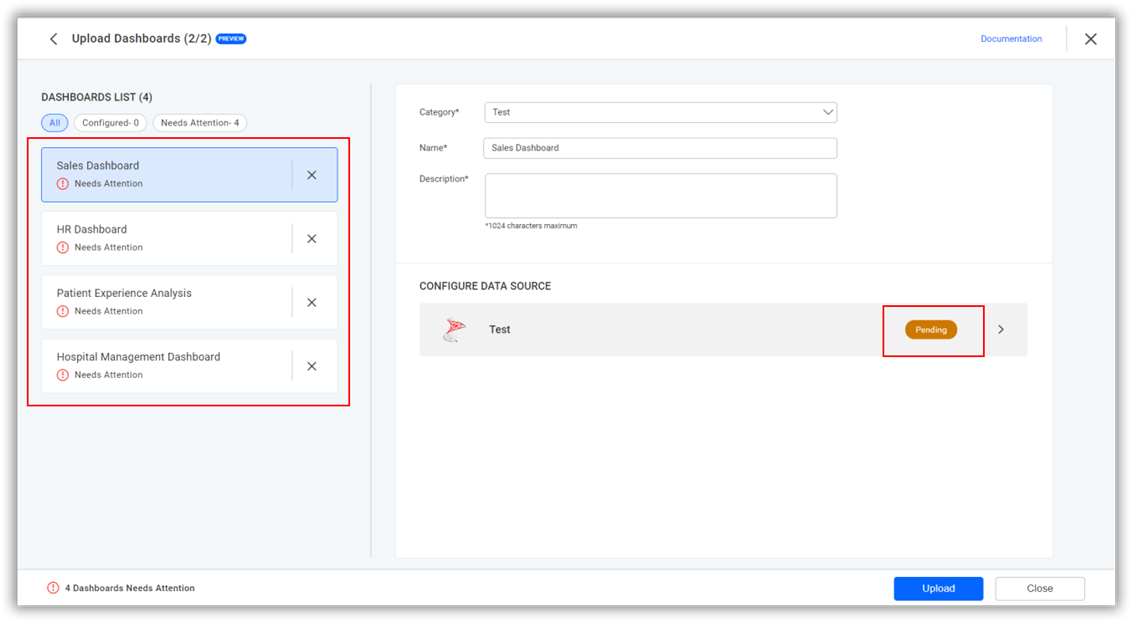
- The uploaded dashboard will have data sources that will be in a
PendingorCompletedstate based on the configuration completed for that particular data source.
The following are two data sources with different configuration states:

NOTE: Dashboards downloaded by enabling the
Include sensitive informationwill have all data sources in theCompletedstate. If not, they will all be in thePendingstate.
-
To change the Pending state, you need to click the data source list as shown below.
-
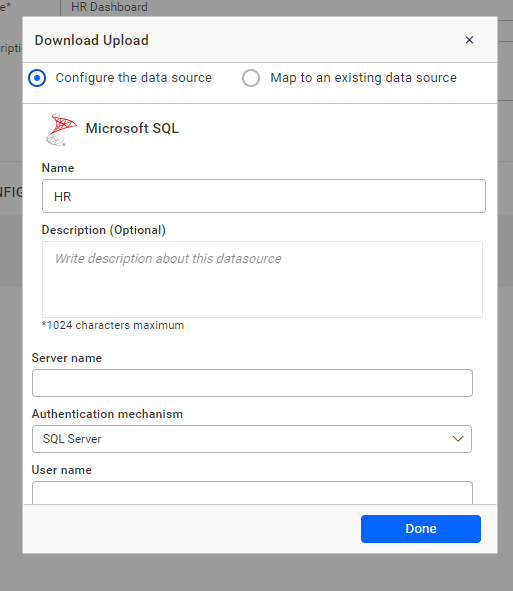
A dialog will render, which provides two options to update the configuration of the data source as follows:
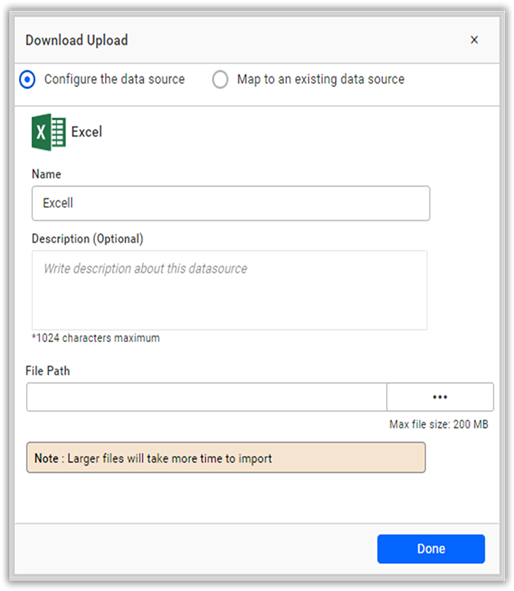
Configure the data source
This will provide an option to alter the details of the data source, as shown below.
To configure the Extract data sources, follow the below steps:
NOTE: Choosing the file or URL for the reconnecting data source should have the same file name and column as the existing data source configured in the dashboard. Otherwise, it will show the error message
New schema differs from existing data sourcein the UI.
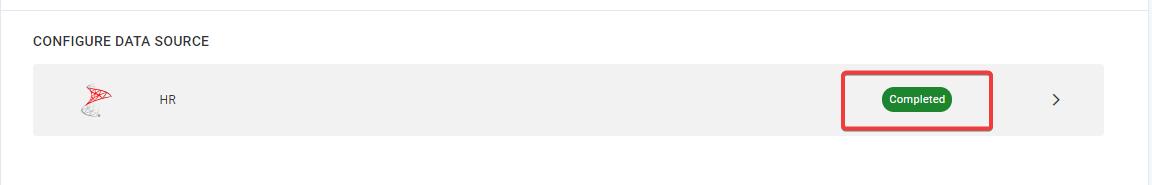
After the details are updated and the Done button is clicked the data source will be validated.
The data source configuration status will be updated as Completed as shown below.
Map to an existing data source
This will provide the option to link the current data source to a data source that is already present in the same tenant, as shown below.
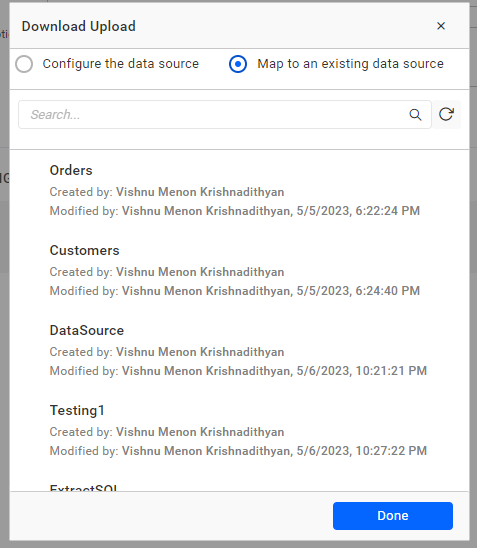
After selecting the data source and clicking on the Done button the data source will be validated.
The data source configuration status will be updated as Completed as shown below.
NOTE: The data source schemas should match in both of the above options.
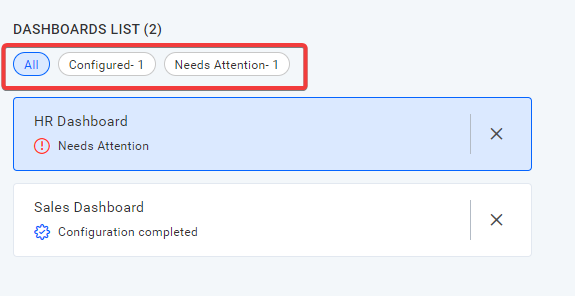
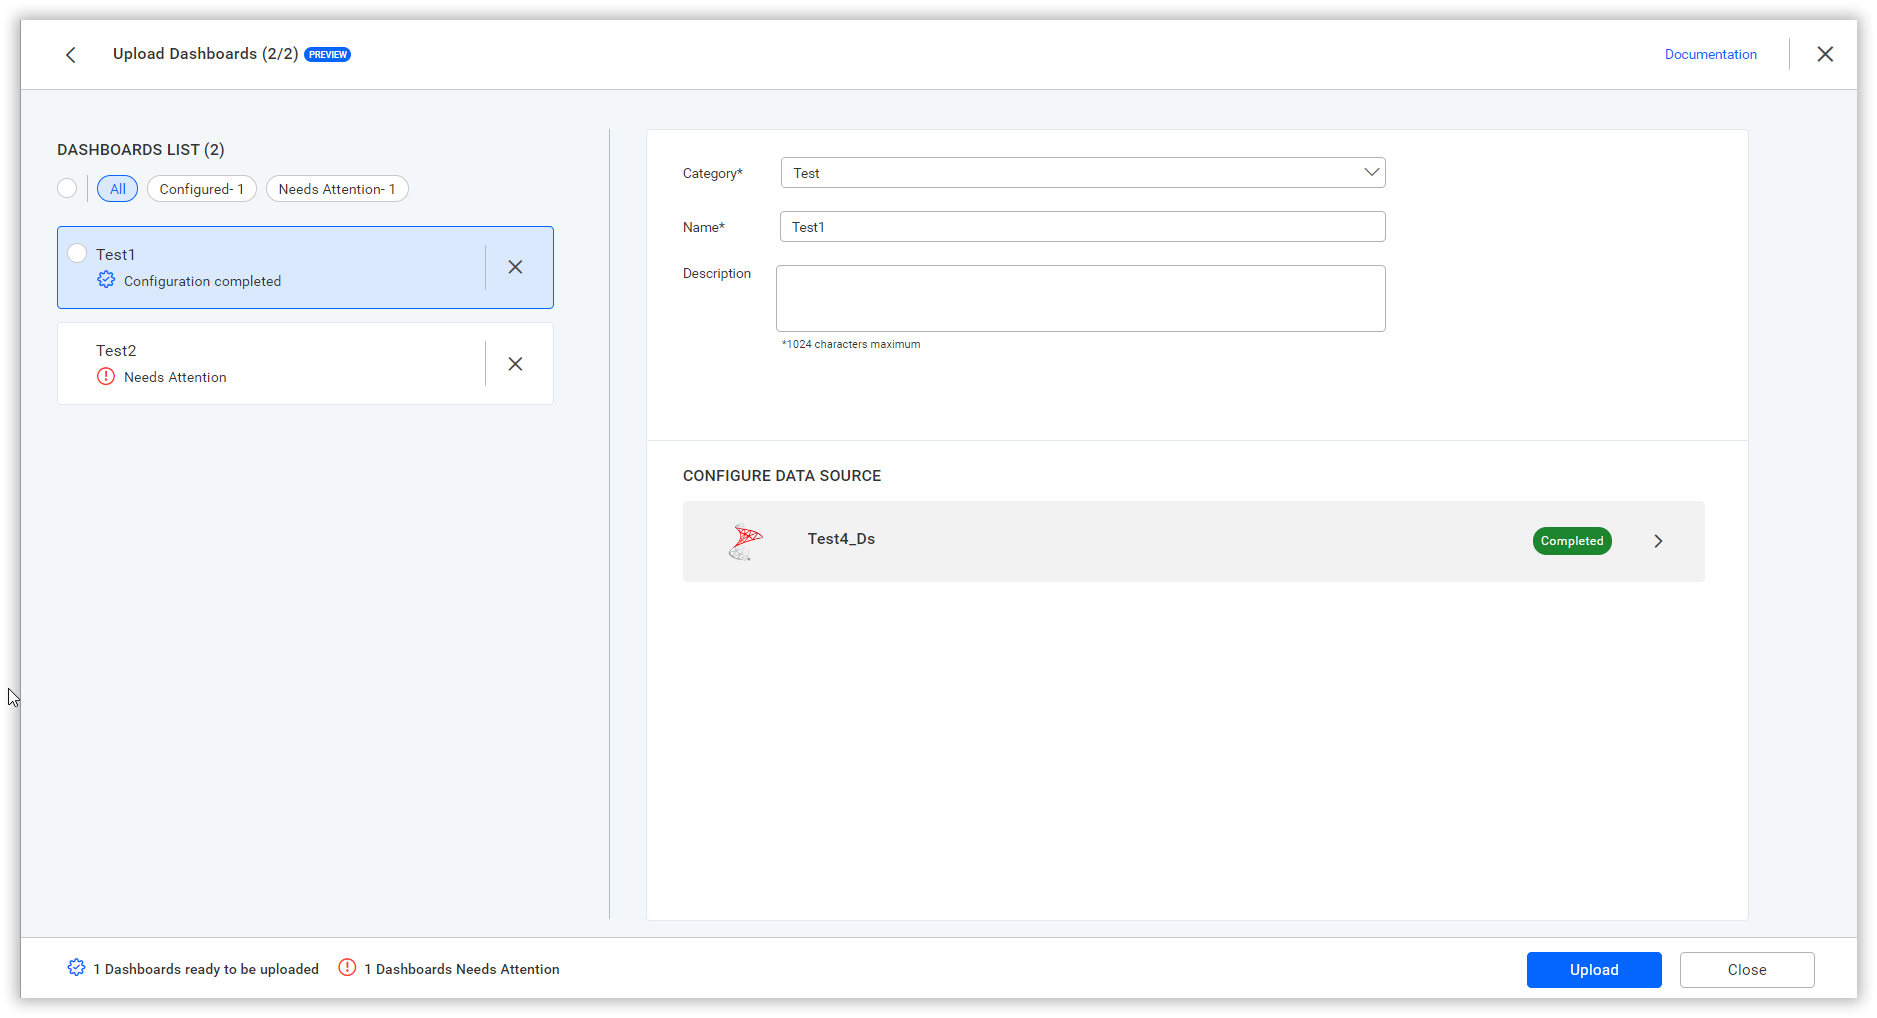
User interface indications
You may find that on the left side of the user interface within the Dashboard List, one of the dashboards is in the Needs Attention state and Configuration Completed state, as shown below.
After all of the data sources present in a dashboard are configured and updated as Completed, then only the dashboard listing will be updated as Configuration Completed.
For example, in the above image, you have HR Dashboard in Needs Attention state, since the only data source present in the dashboard is still in pending state. If the dashboard has more than one data source, all of them should be in Completed state so that the dashboard will be updated as Configuration Completed.
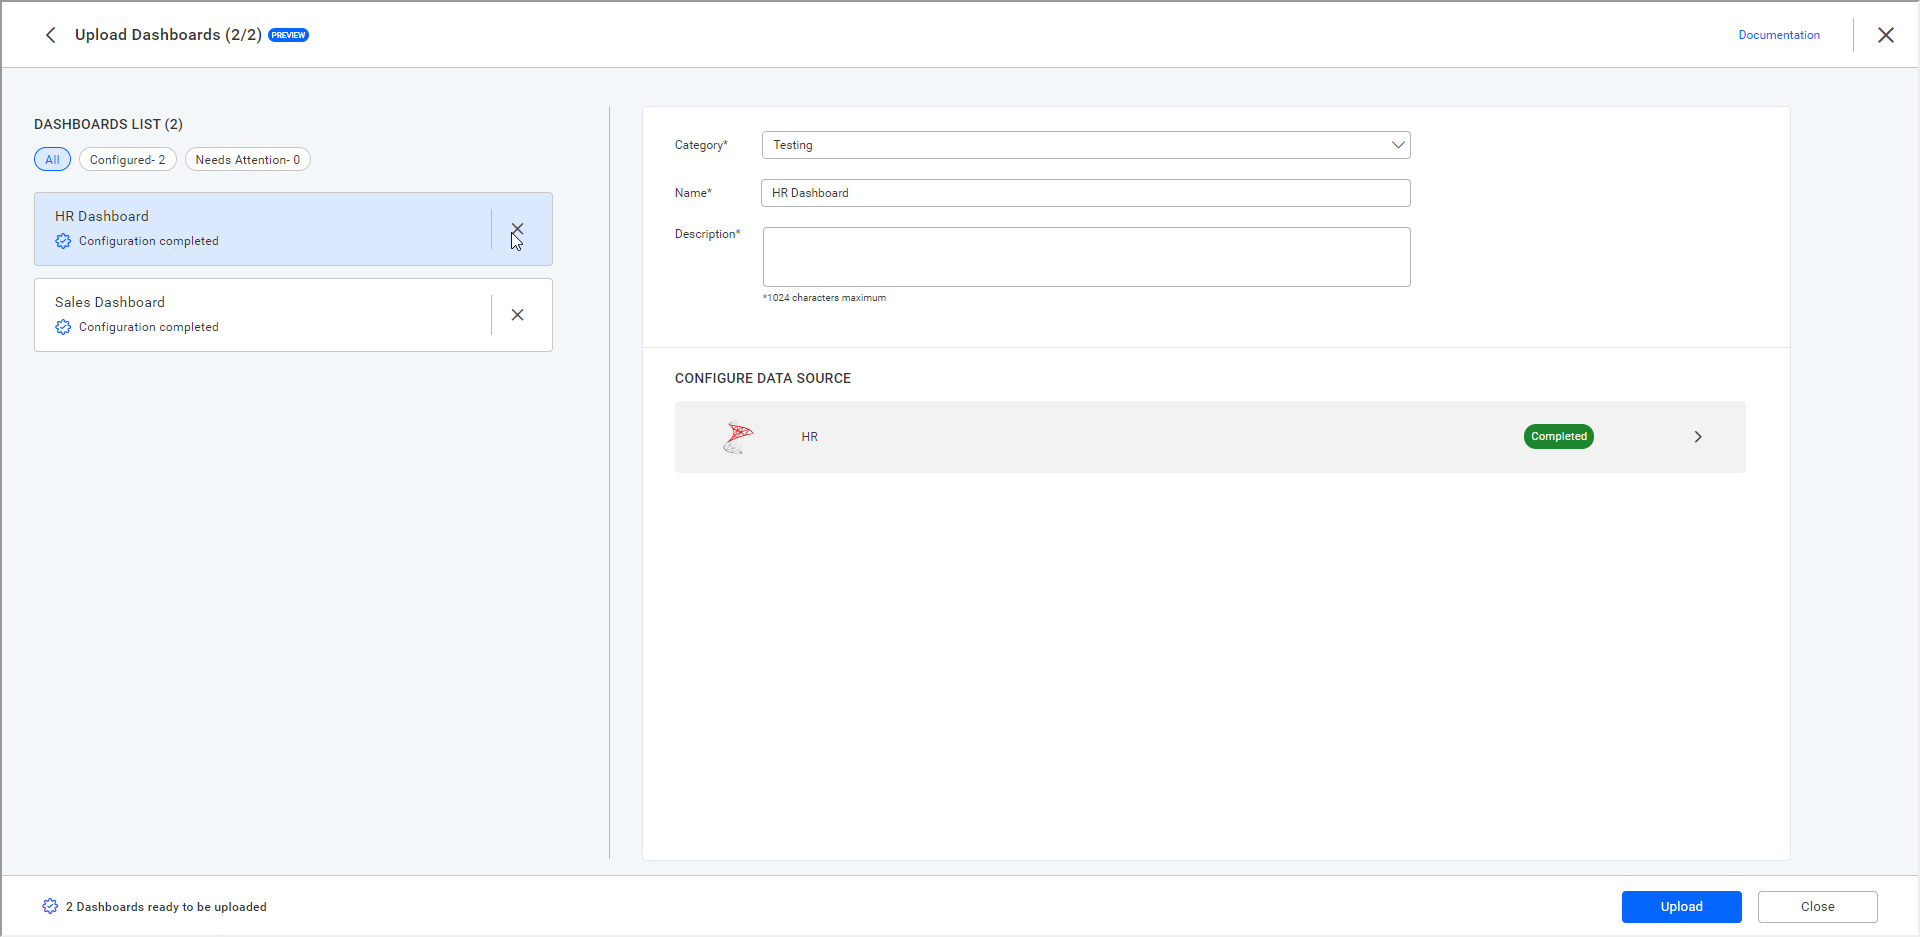
Similarly, You will be updating the bottom of the page with the updated information regarding the dashboard status as shown below.

You have the option to filter the dashboards based on the Configuration State, as shown below.
After completion of the data source configuration, the user interface will look as follows.
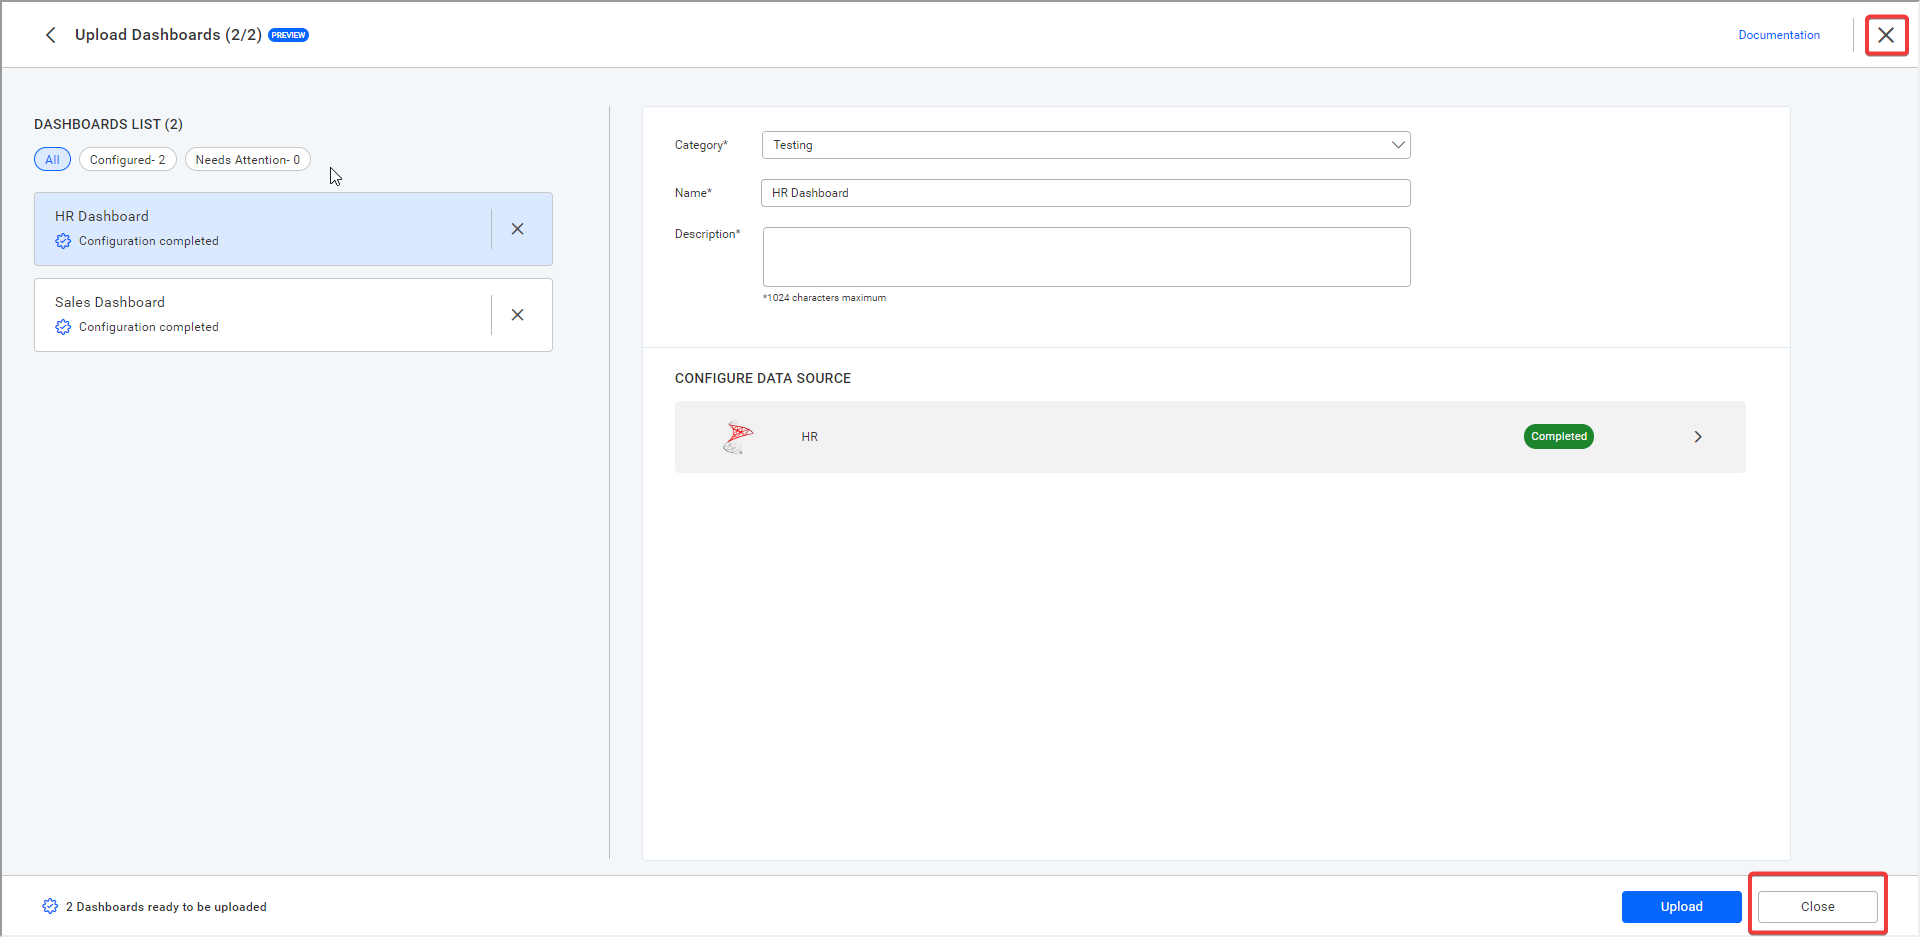
Working with upload drafts
Throughout this process, you can close the dialog box by clicking on the close button or cross icon displayed below.
After clicking, you will receive a message prompting you to close, along with an option to navigate to the Upload Drafts page as shown below.
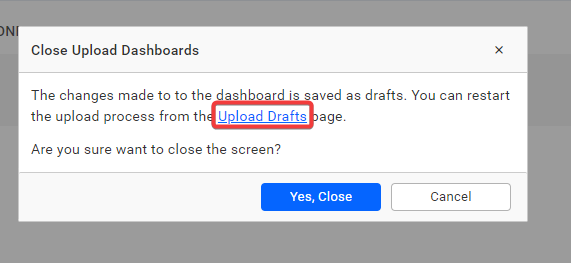
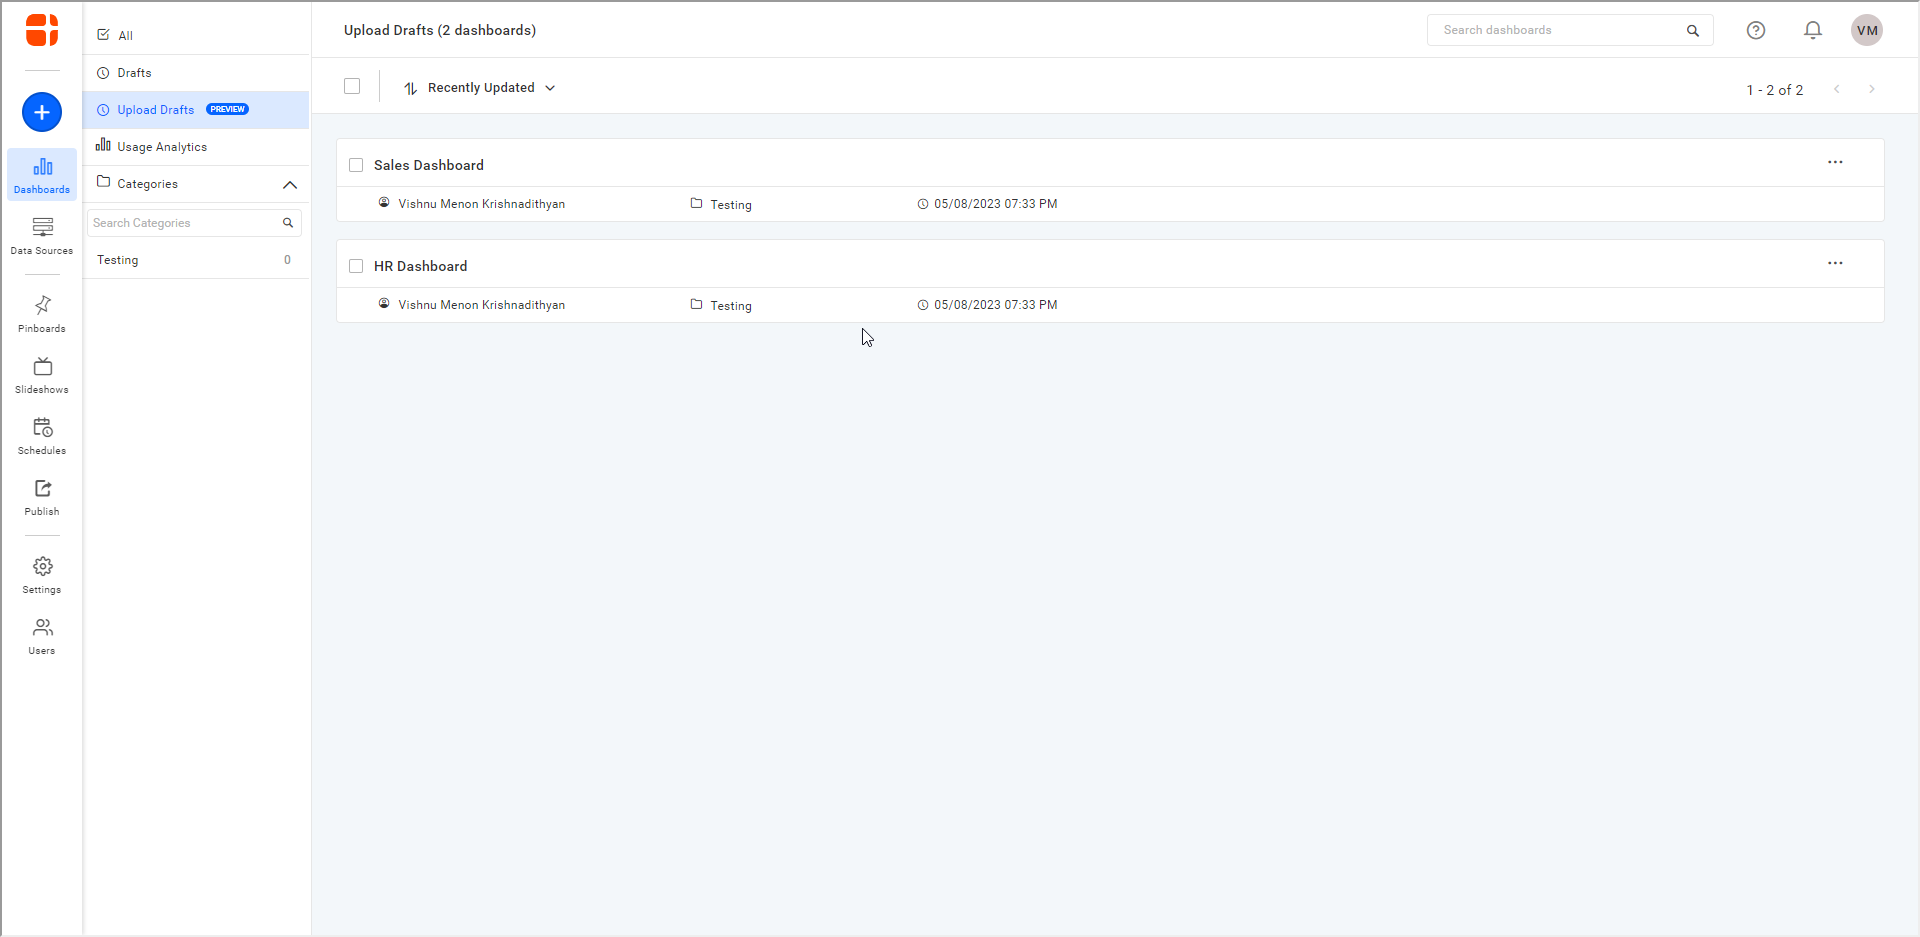
The uploaded files will be visible on the upload-drafts page. Once redirected to the page, the user interface will be displayed as follows:
You can select multiple dashboards from the upload-drafts page to resume where you left off. To proceed, select the multiple dashboards and click the Complete Upload button, as shown below.
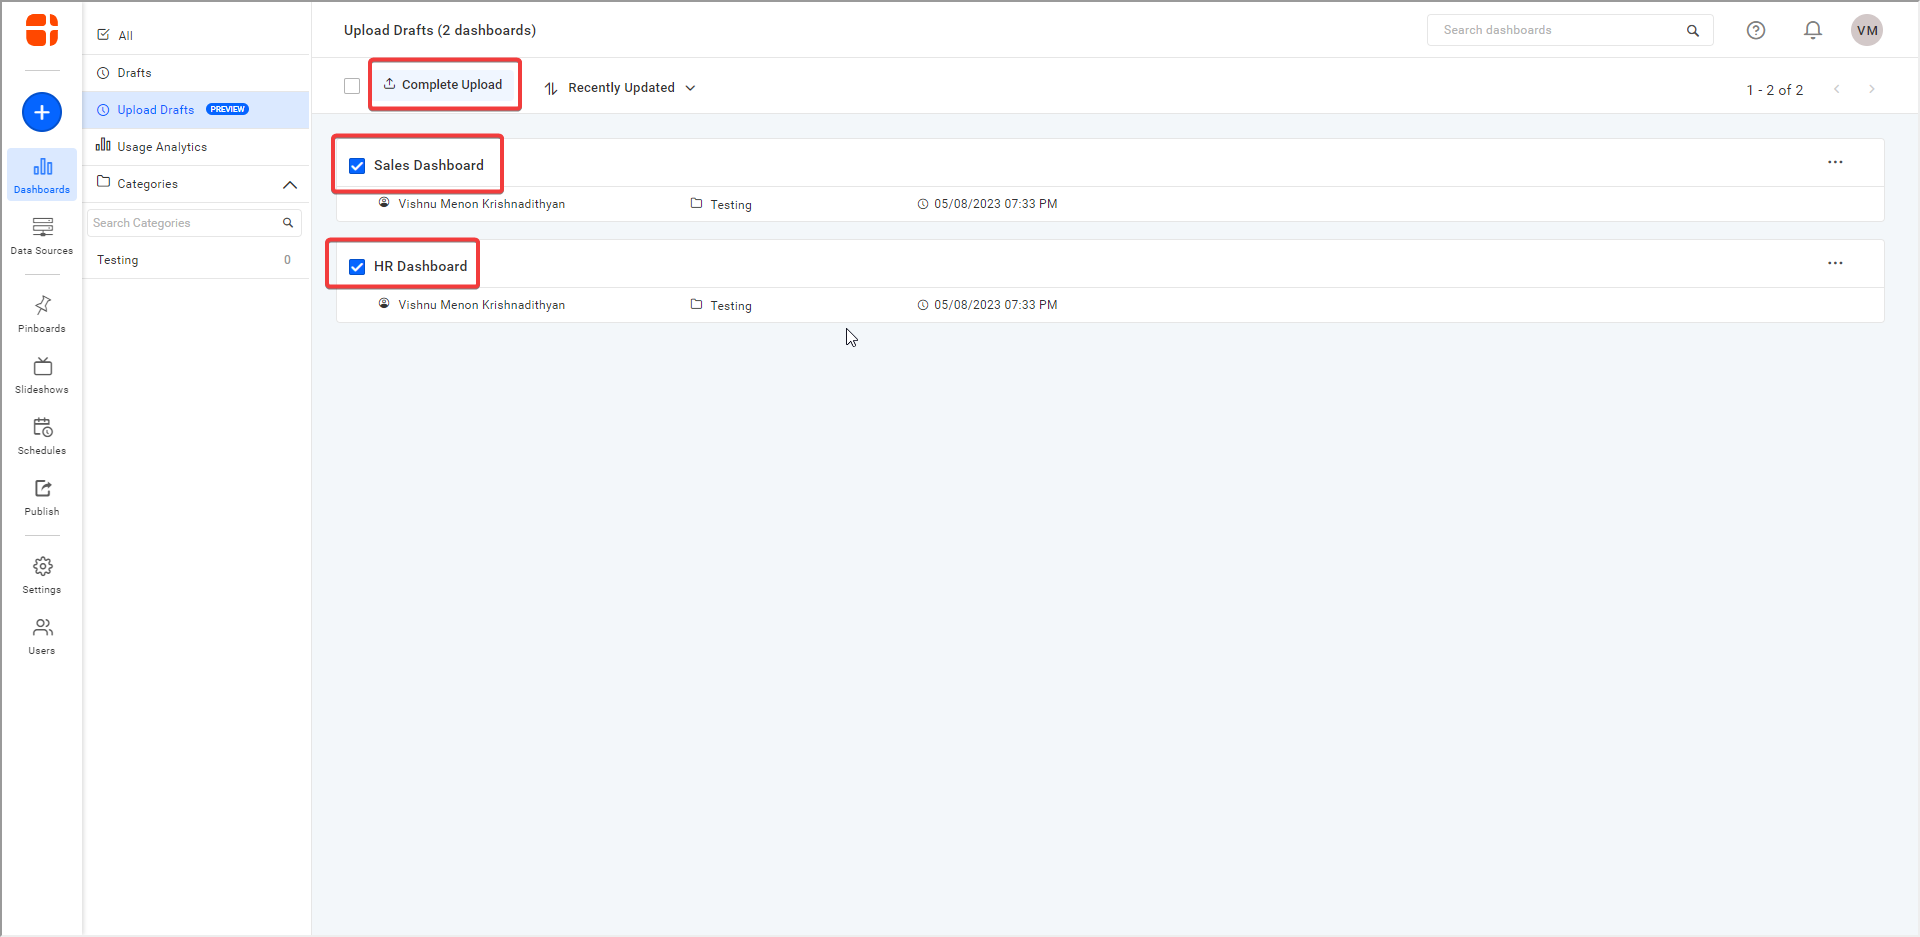
This action will display the user interface to upload the dashboards.
Uploading the dashboards.
NOTE: The dashboards that have been marked as
Configuration Completedwill be only considered for uploading.
Upon clicking the Upload button, the dashboards will be uploaded, and the user interface will appear as shown once the process is completed.
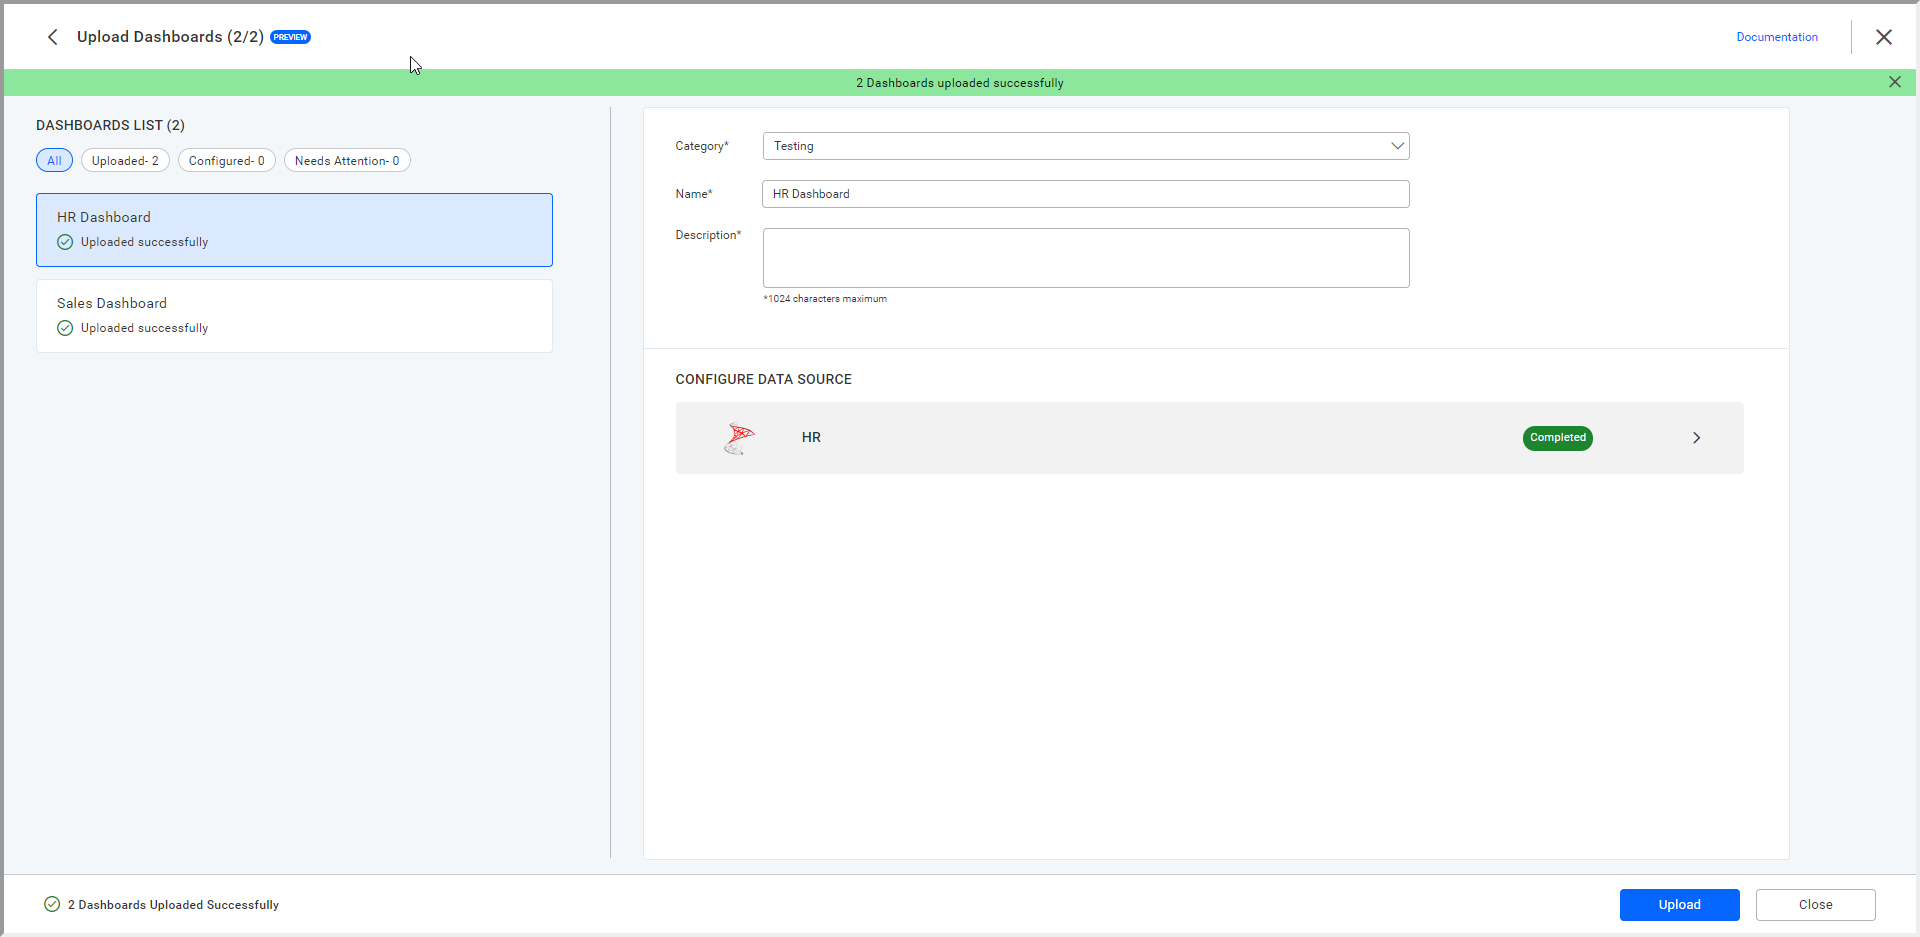
You can find the uploaded dashboards in the tenant, among any other existing dashboards.
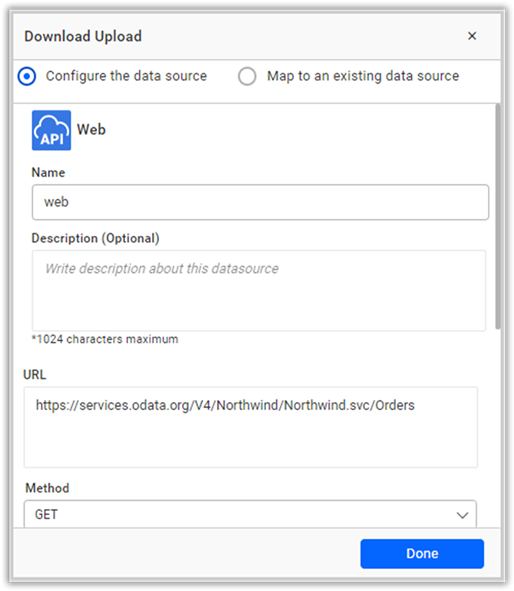
Configure the web data source
Here, you have the option to provide credentials for the web data source you are uploading as follows.
Configure the file type data source
Upload a file with the same file name and columns as the existing data source configured in the dashboard to create the data source.
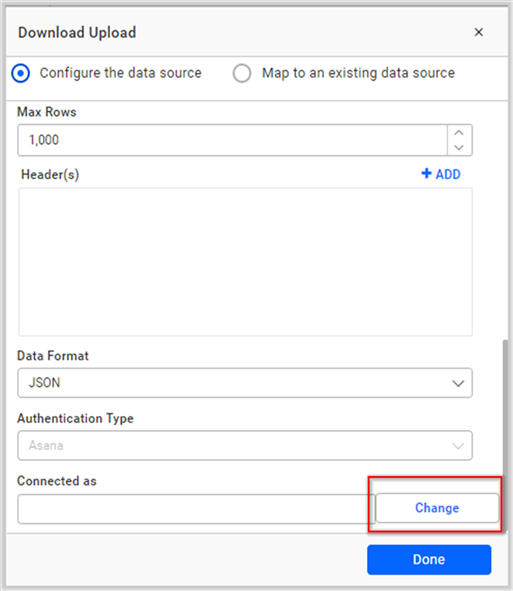
Configure web data source with OAuth2 authentication
To configure the data source for the OAuth type, you must first complete the OAuth authentication process on the site.
To re-configure the data source, click the Change button.
An authentication window will pop up. Select your account or click Connect New Account in the window that appears.
Click the Connect button and add a new data connection.
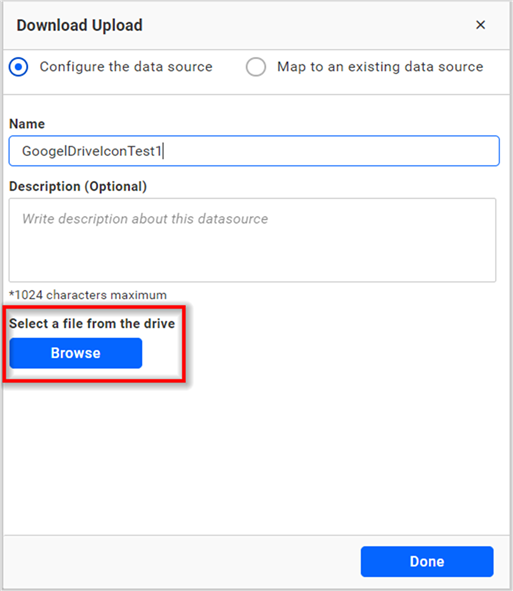
Configure the drive data source
To configure the data source for the OAuth drive type, you must first complete the OAuth authentication process on the site.
To modify the data source configuration, please follow the steps provided below.
Click the Browse button to add a new data connection.
After clicking the Browse button, the drive file browser dialog will appear as shown below.
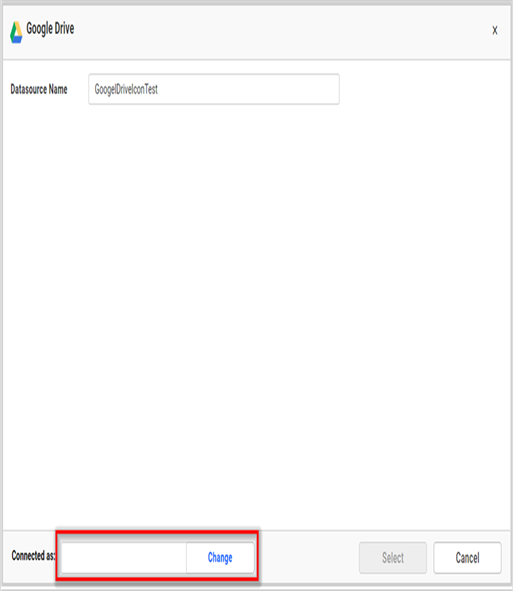
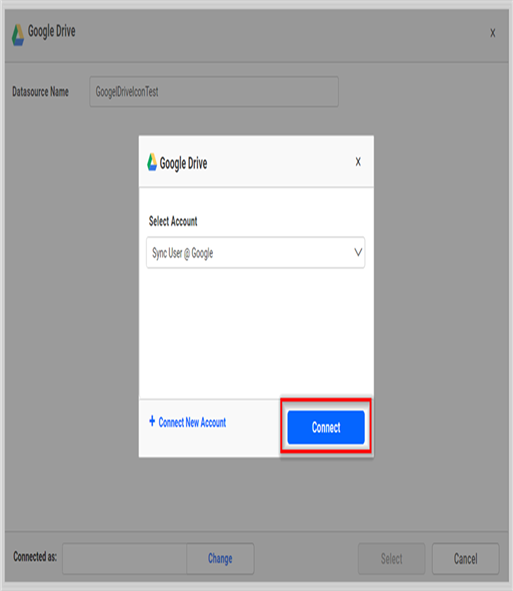
Click the Change button. A new window will appear. Then, select your account or click Connect New Account in the window.
Click the Connect button to configure the new user to evaluate all files and create the data source.
Now, the drive window will be populated with the available files. Choose the file as shown in the following image.
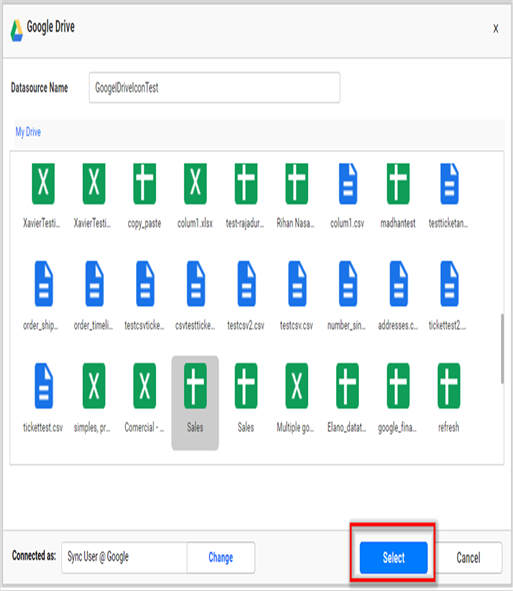
Click on the Select button to create the data source with the new connection details.
Auto-map data source
Auto mapping of data sources can save you a lot of time and effort by eliminating the need to set up the same data source which is used across different dashboards.
How to use auto mapping in BoldBI:
-
Upload a set of dashboards that have a common data source used across them.
-
Now configure the data source in any one of the dashboards. Once the configuration is completed, an alert popup will show the list of dashboards where the same data source has been used.
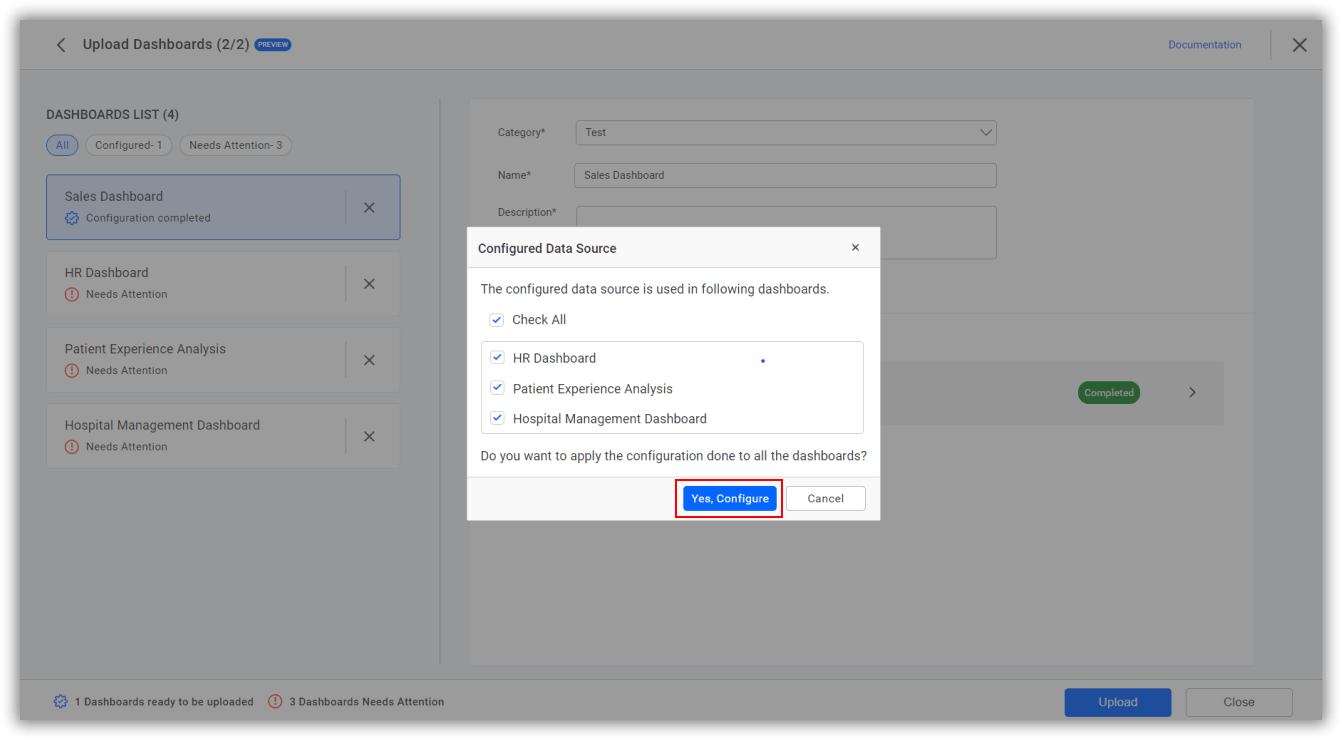
-
Once the required dashboards have been selected, click on the
Yes Configurebutton to change the configuration state of the same data source across the selected dashboards toCompleted.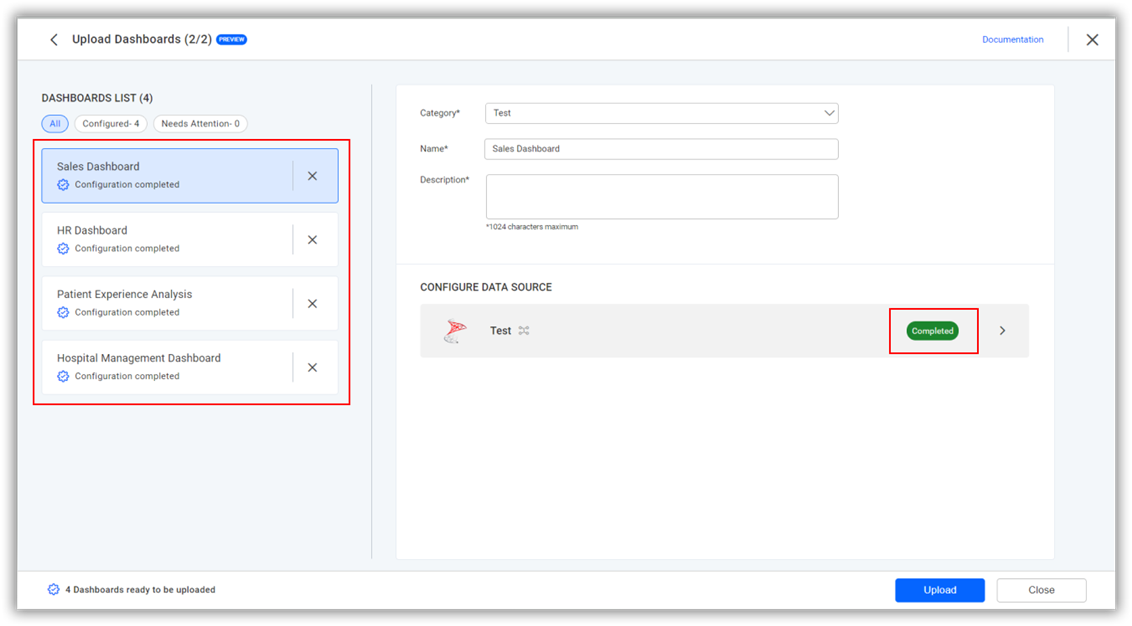
NOTE: In order for this functionality to work, please ensure that the dashboards are downloaded again and that the BoldBI version is greater than 6.7.
Bulk category update
This feature enables you to update categories for selected dashboards seamlessly and perform bulk deletion.
How to use bulk category update in BoldBI:
-
Select the uploaded dashboards as follows:
To select uploaded dashboards, you have two options:
-
You can choose all the dashboards by clicking the
Select Allcheckbox.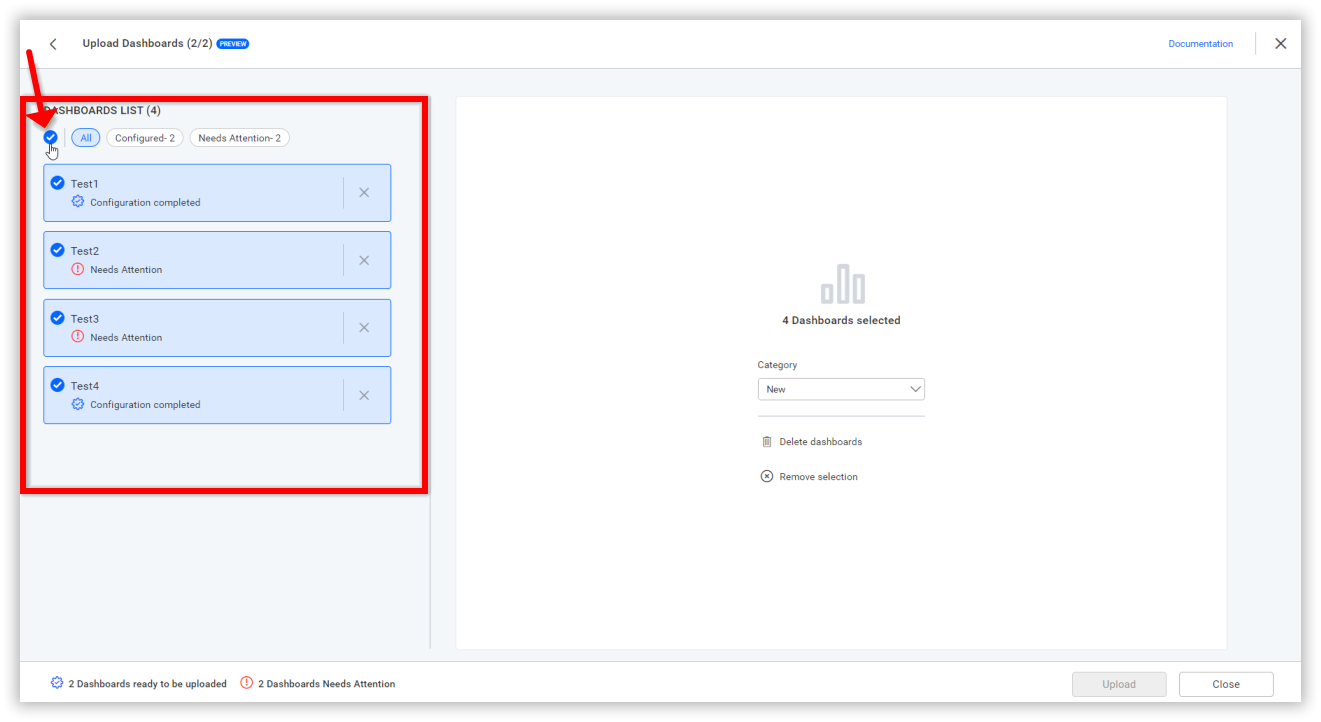
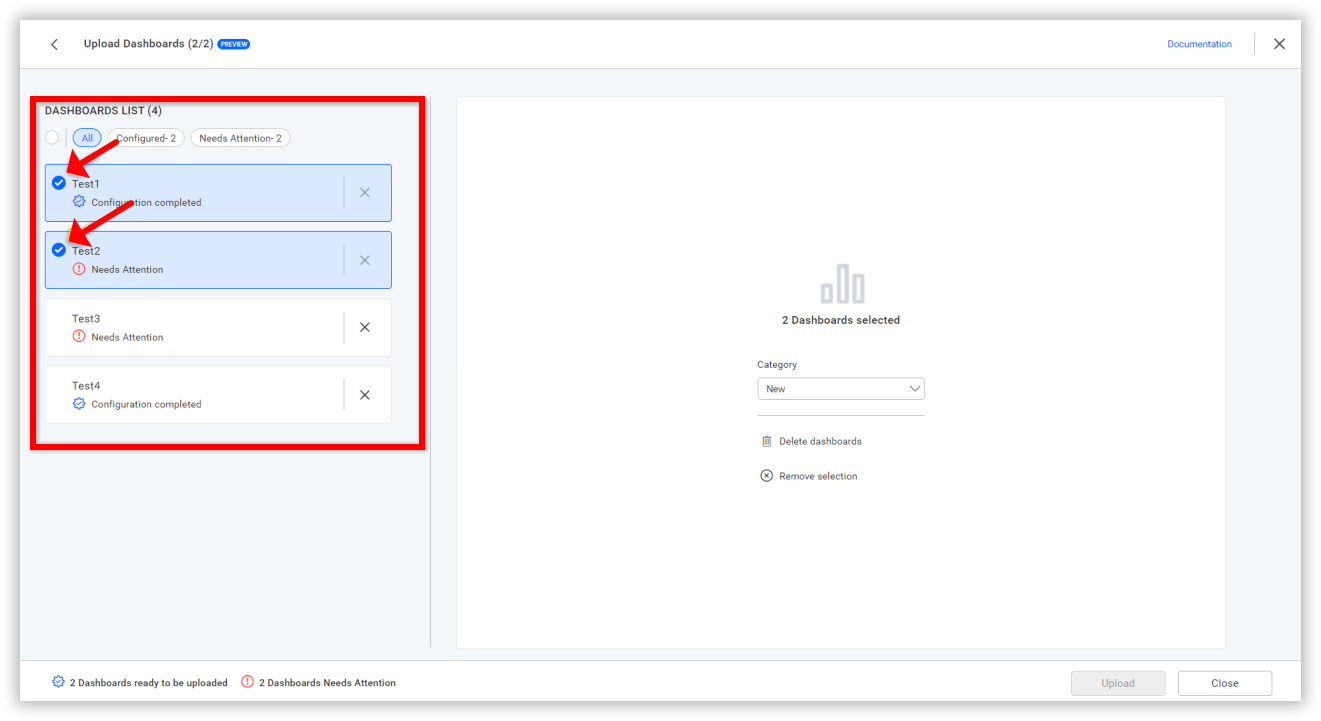
-
Alternatively, you can individually select one or multiple dashboards using the checkboxes within each dashboard list tile.
-
-
You can change the categories of the selected dashboards.
Uploaded dashboards may have either common or different categories:
-
If they have the same category, the bulk category UI dropdown will be updated automatically.
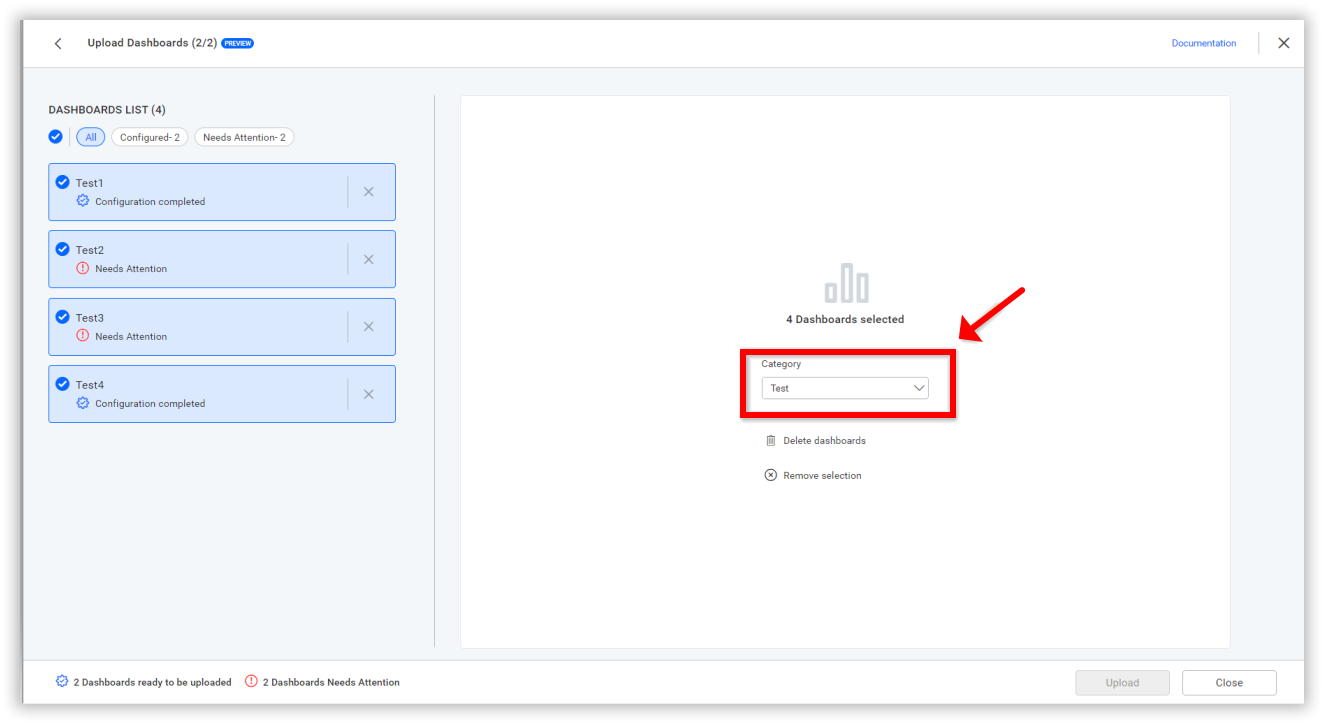
-
If they have different categories, the bulk category UI dropdown will display the count of distinct categories.
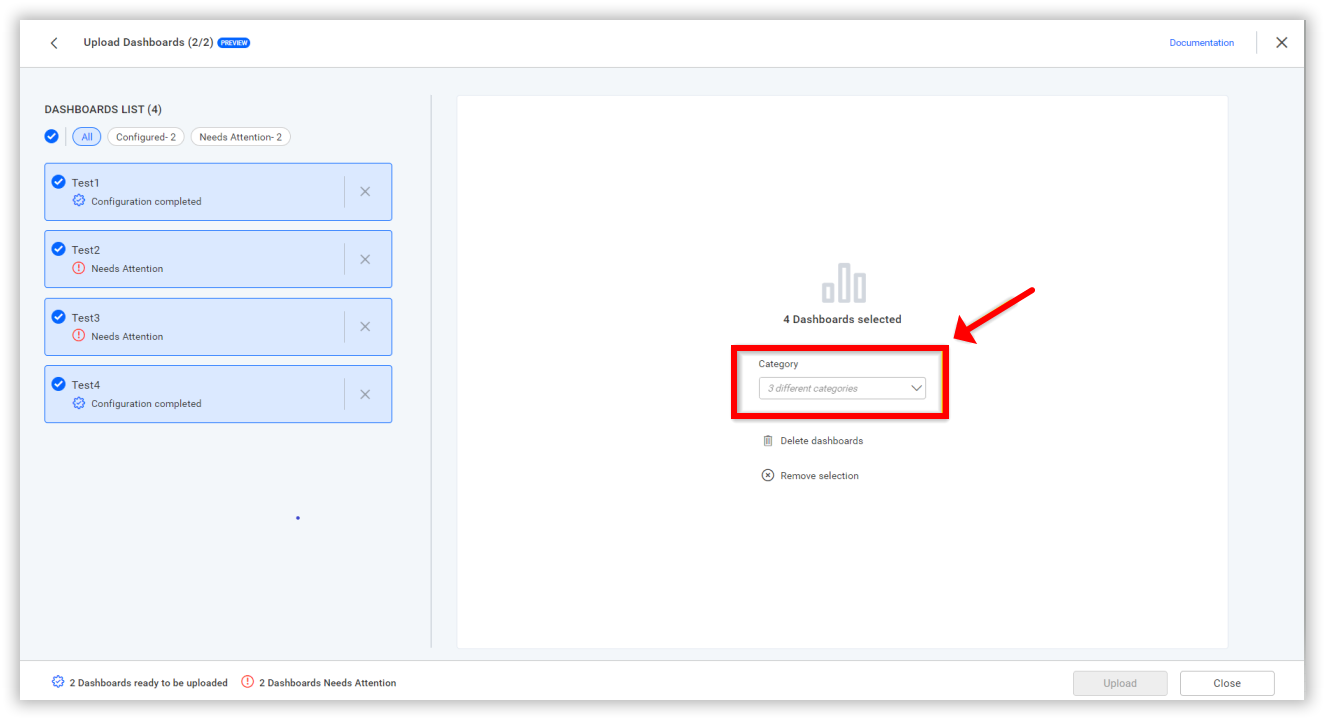
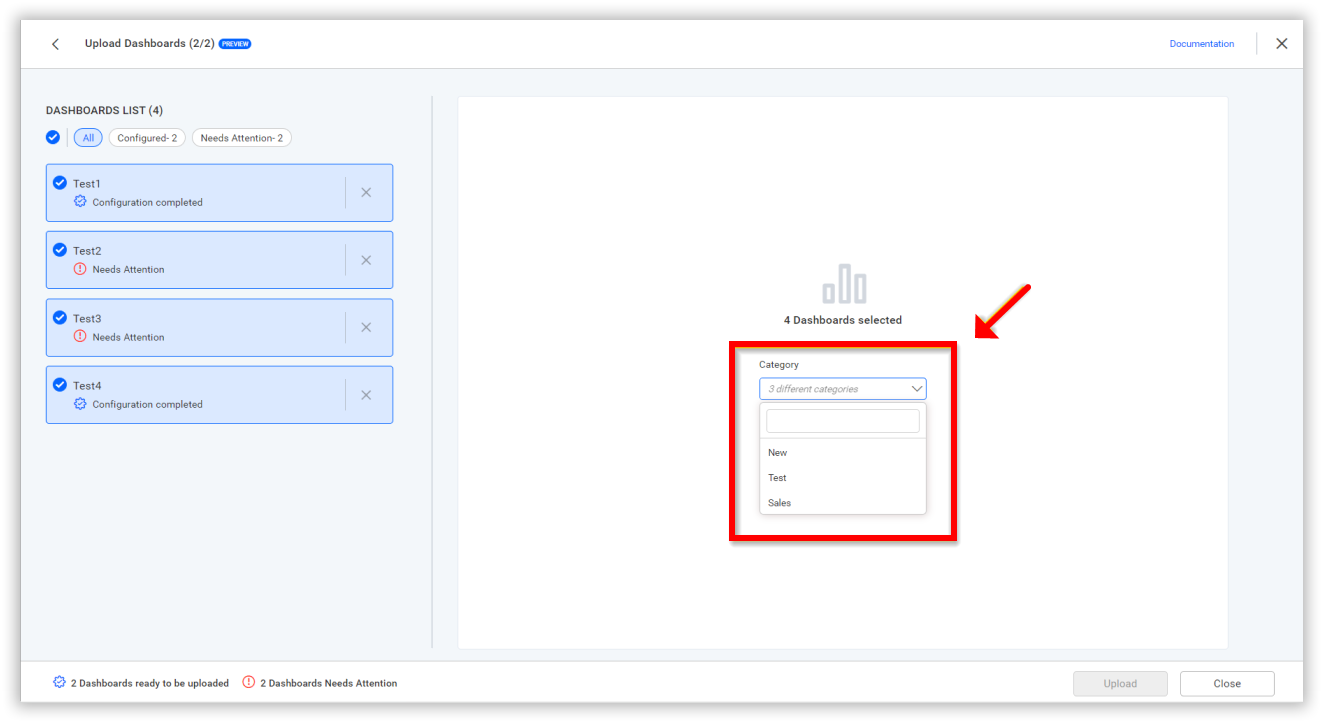
Next, you can choose the desired category from the provided category dropdown in the bulk category UI.
-
-
Performing bulk deletion of dashboards as follows:
There is a
Delete dashboardsoption to delete the selected dashboards all at once.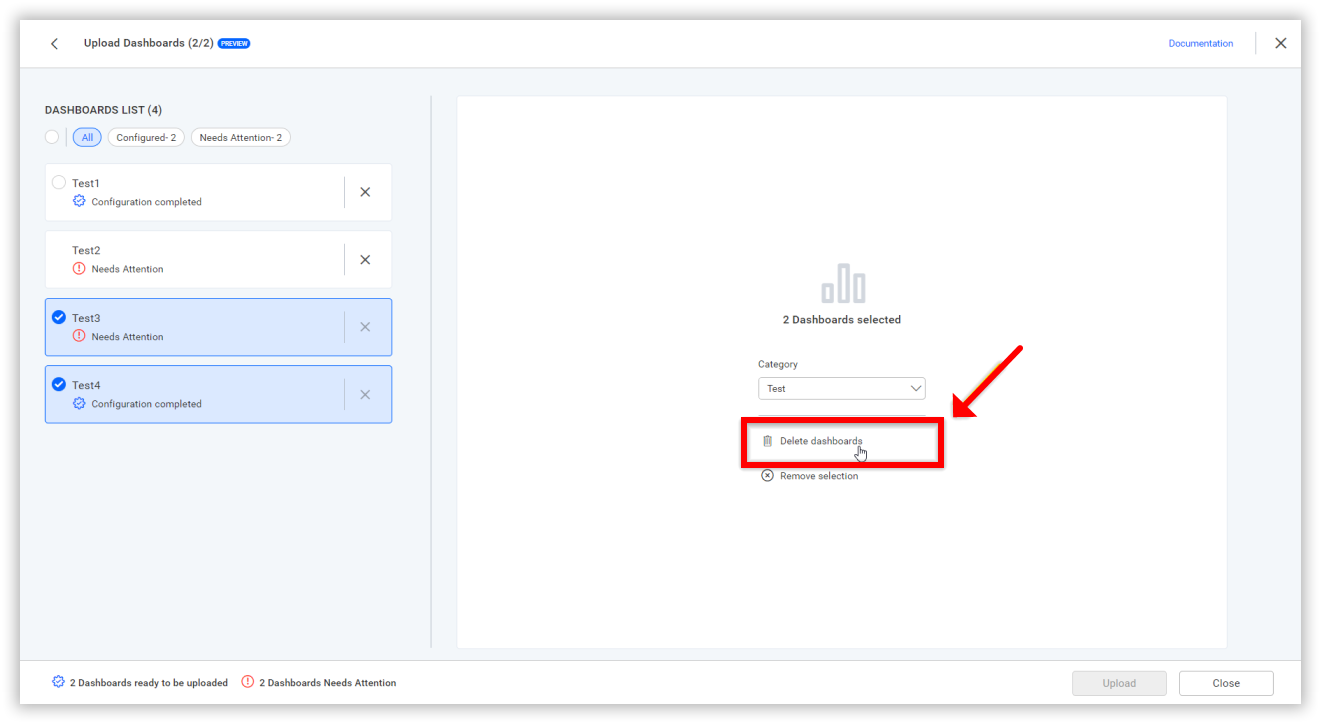
After clicking the
Delete dashboardsoption, an interaction dialog will open. Click theYes, Deletebutton.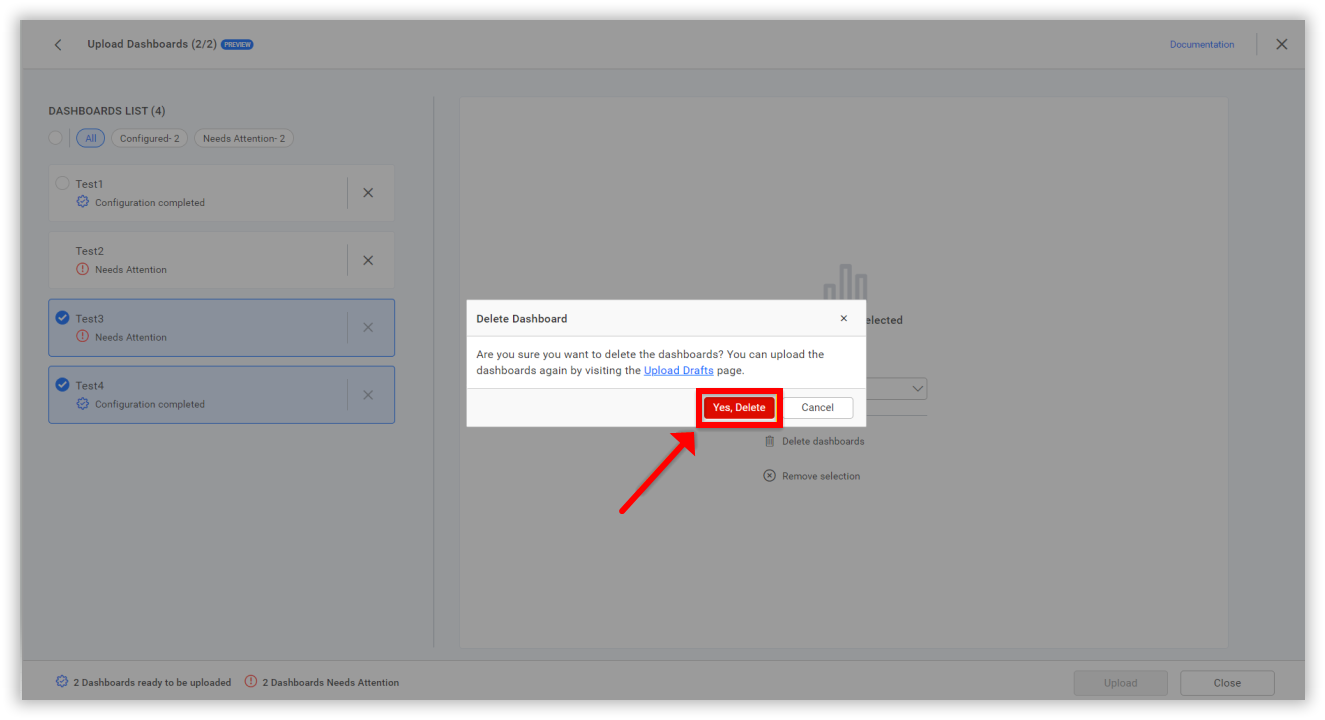
Now you can see the selected dashboards have been deleted.
-
Performing remove selection of dashboards as follows:
To remove the selection, you have the dedicated
Remove selectionoption, or you may manually deselect the dashboards. Alternatively, you can select all and then deselect all by clicking theSelect Allcheckbox again.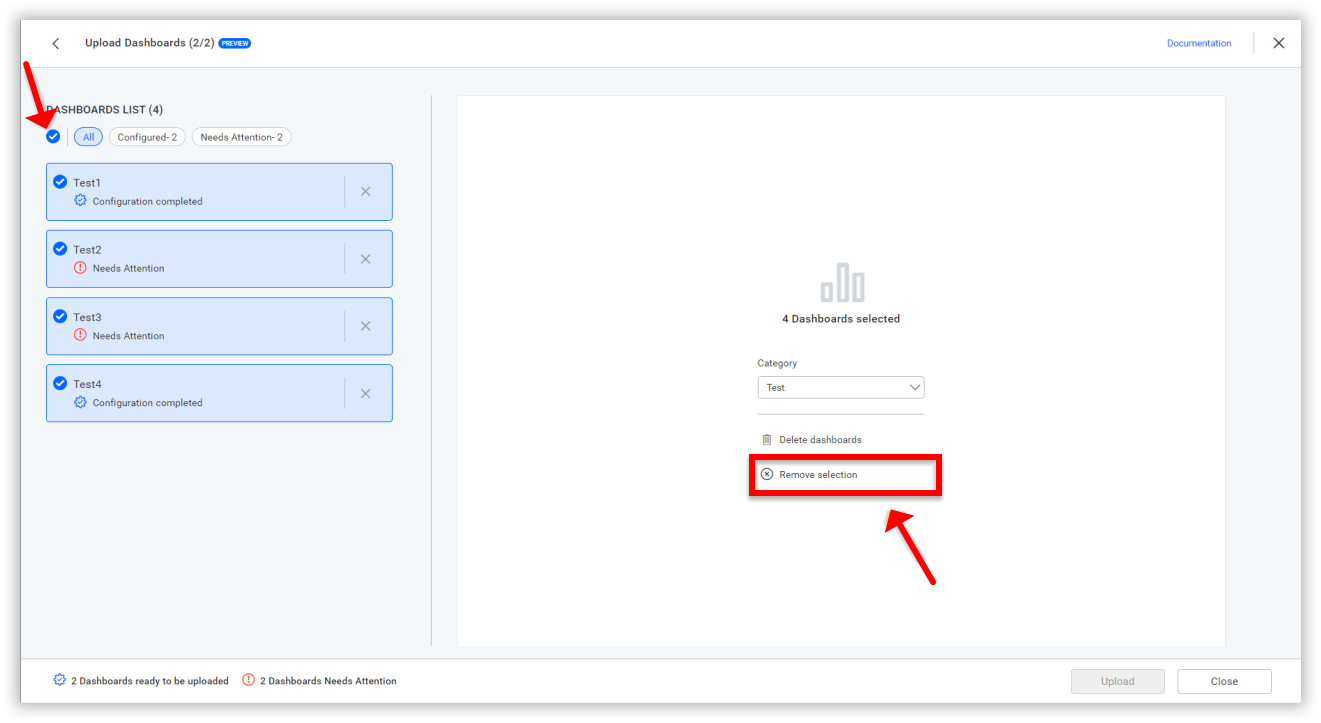
NOTE: This functionality will only work on BoldBI version 6.13 or higher.
Schema mismatch override on data source
While uploading a dashboard with a data source that has columns missing in the new connection, the upload process will fail with a schema error. You can now override the error and continue with the data source and dashboard upload.
There will be multiple errors thrown while uploading, as explained below.
-
Only schema mismatch error:
Here, the data sources will have only schema mismatch errors.
-
Click the
know moreoption.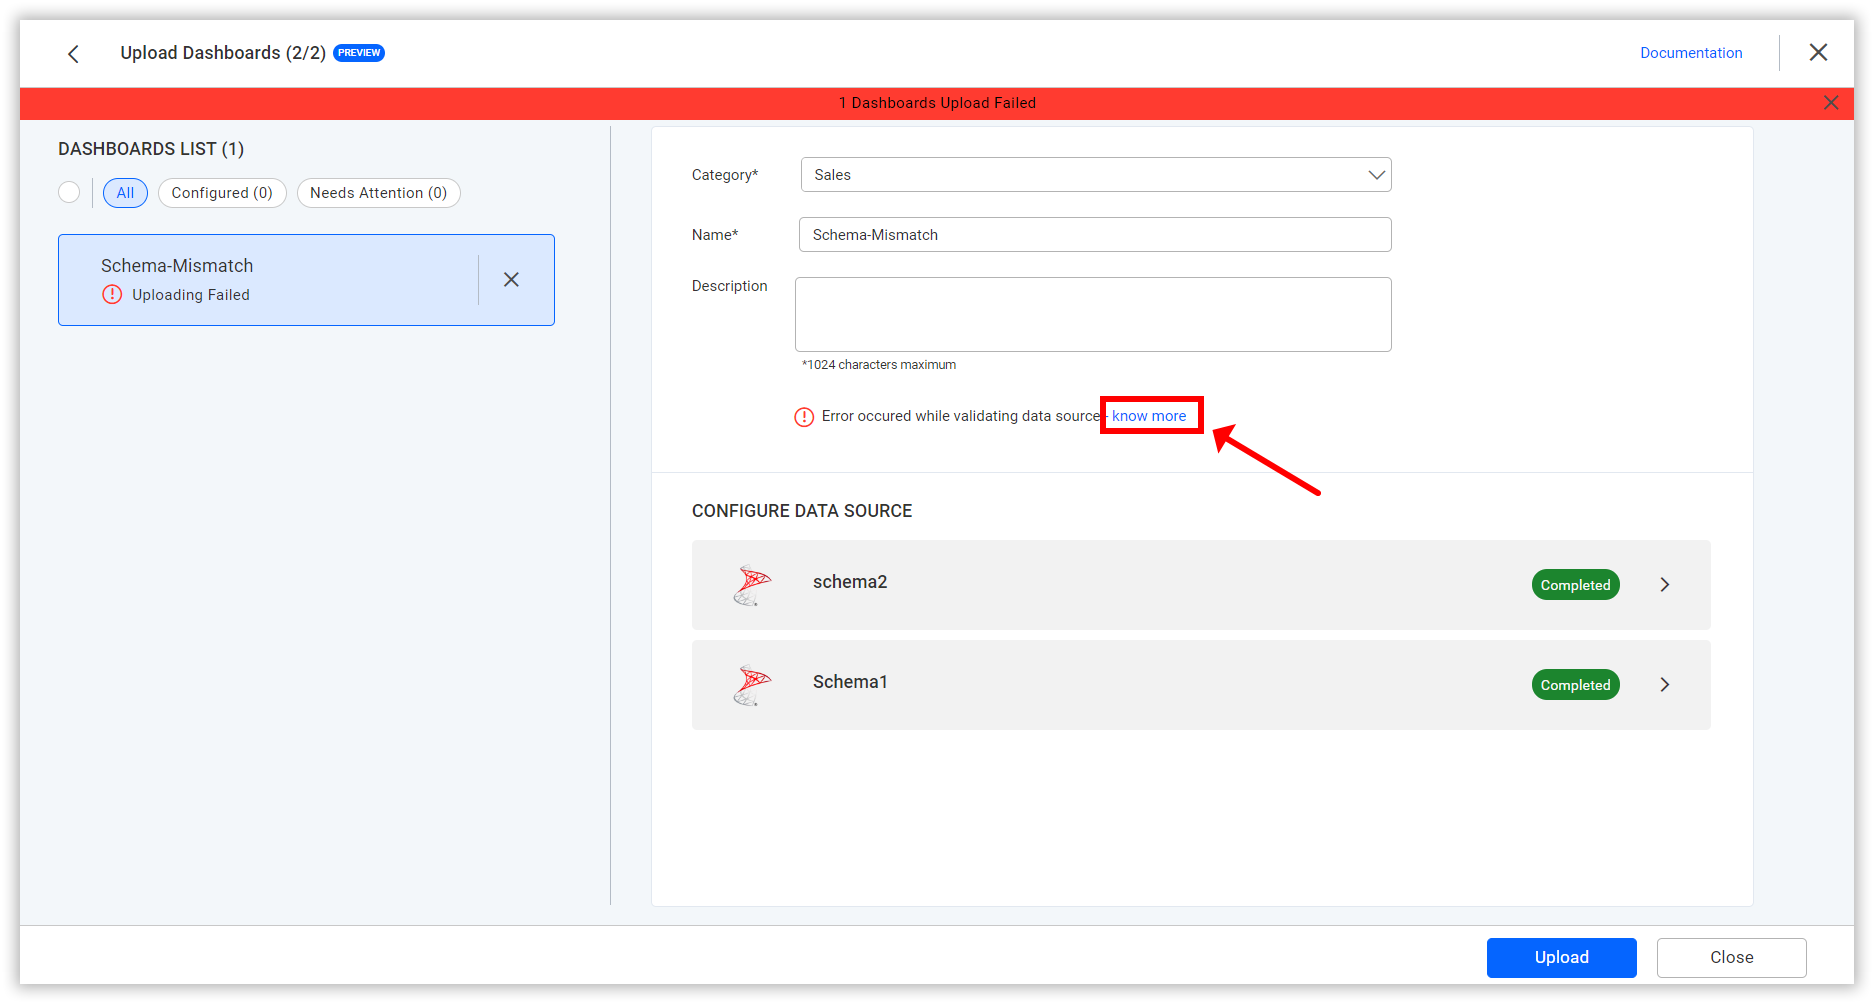
-
After clicking the
Know moreoption, anErrordialog will open, where you will notice only schema mismatch errors in the data sources.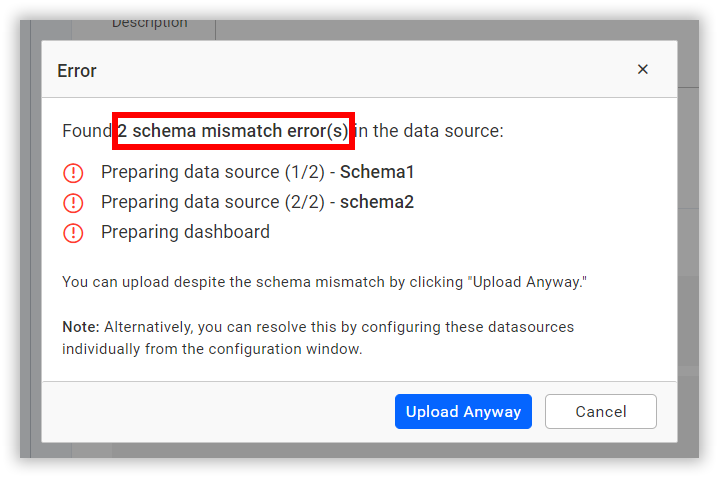
-
You can override the schema-mismatched data sources by clicking the
Upload Anywaybutton, which completes the process of uploading the dashboard without validating the data sources.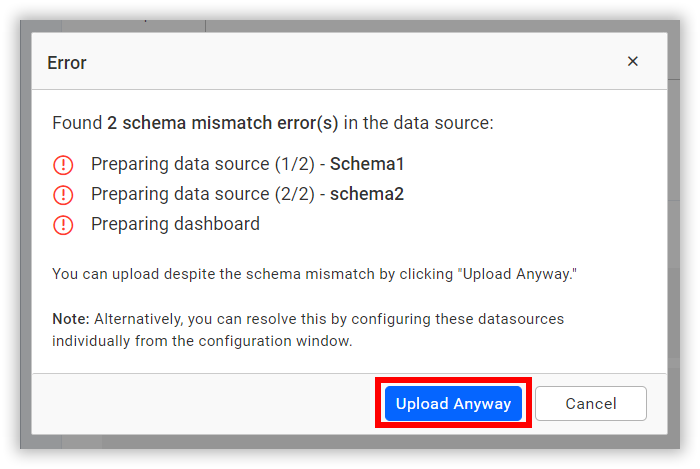
-
-
Combination of errors:
Here, the data sources will have schema mismatch errors along with other errors.
-
Click the
know moreoption.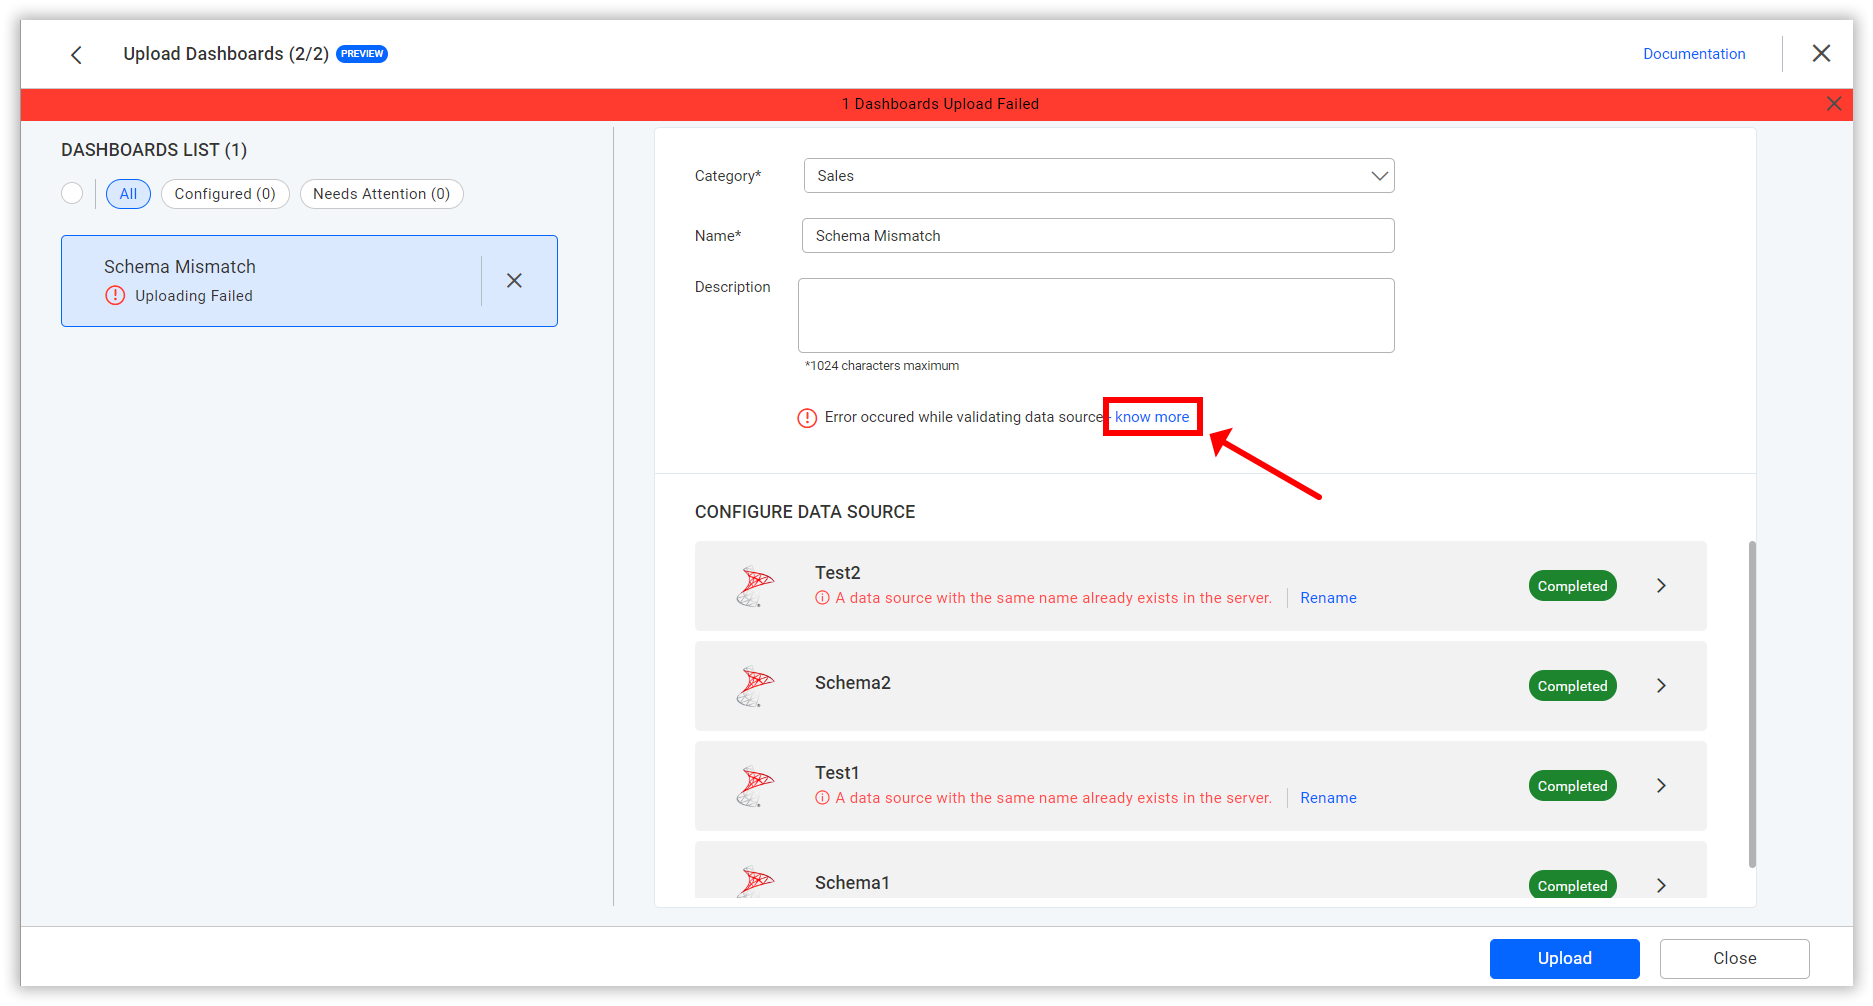
-
After clicking the
Know moreoption, anErrordialog will open, where you will notice schema mismatch errors along with other errors.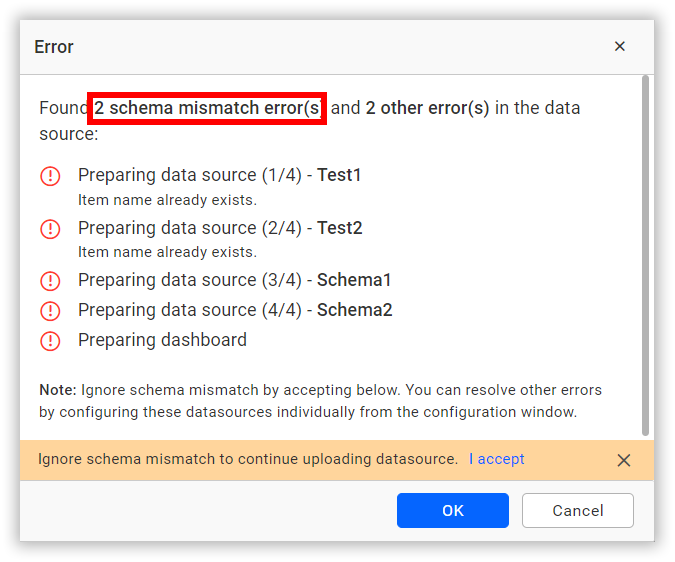
-
By clicking
I accept, the schema mismatched data sources will be published, while the remaining errors can be manually cleared.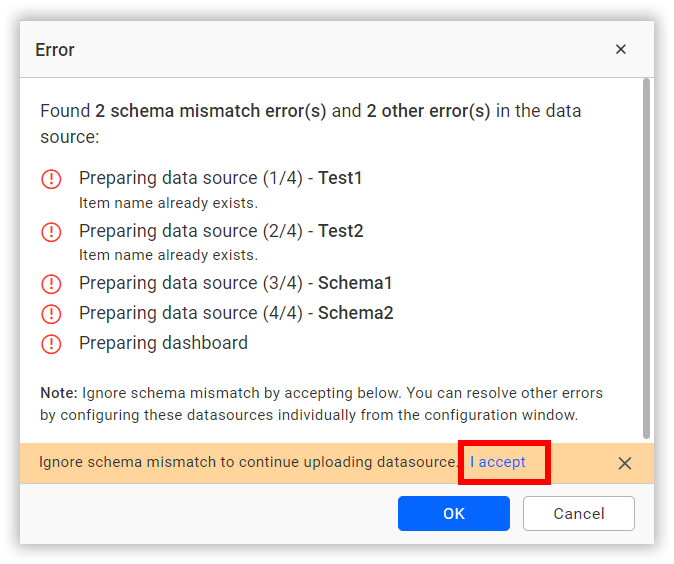
-
After clearing the remaining errors on the data sources, proceed to click the
Uploadbutton to successfully upload the dashboard.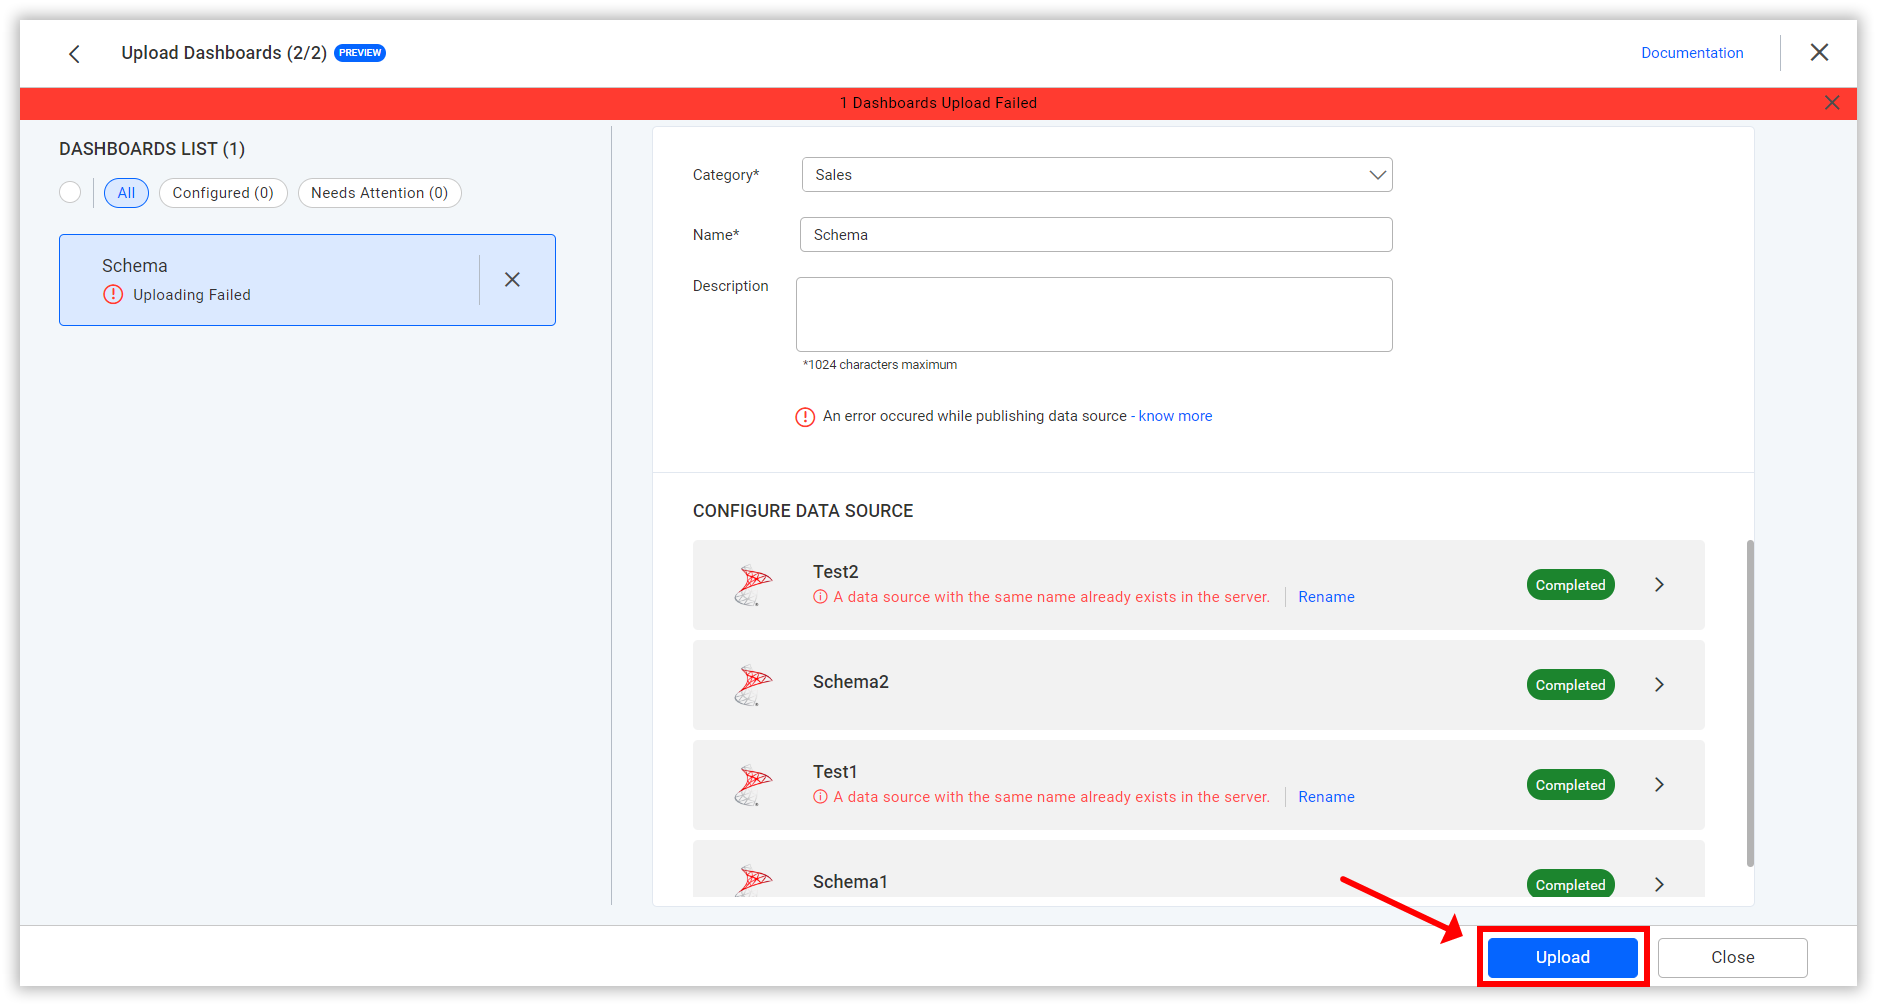
-
NOTE: This functionality will only work on BoldBI version 6.19 or higher.