Adding C3 chart as a custom widget
Here we are creating a C3 Chart using the D3 Library.
NOTE: The C3 Chart is open-source and is licensed under MIT. This feature is available in On-Premises Deployment but not in Syncfusion Managed Cloud Server.
Follow these steps to add the third-party widget (C3 Chart) as a custom widget for the dashboard:
-
Refer to this link to create new custom widget files.

-
Configure the widget using the
widgetconfig.jsonfile. -
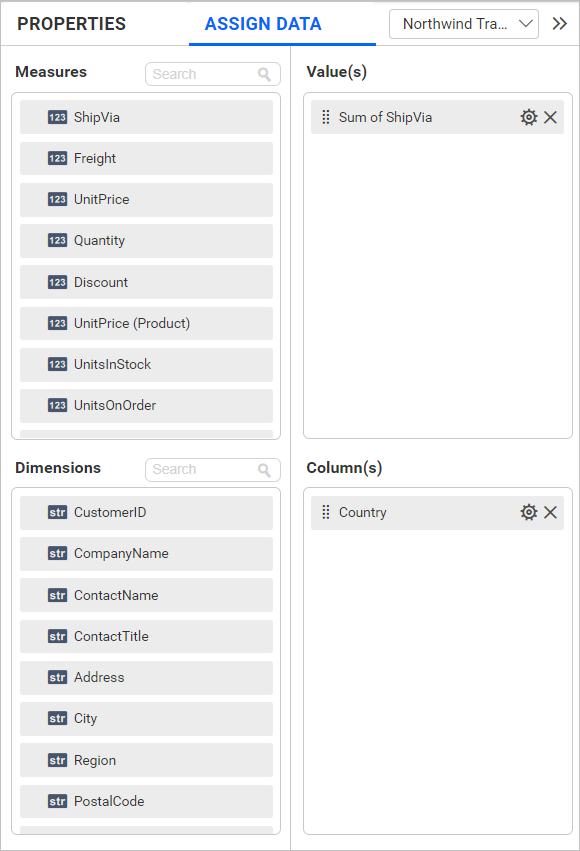
As a C3 Chart requires two data fields, we have configured column and values as shown below. The properties section contains the properties related to the C3 Chart. Refer to this link for configuring the
widgetconfig.json."widgetName": "C3Chart", "displayName": "C3 Chart", "guid": "b0d5348d-f625-4b78-8db9-c5ed9d38eb45", "category": "Comparison", "description": "Compare values for a set of unordered items across categories", "srcFile": "src/sourcefile.js", "dependencies": { "scripts": [ "src/d3.js", "src/c3.js" ] }, "dataFields": [ { "displayName": "Value", "valueType": "measure", "name": "Value", "min": 1, "max": 1, "optional": false }, { "displayName": "Column", "valueType": "dimension", "name": "Column", "min": 1, "max": 1, "optional": false } ], "functionalities": [ { "header": "Basic Settings", "properties": [ { "displayName": "Show Tooltip", "controlType": "bool", "name": "showTooltip", "defaultValue": "true" }, { "displayName": "Show Label", "controlType": "bool", "name": "showLabel", "defaultValue": "true" }, { "displayName": "Color", "controlType": "color", "name": "barColor", "defaultValue": "#2196F3" } ] }, ], "filterSettings": { "masterFilter": { "visible": true, "defaultValue": true }, "ignoreMasterFilter": { "visible": true, "defaultValue": false } } -
The d3.js dependency file can be downloaded from the D3 website.
-
The c3.js dependency file can be downloaded from the C3 website.
-
Import the custom widget into the designer.
-
Then, configure the widget with the necessary data.

-
You can debug the custom widget by dragging and dropping it into the design canvas after placing the ‘debugger’ in
src/sourcefile.js. -
this.element is the container (div) provided to render our actual widget.
-
So, we create our C3 Chart in this.element by using the data in this.model.dataSource.
-
In Init(), we create a new space (div) for rendering our C3 Chart custom widget and append it into the container as you can see in the following code.
-
The width and height of the widget are assigned from the container’s width and height respectively.
init: function () { /* init method will be called when the widget is initialized */ this.widget = document.createElement("div"); this.widget.setAttribute('id', 'chart'); var width = document.getElementById('container').style.width; var height = document.getElementById('container').style.height; this.element.appendChild(this.widget); var that = this; -
Configure the datasource with default values for the initial rendering of the C3 Chart.
var columns =[]; columns =[{column:'Item1',values: '50'},{column:'Item2',values: '20'},{column:'Item3',values: '30'}]; -
The
this.model.boundColumns.Valueandthis.model.boundColumns.lengthcontain the columns bound in the columns and values respectively. By checking the following condition, we can determine whether the widget is configured with columns or not. -
Converting the datasource structure required by the C3 Chart.
if (this.model.boundColumns.Value.length > zero) { for (var i = 0; i < this.model.dataSource.length; i++) { columns.push({column: this.model.dataSource[i][this.model.boundColumns.Column[0].uniqueColumnName], values: this.model.dataSource[i][this.model.boundColumns.Value[0].uniqueColumnName]}); } } -
To render the C3 Chart, configure the necessary APIs and assign the data to it.
var chart = c3.generate({ data: { type: 'bar', json: columns, keys: { x: 'column', value: ['values'] }, labels: true, selection: { enabled: true, multiple: false, draggable: true }, onclick: function(d) { that.selectionChange(d) }, }, axis: { x: { type: 'category' } }, grid: { x: {show: false}, y: {show: true} }, bar: { width: { ratio: 0.5 } }, interaction: {enabled: true} }); this.widget = chart; -
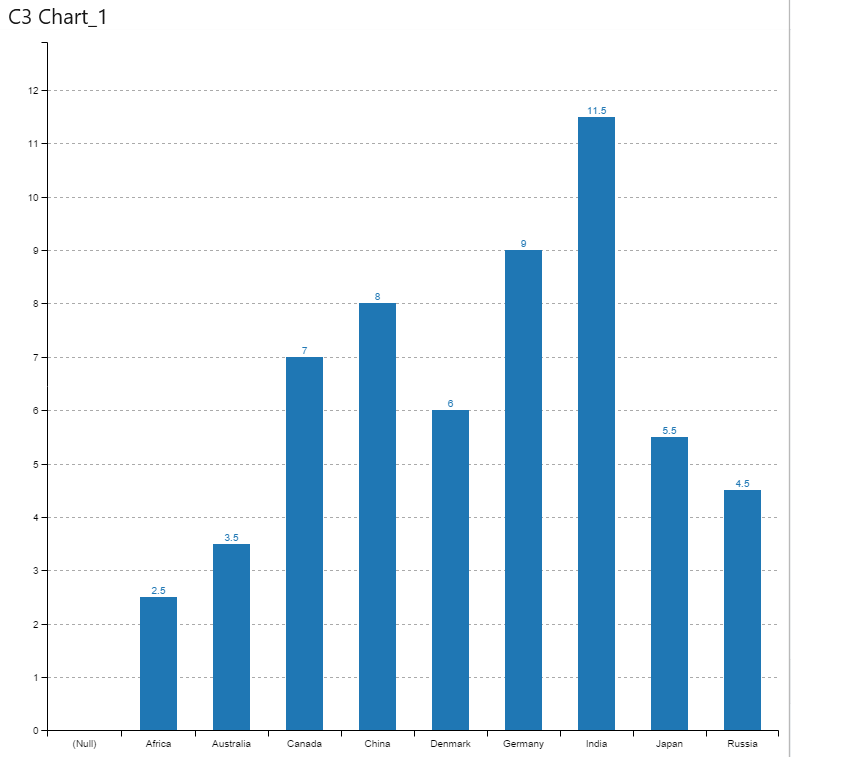
The C3 Chart widget will be displayed as follows:

-
The update method will be triggered for the following operations. We must make the necessary changes by checking the update types (resize, refresh, and propertyChange). The widget will be updated accordingly by invoking the respective API of the widget.
-
Resize
-
Refresh
-
property change
update: function (option) { var widget = this.widget; /* update method will be called when any update needs to be performed in the widget. */ if (option.type == "resize") { /* update type will be 'resize' if the widget is being resized. */ widget.resize(option.size); } else if (option.type == "refresh") { /* update type will be 'refresh' when the data is refreshed. */ this.refreshChart(); } else if (option.type == "propertyChange") { /* update type will be 'propertyChange' when any property value is changed in the designer. */ switch (option.property.name) { case "showTooltip": widget.internal.config.tooltip_show = option.property.value; break; case "showLabel": widget.internal.config.data_labels = option.property.value; widget.flush(); break; case "barColor": widget.internal.config.data_colors.values = option.property.value; widget.flush(); break; } } } -
-
To refresh the C3 Chart, data must be assigned to the C3 Chart APIs.
   refreshChart : function (e) {
  	     var columns =[];
  	    if (this.model.boundColumns.Value.length > 0)
  	   {
  		for( var i=0; i< this.model.dataSource.length; i++)
  		 {
  		  columns.push({column:this.model.dataSource[i][this.model.boundColumns.Column[0].uniqueColumnName],values:this.model.dataSource[i][this.model.boundColumns.Value[0].uniqueColumnName]});
  		 }
          } else {
  			columns =[{column:'A',values: '50'},{column:'B',values: '20'},{column:'C',values: '30'}];
  		   }
          var chart = c3.generate({
                  data: {
                       type : 'bar',
                       json: columns,
                       keys: {
  					      x: 'column',
  					      value: ['values']
  					       },
  					 labels:this.model.properties.show label,
  	                 selection:
  					 {
                       enabled: true,
  					 multiple: false,
  					 draggable:true
  					 },
  					 onclick: function(d) {
  							that.selectionChange(d)
  						},
  					 },
  		        axis:
  					 {
  					    x: {
                          type: 'category'
  					       }
  					 },
  			    grid:
  					 {
  						 x:{ show : true},
  						 y:{show: false}
  					 },
  				bar:
  					 {
  					  width: { ratio: 0.5 }
  					 },
                  interaction: {enabled: true}
  				});
              this.widget = chart;
  	 },
Publish the C3 custom widget
Follow the steps outlined in the link to publish the C3 custom widget.