Create, Configure and Format the Custom Widget
The Bold BI custom widget allows you to add any user-defined widget, d3 controls, Syncfusion controls, or any Javascript-based controls in a dashboard, and it performs like a normal widget.
NOTE: This feature is available in On-Premises Deployment, but not in Syncfusion Managed Cloud Server.
Prerequisites and knowledge required for development of the custom widget
This section explains the mandatory requirements for developing the custom widget.
| Development Environment | Bold BI Enterprise Edition and any web browser as mentioned in the link |
| Knowledge Required | Basic knowledge about the HTML and JavaScript |
Creating a new widget
To Create a new custom widget, follow the steps below:
Create a custom widget template
The BoldBI Custom Widget Utility (bicw.exe) is used to create the custom widget template. To create a new custom widget template, download the Custom Widget Utility and extract the zipped folder.
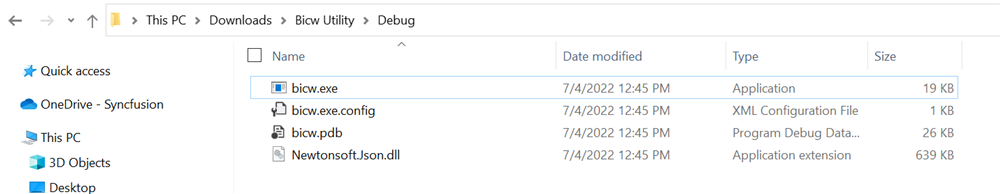
Please click on the bicw.exe file as shown in the snippet below:
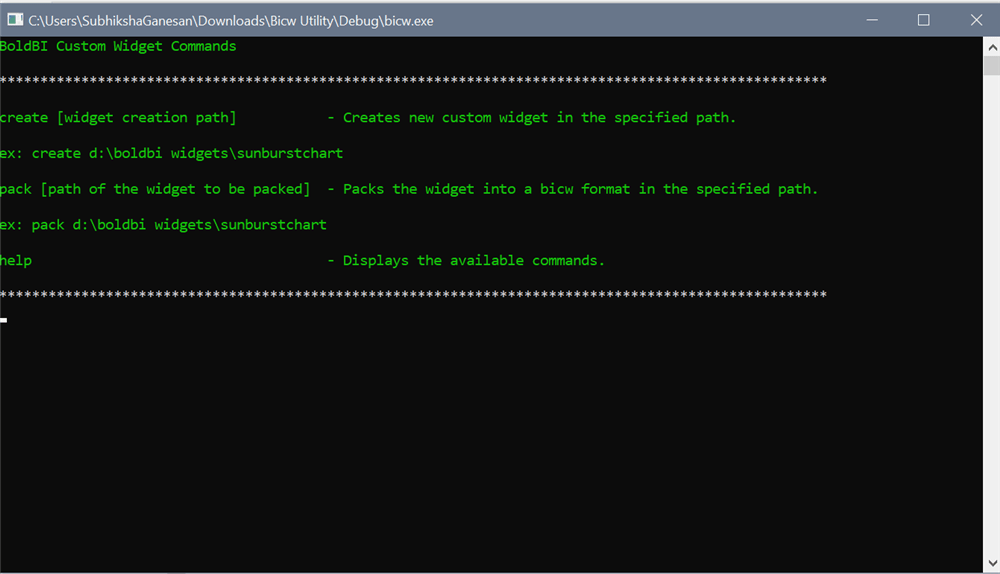
Using the create command, you can create the widget template in the specified path with the provided name.
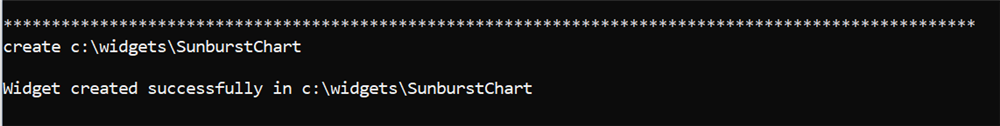
Format
create c:\widgets\SunburstChart
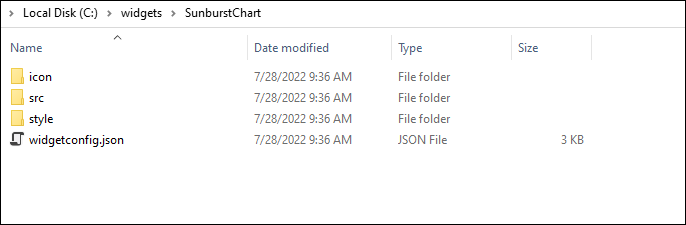
After executing the create command, you will see the widget named folder that is created as shown below:
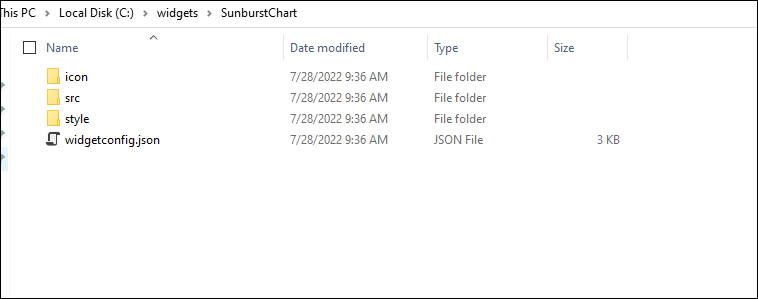
Configuring widget configuration file
You can configure the widget by using the manifest file.
The manifest file is used to specify the widget’s configuration. This file will be available in the custom widgets root directory with the name widgetconfig.json.
The custom widget can be configured using the following settings. Please refer to the structure of widgetconfig.json:
 {
  "widgetName" : "Name of the widget.",

  "displayName" : "Display name of the widget to be displayed in the designer toolbox.",

  "guid": "Unique GUID for the widget.",

  "category" : "Category in which the widget should be displayed in the designer.",

  "description" : "Description of the widget.",

  "srcFile"  : "Path of the source file through which the widget can be embedded to dashboard",

  "dependencies" : "Specify the dependency scripts and CSS files to be referred to for the widget",

  "dataFields" : " Specifies the widget fields required for binding data from a datasource. Each field can be bound to a single or multiple measure/dimension fields in a data source. When dataFields is not specified, this widget acts as a non-data bound widget.",

  "filterSettings": "Filter settings are used to configure whether the widget can take part in filter interactions between the widgets."
 }
NOTE: In the above code, the GUID must be unique. Therefore, it should be updated whenever a new custom widget template is downloaded. For example, guid: “74926583-8493-3333-6382-863428678492”.
|
API |
Description |
Example |
Rules |
| widgetName | The name for the widget can be set and specified through the widgetName API. | "widgetName": "sunburst" |
|
| displayName | The display name for the widget Can be set and specified through the widgetName API. The display name will appear in the Bold BI designer toolbar. | "displayName": "Sunburst Chart" |
|
| category | Name of the category in which the custom widget should be displayed in the Bold BI designer toolbar. | "category": "Relationship" | Not Applicable |
| description | Provides the description of the custom widget. The provided message will be shown while hovering on the widget icon in the Bold BI designer toolbar. | "description": "The Sunburst Chart is used to visualize the hierarchical data. The center circle represents the root level of the hierarchy and outer circles represent higher levels of the hierarchy" | Not Applicable |
| srcFile | The Source file location should be specified here. Refer to the use of the source file in its module. | "srcFile": `src/sunburst.js` |
|
| dependencies | The dependency script and CSS files, which have to be referred to for the widget, should be specified in the dependencies section. | "dependencies": { "scripts": [ "src/ej.sunburstchart.js", "src/ej.helper.js" ], "styles": [ "style/ej.sunburstchart.css" ] } |
|
| dataFields |
The dataFields API is used to specify the data fields with their type for custom widgets. There are three types of data fields available. They are listed as follows:
Measure data field In the measure data field, a numeric value column can be configured. Dimension data field In the dimension data field string, boolean and date value column can be configured. Dimensionormeasure data field In the dimensionormeasure data field, we can configure both the measure and dimension value column. In this data field, the default summary type for the measure value column is none. |
dataFields:[ { "displayName" : "Value", "valueType" : "measure", "name" : "Value", "min" : 1, "max" : 1, "optional" :false }, { "displayName" : "Levels", "valueType" : "dimension", "name" : "Levels", "min" : 1, "max":4, "optional" : false }] |
|
Limitation
The jQuery reference (jquery-1.10.2.min.js) will be included as a built-in reference for the custom widget, so you will not be able to specify the jQuery files in dependencies.
Example
Below is an example code to configure the widgetconfig.json file for the Syncfusion SunburstChart Chart.
{
  "widgetName": "SunburstChart",
  "displayName": "Sunburst Chart",
  "guid": "b0d5348d-f625-4b78-8db9-c5ed9d38eb45",
  "category": "Miscellaneous",
  "version": "4.2.0.0",
  "srcFile": "src/sourcefile.js",
  "dependencies": { "scripts": [ "src/ej.widget.all.min.js" ] },
  "description": "Sunburst Chart is useful for visualizing hierarchical data. The center circle represents the root level in the hierarchy, with outer circles representing higher levels of the hierarchy.",
  "dataFields": [
      {
  		"displayName": "Value",
  		"valueType": "measure",
  		"name": "Value",
  		"min": 1,
  		"max": 1,
  		"optional": false
  	},
      {
  		"displayName": "Levels",
  		"valueType": "dimension",
  		"name": "Levels",
  		"min": 1,
  		"max": 4,
  		"optional": false
  	},
  	{
  		"displayName": "Tooltip(s)",
  		"valueType": "measure",
  		"name": "tooltip",
  		"min": 1,
  		"max": 5,
  		"optional": true
  	},
  	{
  		"displayName": "Filter(s)",
  		"valueType": "dimension",
  		"name": "filter",
  		"min": 1,
  		"max": 5,
  		"optional": true
  	}
  ],
  "functionalities": [
  	{
  	"header": "Basic Settings",
  	"properties": [
  	{
        "displayName": "Enable Animation",
        "controlType": "bool",
        "name": "animation",
        "defaultValue": "false"
      },
  	{
        "displayName": "Show Data Label",
        "controlType": "bool",
        "name": "showDataLabel",
        "defaultValue": "true"
      },
  	{
        "displayName": "Data Label Rotation",
        "controlType": "enumeration",
        "name": "dlRotation",
        "defaultValue": "Normal",
  	  "listItems": [
          "Normal",
          "Angle"
        ]
      },
  	{
        "displayName": "Label Overflow Mode",
        "controlType": "enumeration",
        "name": "labelOverflowMode",
        "defaultValue": "Trim",
  	  "listItems": [
          "Hide",
          "Trim"
        ]
      }
    ]
  },
  	{
  	"header": "Legend Settings",
  	"properties": [
  	{
        "displayName": "Show Legend",
        "controlType": "bool",
        "name": "showLegend",
        "defaultValue": "false"
      },
  	{
        "displayName": "Legend Position",
        "controlType": "enumeration",
        "name": "legendPosition",
        "defaultValue": "Bottom",
  	  "listItems": [
          "Top",
          "Left",
  		"Right",
  		"Bottom"
        ]
      }
    ]
  },
  {
  	"header": "Color Settings",
  	"properties": [
  	{
        "displayName": "Point 1 color",
        "controlType": "color",
        "name": "p1Color",
        "defaultValue": "#8d9aa2"
      },
  	{
        "displayName": "Point 2 color",
        "controlType": "color",
        "name": "p2Color",
        "defaultValue": "#515e66"
      },
  	{
        "displayName": "Point 3 color",
        "controlType": "color",
        "name": "p3Color",
        "defaultValue": "#0ebcd7"
      },
  	{
        "displayName": "Point 4 color",
        "controlType": "color",
        "name": "p4Color",
        "defaultValue": "#6517c1"
      },
  	{
        "displayName": "Point 5 color",
        "controlType": "color",
        "name": "p5Color",
        "defaultValue": "#b061fa"
      },
  	{
        "displayName": "Point 6 color",
        "controlType": "color",
        "name": "p6Color",
        "defaultValue": "#826AF9"
      },
  	{
        "displayName": "Point 7 color",
        "controlType": "color",
        "name": "p7Color",
        "defaultValue": "#2D99FF"
      },
  	{
        "displayName": "Point 8 color",
        "controlType": "color",
        "name": "p8Color",
        "defaultValue": "#2CD9C5"
      },
  	{
        "displayName": "Point 9 color",
        "controlType": "color",
        "name": "p9Color",
        "defaultValue": "#FF6C40"
      },
  	{
        "displayName": "Point 10 color",
        "controlType": "color",
        "name": "p10Color",
        "defaultValue": "#FFE700"
      }
    ]
  }
  ],
  "filterSettings": { "masterFilter": { "visible": true, "defaultValue": false }, "ignoreMasterFilter": { "visible": true, "defaultValue": false } },
}
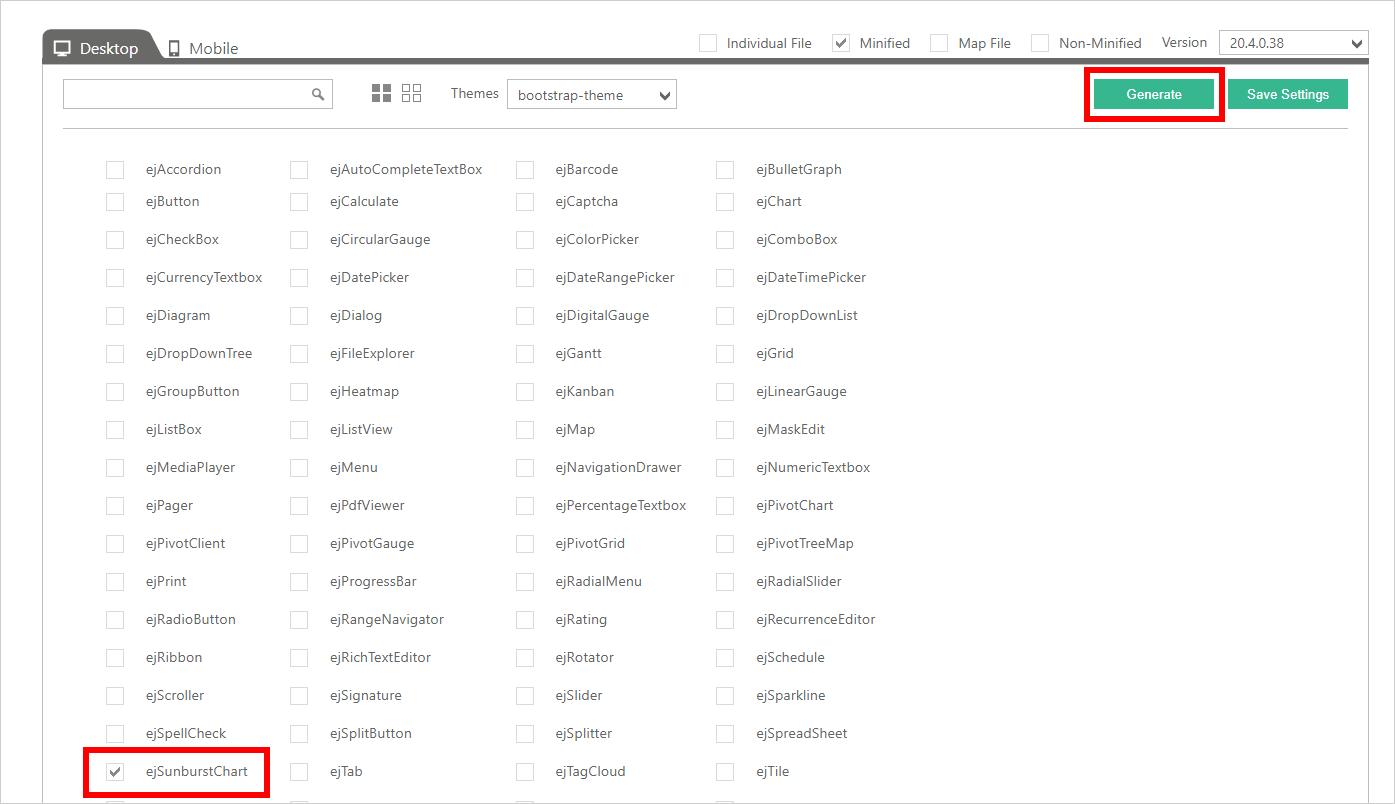
Adding Dependency Script Files
To add the required dependency script file, visit Essential JS 1 Custom Script Generator where you can find the custom widget’s min files. For example, you can select the ejSunBurstChart and download the script file as shown in the below image:
NOTE: Visit Syncfusion Custom Resource Generator where you can find the custom widget’s min files for Syncfusion EJ2 Components.
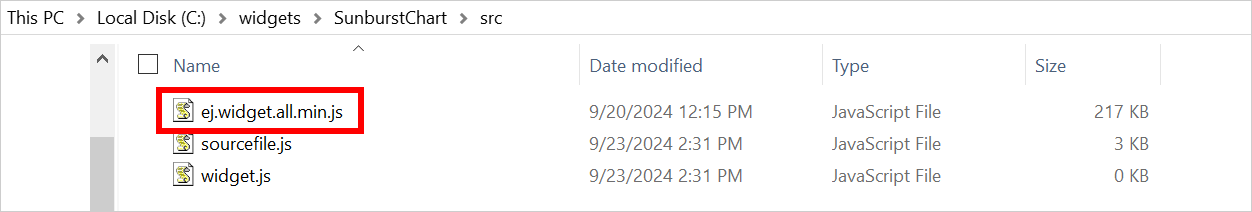
Once downloaded, extract the folder to locate the ej.widget.all.min.js file. Paste this ej.widget.all.min.js file inside the src folder which is available in the custom widgets root directory, as shown in the below image:
Replace the Icon Image
Replace the appropriate custom widget icon image located in the icon folder within the root directory of the custom widgets.
Configuring the widget source file
The source file is used to embed the user-defined widget within the dashboard. Refer to the API available in the source file below.
    bbicustom.dashboard.registerWidget(
    {

         guid : `Specifies the GUID used in widgetconfig.json`,

        widgetName : `Specifies the name of the widget used in widgetconfig.json`,

        init : function () {
        /* init method will be called when the widget is initialized. */
        },

        update : function (option) {
  	     update method will be called when any update needs to be performed in the widget. */
  	    if (option.type == "resize") {
  	     /* update type will be 'resize' if the widget is being resized. */
  	    }
  	    else if (option.type == "refresh") {
  	     /* update type will be 'refresh' when the data is refreshed. */
  	   }
     }
 });
Init method
Once your widget is initialized through the init method, the update method will be called for widget updates such as data updates and resizing.
Update method
Once your widget is initialized through the init method, the update method will be called for widget updates such as data updates and widget resizing.
The update method will be triggered for the following operations. Therefore, we perform these operations based on the update type (resize, refresh) by invoking the respective API of the widget.
-
Resize
-
Refresh
Configuring the custom widget for interaction in the sourcefile
The custom widget can participate in filter interaction like built-in widgets. Use the following APIs to facilitate communication between the widgets.
Format
var selectedColumnsFilter = [];
var filterColumn = new bbicustom.dashboard.selectedColumnInfo();
filterColumn.condition = "condition";
filterColumn.uniqueColumnName = "unique column name";
filterColumn.values =["value1", "value2", "value3"…] ;
selectedColumnsFilter.push(filterColumn);
bbicustom.dashboard.filterData(this, selectedColumnsFilter); /* selectedColumnsFilter is the list of selected column and its value send from custom widget for interaction. */
Various types of columns
-
Dimension type column
Values in the dimension column will be a string, date format, or boolean format.
-
Measure type column
Values in the measure column will be in number format.
Dimension type column
Various conditions are available for the dimension column other than the DateTime data type:
- include
- exclude
- startswith
- endswith
- contains
- notcontains
Example
The following code will filter the dimension values India and China in the other widgets.
var selectedFilterInfos = [];
var filterinfo = new bbicustom.dashboard.selectedColumnInfo();
filterinfo.condition = "include";
filterinfo.values = ["india","china"];
filterColumn.uniqueColumnName = "unique column name";
selectedFilterInfos.push(filterinfo);
bbicustom.dashboard.filterData(that, selectedFilterInfos);
NOTE: In the above code sample, pass the unique column name of a particular column from the variable
this.model.boundColumnsto filter the data in the other widgets. In this variable, all the bounded or configured data fields will be available with their bound value column name and unique column name.
Various conditions are available for the dimension column with the DateTime data type:
- range
- include
- exclude
The following code is an example of filtering the data of the specified date range in the other widgets:
var selectedFilterInfos = [];
var filterinfo = new bbicustom.dashboard.selectedColumnInfo();
filterinfo.condition = "range";
filterinfo.values =["1996", "1998"] ;
filterinfo.uniqueColumnName = "unique column name";
selectedFilterInfos.push(filterinfo);
bbicustom.dashboard.filterData(this, selectedFilterInfos);
Measure type column
To apply the filter based on the measure, the value type should be ‘dimensionormeasure’ for the data field, and the summary type of the measure should be set as none. Various condition types are available for the measure type column, as follows:
- equals
- notequals
- lessthan
- greaterthan
- lessthanorequals
- greaterthanorequals
- isbetween
- isnotbetween
The following code is an example to filter the other widgets based on the measure value:
var selectedFilterInfos = [];
var filterinfo = new bbicustom.dashboard.selectedColumnInfo();
filterinfo.condition = "greaterthan";
filterinfo.uniqueColumnName = this.model.boundColumns.Value[0].uniqueColumnName;
filterinfo.values =[100] ;
selectedFilterInfos.push(filterinfo);
bbicustom.dashboard.filterData(this, selectedFilterInfos);
The following code is an example of how to filter the values between 10248 and 10251 in the other widgets.
var selectedFilterInfos = [];
var filterinfo = new bbicustom.dashboard.selectedColumnInfo();
filterinfo.condition = "isbetween";
filterinfo.uniqueColumnName = "unique column name";
filterinfo.values =[10248,10251] ;
selectedFilterInfos.push(filterinfo);
bbicustom.dashboard.filterData(this, selectedFilterInfos);
Example
Below is an example code to configure the sourcefile.js file for the Syncfusion SunburstChart Chart.
   bbicustom.dashboard.registerWidget({

  	guid : "b0d5348d-f625-4b78-8db9-c5ed9d38eb45",

  	pluginName : "SunburstChart",

  	/* init method will be called when the widget is initialized */
  	init : function () {
  		this.content = document.createElement("div");
  		this.content.setAttribute("id", this.element.getAttribute("id") + "_hovContent");
  		$(this.content).css({'height':'30px','width':'30px','display':'none'});
  		this.element.appendChild(this.content);

  		this.widget = document.createElement("div");
  		this.widget.setAttribute("id", this.element.getAttribute("id") + "_widget");
  		this.element.appendChild(this.widget);
  			this.designId = $(this.element).closest(".e-customwidget-item").attr("id").split("_" + this.model.widgetId)[0];
  			this.designerObj = $("#" + this.designId).data("BoldBIDashboardDesigner");
  			this.formattingInfo = {};
  			this.editedColumnNames = {};
  			var widgetInstance = $(this.element).closest(".e-customwidget-item").data("widgetInstance");
  			for(var j = 0; j<widgetInstance.dataGroupInfo.FieldContainers.length; j++){
  				if(widgetInstance.dataGroupInfo.FieldContainers[j].FieldInfos.length > 0 && widgetInstance.dataGroupInfo.FieldContainers[j].FieldInfos.length > 0){
  					var length = widgetInstance.dataGroupInfo.FieldContainers[j].FieldInfos.length;
  					for(var i = 0; i < length; i++){
  						this.editedColumnNames[widgetInstance.dataGroupInfo.FieldContainers[j].FieldInfos[i].UniqueColumnName] = widgetInstance.dataGroupInfo.FieldContainers[j].FieldInfos[i].IsDisplayNameEdited ? widgetInstance.dataGroupInfo.FieldContainers[j].FieldInfos[i].DisplayName : widgetInstance.dataGroupInfo.FieldContainers[j].FieldInfos[i].Name;
  						this.formattingInfo[widgetInstance.dataGroupInfo.FieldContainers[j].FieldInfos[i].UniqueColumnName] = widgetInstance.dataGroupInfo.FieldContainers[j].FieldInfos[i].MeasureFormatting;
  					}
  				}
  			}
  		this.renderSunburstChartWithDefaultData();
  	},

  	/* update method will be called when any update needs to be performed in the widget. */
  	update : function (option) {
  		if(option.type == "resize") {
  			this.resizeWidget(option.size);
  		}
  		else if (option.type == "refresh") {
  			this.designId = $(this.element).closest(".e-customwidget-item").attr("id").split("_" + this.model.widgetId)[0];
  			this.designerObj = $("#" + this.designId).data("BoldBIDashboardDesigner");
  			this.formattingInfo = {};
  			this.editedColumnNames = {};
  			var widgetInstance = $(this.element).closest(".e-customwidget-item").data("widgetInstance");
  			for(var j = 0; j<widgetInstance.dataGroupInfo.FieldContainers.length; j++){
  				if(widgetInstance.dataGroupInfo.FieldContainers[j].FieldInfos.length > 0 && widgetInstance.dataGroupInfo.FieldContainers[j].FieldInfos.length > 0){
  					var length = widgetInstance.dataGroupInfo.FieldContainers[j].FieldInfos.length;
  					for(var i = 0; i < length; i++){
  						this.editedColumnNames[widgetInstance.dataGroupInfo.FieldContainers[j].FieldInfos[i].UniqueColumnName] = widgetInstance.dataGroupInfo.FieldContainers[j].FieldInfos[i].IsDisplayNameEdited ? widgetInstance.dataGroupInfo.FieldContainers[j].FieldInfos[i].DisplayName : widgetInstance.dataGroupInfo.FieldContainers[j].FieldInfos[i].Name;
  						this.formattingInfo[widgetInstance.dataGroupInfo.FieldContainers[j].FieldInfos[i].UniqueColumnName] = widgetInstance.dataGroupInfo.FieldContainers[j].FieldInfos[i].MeasureFormatting;
  					}
  				}
  			}
  			var widgetObj = $(this.widget).data("ejSunburstChart");
  			if(this.model.boundColumns.Value.length > 0){
  				for (var i=0; i<this.model.dataSource.length; i++) {
  					this.model.dataSource[i][this.model.boundColumns.Value[0].uniqueColumnName] =  parseInt( this.model.dataSource[i][this.model.boundColumns.Value[0].uniqueColumnName]);
  				}
  				var valueMember = this.model.boundColumns.Value[0].uniqueColumnName;
  				if (this.model.boundColumns.Levels.length > 0) {
  					var levels = [];
  					for (var level = 0; level < this.model.boundColumns.Levels.length; level++) {
  						levels.push({ groupMemberPath : this.model.boundColumns.Levels[level].uniqueColumnName });
  					}
  					widgetObj.model.levels= levels;
  				}
  				widgetObj.model.dataSource = this.model.dataSource;
  				widgetObj.model.valueMemberPath = valueMember;
  				widgetObj.redraw();
  			} else {
  				this.renderSunburstChartWithDefaultData();
  			}
  		} else if(option.type === "propertyChange"){
  			var widgetObj = $(this.widget).data("ejSunburstChart");
  			switch (option.property.name) {
  				case "showLegend":
  					widgetObj.model.legend.visible = this.model.properties.showLegend;
  				case "legendPosition":
  					widgetObj.model.legend.position = this.model.properties.legendPosition.toLowerCase();
  				case "p1Color":
  					widgetObj.model.palette[0] = this.model.properties.p1Color.slice(0,7);
  				case "p2Color":
  					widgetObj.model.palette[1] = this.model.properties.p2Color.slice(0,7);
  				case "p3Color":
  					widgetObj.model.palette[2] = this.model.properties.p3Color.slice(0,7);
  				case "p4Color":
  					widgetObj.model.palette[3] = this.model.properties.p4Color.slice(0,7);
  				case "p5Color":
  					widgetObj.model.palette[4] = this.model.properties.p5Color.slice(0,7);
  				case "p6Color":
  					widgetObj.model.palette[5] = this.model.properties.p6Color.slice(0,7);
  				case "p7Color":
  					widgetObj.model.palette[6] = this.model.properties.p7Color.slice(0,7);
  				case "p8Color":
  					widgetObj.model.palette[7] = this.model.properties.p8Color.slice(0,7);
  				case "p9Color":
  					widgetObj.model.palette[8] = this.model.properties.p9Color.slice(0,7);
  				case "p10Color":
  					widgetObj.model.palette[9] = this.model.properties.p10Color.slice(0,7);
  				case "showDataLabel":
  					widgetObj.model.dataLabelSettings.visible = this.model.properties.showDataLabel;
  				case "labelOverflowMode":
  					widgetObj.model.dataLabelSettings.labelOverflowMode = this.model.properties.labelOverflowMode.toLowerCase();
  				case "dlRotation":
  					widgetObj.model.dataLabelSettings.labelRotationMode = this.model.properties.dlRotation.toLowerCase();
  				case "animation":
  					widgetObj.model.enableAnimation = this.model.properties.animation;
  			}
  			widgetObj.redraw();
  		}
  	},

  	/*This method is called for rendering the chart*/
  	renderSunburstChartWithDefaultData : function () {
  		$(this.widget).css({"width":$(this.element).width(), "height":$(this.element).height()});
  		var dataSource = [{ Item: "Item1", Value: 50 },{ Item: "Item2", Value: 60 },{ Item: "Item3", Value: 70 },{ Item: "Item4", Value: 80 },{ Item: "Item5", Value: 90 },{ Item: "Item6", Value: 90 },{ Item: "Item7", Value: 90 },{ Item: "Item8", Value: 90 },{ Item: "Item9", Value: 90 },{ Item: "Item10", Value: 90 },{ Item: "Item11", Value: 90 }];
  		var levels = [];
  		var valueMember = "Value";
  		levels = [ { groupMemberPath: "Item" }];
  		$(this.widget).ejSunburstChart({
  			dataSource: dataSource,
  			valueMemberPath: valueMember, levels: levels,
  			palette: [this.model.properties.p1Color.slice(0,7), this.model.properties.p2Color.slice(0,7), this.model.properties.p3Color.slice(0,7), this.model.properties.p4Color.slice(0,7),this.model.properties.p5Color.slice(0,7), this.model.properties.p6Color.slice(0,7), this.model.properties.p7Color.slice(0,7), this.model.properties.p8Color.slice(0,7), this.model.properties.p9Color.slice(0,7), this.model.properties.p10Color.slice(0,7)],
  			tooltip: { visible: true},
  			margin: (this.marginVisibility())? { left: 10, top: 10, bottom: 10, right: 10} :{ left: 0, top: 0, bottom: 0, right: 0} ,
  			border: { width: (this.marginVisibility())? 2:0 },
  			load: $.proxy(this.sunburstChartLoad),
  			enableAnimation: false,
  			animationType: 'Rotation',
  			innerRadius: 0.2,
  			dataLabelSettings:{
  				visible:(this.model.properties.showDataLabel?this.dataLabelVisibility():false),
  				labelOverflowMode:this.model.properties.labelOverflowMode.toLowerCase(),
  				labelRotationMode : this.model.properties.dlPosition,
  			},
  			size: { height: $(this.element).height(), width: $(this.element).width()},
  			legend: { visible:  (this.model.properties.showLegend ? this.legendVisibility():false) , position: this.model.properties.legendPosition.toLowerCase() },
  			highlightSettings: {enable: true},
  			selectionSettings: {enable: true, mode : "parent"},
  			pointRegionClick: $.proxy(this.pointRegionClick, this),
  			tooltipInitialize: $.proxy(this.tooltipInitialize, this),
  		});
  	},
  	/*To render the tooltip*/
  	tooltipInitialize : function(args){
  		var widgetInstance = $(this.element).closest(".e-customwidget-item").data("widgetInstance");
  		var isTooltioCustomizationDone = false;
  		for(var i = 0; i < this.model.dataSource.length; i++){
  			for(var j = 0; j < args.model.levels.length; j++){
  				if(args.data.currentText.indexOf(this.model.dataSource[i][args.model.levels[j].groupMemberPath]) > -1){
  					if(this.model.boundColumns.tooltip.length > 0){
  						args.data.currentText = args.data.currentText.split(":")[0] + ": " + this.formatDataNumber(args.data.currentText.split(":")[1]);
  						for(var k = 0; k < this.model.boundColumns.tooltip.length; k++){
  							args.data.currentText += "</br>" + widgetInstance.dataColumnBindings[this.model.boundColumns.tooltip[k].uniqueColumnName] + " : " + this.formatTooltipNumber(k,this.model.dataSource[i][this.model.boundColumns.tooltip[k].uniqueColumnName]);
  						}
  					}
  					else{
  						args.data.currentText = args.data.currentText.split(":")[0]+ ": " + this.formatDataNumber(args.data.currentText.split(":")[1]);
  					}
  					isTooltioCustomizationDone = true;
  					break;
  				}
  			}if(isTooltioCustomizationDone){break;}
  		}
  	},

  	/*formatTooltipNumber method is for formatting the measure values*/
  	formatTooltipNumber: function (index,number) {
  			var formatInfo = JSON.parse(JSON.stringify(this.formattingInfo[this.model.boundColumns.tooltip[index].uniqueColumnName]));
  			var number = BoldBIDashboard.DashboardUtil.formattedText(number, formatInfo.Culture, formatInfo.DecimalPoints, formatInfo.FormatType, formatInfo.DecimalSeparator, formatInfo.GroupSeparator, formatInfo.Prefix, formatInfo.Suffix, formatInfo.Unit, true, this.designerObj);
  		return number;
  	},

  	/*formatDataNumber method is for formatting the measure values*/
  	formatDataNumber: function (number) {
  			var number = Number(number);
  			var formatInfo = this.formattingInfo[this.model.boundColumns.Value[0].uniqueColumnName];
  			number = BoldBIDashboard.DashboardUtil.formattedText(number, formatInfo.Culture, formatInfo.DecimalPoints, formatInfo.FormatType, formatInfo.DecimalSeparator, formatInfo.GroupSeparator, formatInfo.Prefix, formatInfo.Suffix, formatInfo.Unit, true, this.designerObj);
  		return number;
  	},

  	pointRegionClick : function(e){
  		if(this.model.initMode == "runtime"){
  		var data = [];
  		var levels = [];
  		for(var k = 0; k < e.data.pointData[0].layerNumber; k++){
  			levels.push(e.model.levels[k]);
  		}
  		var layerNumber = e.data.pointData[0].layerNumber - 1;
  		for(var i = 0; i < this.model.dataSource.length; i++){

  			if((e.data.pointData[0].x == this.model.dataSource[i][levels[levels.length-1].groupMemberPath]) && (e.model.points[e.data.pointData[0].legendIndex].x == this.model.dataSource[i][e.model.levels[0].groupMemberPath])){
  				for(var j = 0; j < levels.length; j++){
  					var temp = {};
  					temp[levels[j].groupMemberPath] = this.model.dataSource[i][levels[j].groupMemberPath];
  					data.push(temp);
  				}
  				for(var x = 0; x < this.model.boundColumns.filter.length; x++){
  					var temp = {};
  					temp[this.model.boundColumns.filter[x].uniqueColumnName] = this.model.dataSource[i][this.model.boundColumns.filter[x].uniqueColumnName];
  					data.push(temp);
  				}
  				break;
  			}
  		}
  		var zero = 0;
  		var selectedFilterInfos = [];
  		if (data.length > zero) {
  			for (i = 0; i < data.length; i++) {
  						var filterinfo = new bbicustom.dashboard.selectedColumnInfo();
  						filterinfo.condition = "include";
  						filterinfo.uniqueColumnName = Object.keys(data[i])[0];
  						filterinfo.values.push(data[i][Object.keys(data[i])[0]]);
  						selectedFilterInfos.push(filterinfo);
  			}
  		}
  		if (this.model.enableLinking) {
  			if (this.model.linkSettings.enableTabularUrlLinking) {
  				for (var i = 0; i < this.model.linkSettings.urlPatterns.length; i++) {
  					if (this.model.linkSettings.urlPatterns[i].uniqueColumnName === selectedFilterInfos[0].uniqueColumnName ) {
  						urlCaption = this.model.linkSettings.urlPatterns[i].urlLink;
  					}
  				}
  			}
  			bbicustom.dashboard.navigateThroughLinking(this,selectedFilterInfos,urlCaption);
  		}
  		else {
  			bbicustom.dashboard.filterData(this,selectedFilterInfos);
  		}
  		}
  	},
  	sunburstChartLoad : function (e) {
  		this.elementSpacing = (this.element.width() > 200 && this.element.height() > 200) ? 10 : 0;
  	},

  	resizeWidget : function (size) {
  		$(this.widget).css({"width": size.width, "height": size.height});
  		var sunburstObj = $(this.widget).data("ejSunburstChart");
  		sunburstObj.model.size.height = size.height-5;
  		sunburstObj.model.size.width = size.width;
  		sunburstObj.model.margin =(this.marginVisibility())? { left: 10, top: 10, bottom: 10, right: 10} :{ left: 0, top: 0, bottom: 0, right: 0} ,
  		sunburstObj.model.legend.visible = this.model.properties.showLegend ? this.legendVisibility():false;
  		sunburstObj.model.legend.position = this.model.properties.legendPosition.toLowerCase();
  		sunburstObj.model.dataLabelSettings.visible = this.dataLabelVisibility();
  		sunburstObj.redraw();
  	},

  	marginVisibility : function () {
  		return ($(this.widget).width() > 200 && $(this.widget).height() > 200);
  	},

  	legendVisibility : function (e) {
  		return ($(this.element).width() > 300 && $(this.element).height() > 300);
  	},

  	dataLabelVisibility : function (e) {
  		return !($(this.element).width() < 300 || $(this.element).height() < 300);
  	},

  	getAnimationType : function(animationType) {
  		if (animationType === "FadeIn")
  			return "fadein";
  		else if(animationType === "Rotation")
  			return "rotation";
  	},

  	getRotationMode : function(rotationMode) {
  		if (rotationMode === "Normal")
  			return "normal";
  		else if(rotationMode === "Angle")
  			return "angle";
  	}
});
The variables used in the code sample above are explained below:
| Syntax | Uses |
|---|---|
| this.element | this.element Container div element in which the custom widget should be embedded. |
| this.model.dataSource | Holds the datasource for the custom widget in JSON format |
| this.model.boundColumns
|
Holds the information about the bounded column to the control.
|
Converting the widget to a *.bicw file
After configuring the widget, you can pack it using the custom widget utility.
To import the custom widget in the Bold BI designer, you need to pack the widget in the *.bicw format. Follow the steps below to convert the custom widget to the *.bicw file:
- Run the custom widget utility by following the steps provided.
- Run the pack command to convert the widget to a *.bicw file.
Format
pack C:\widgets\SunburstChart
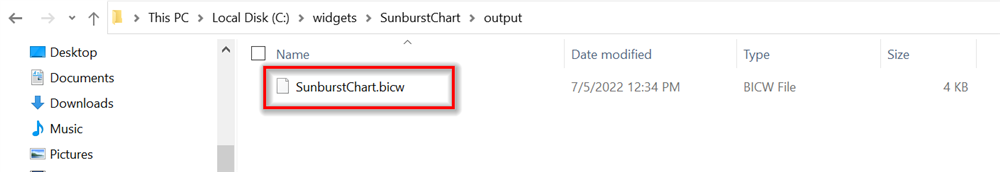
In the above command C:\widgets\SunburstChart denotes the root path of the widget to be packed.
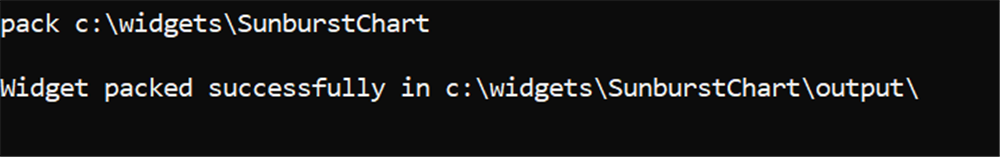
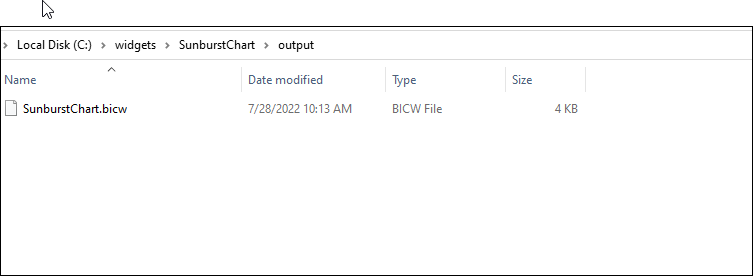
The SunburstChart.bicw file will be created in the output folder.
Publish Custom Widget
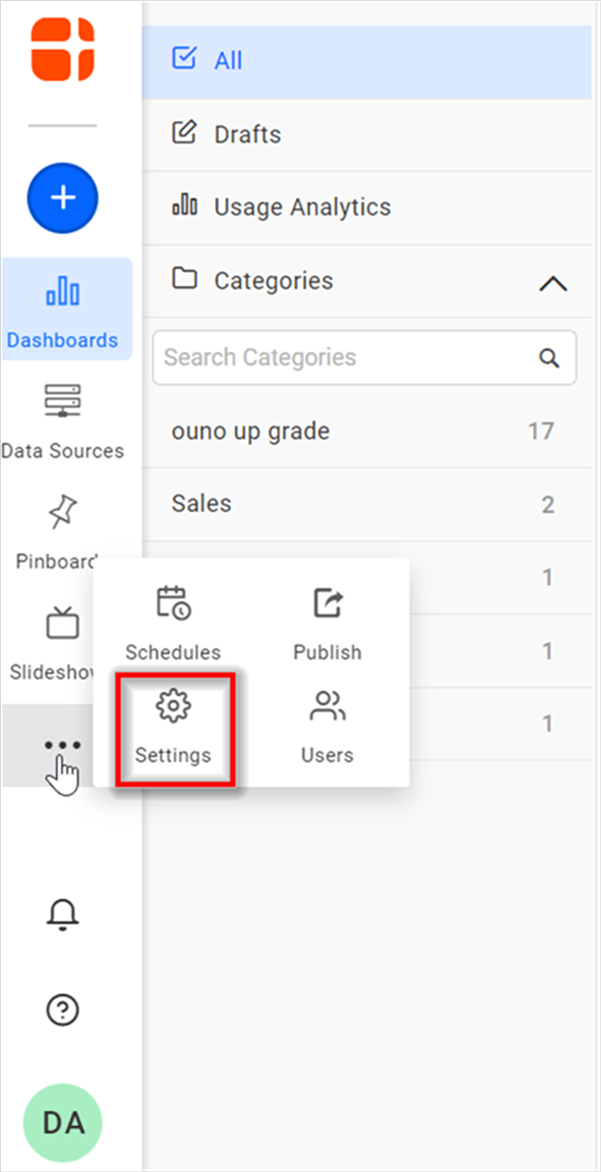
To import the custom widgets, click on the Settings icon in the Bold BI Server, as shown in the image below:
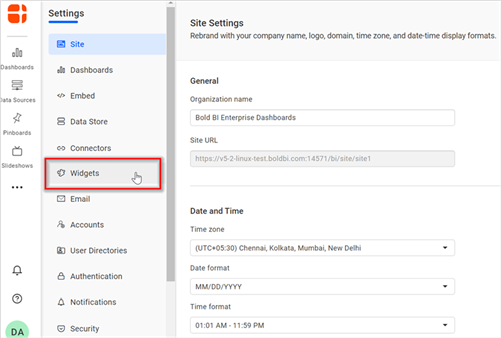
Click on the Widgets tab, as shown in the image below.
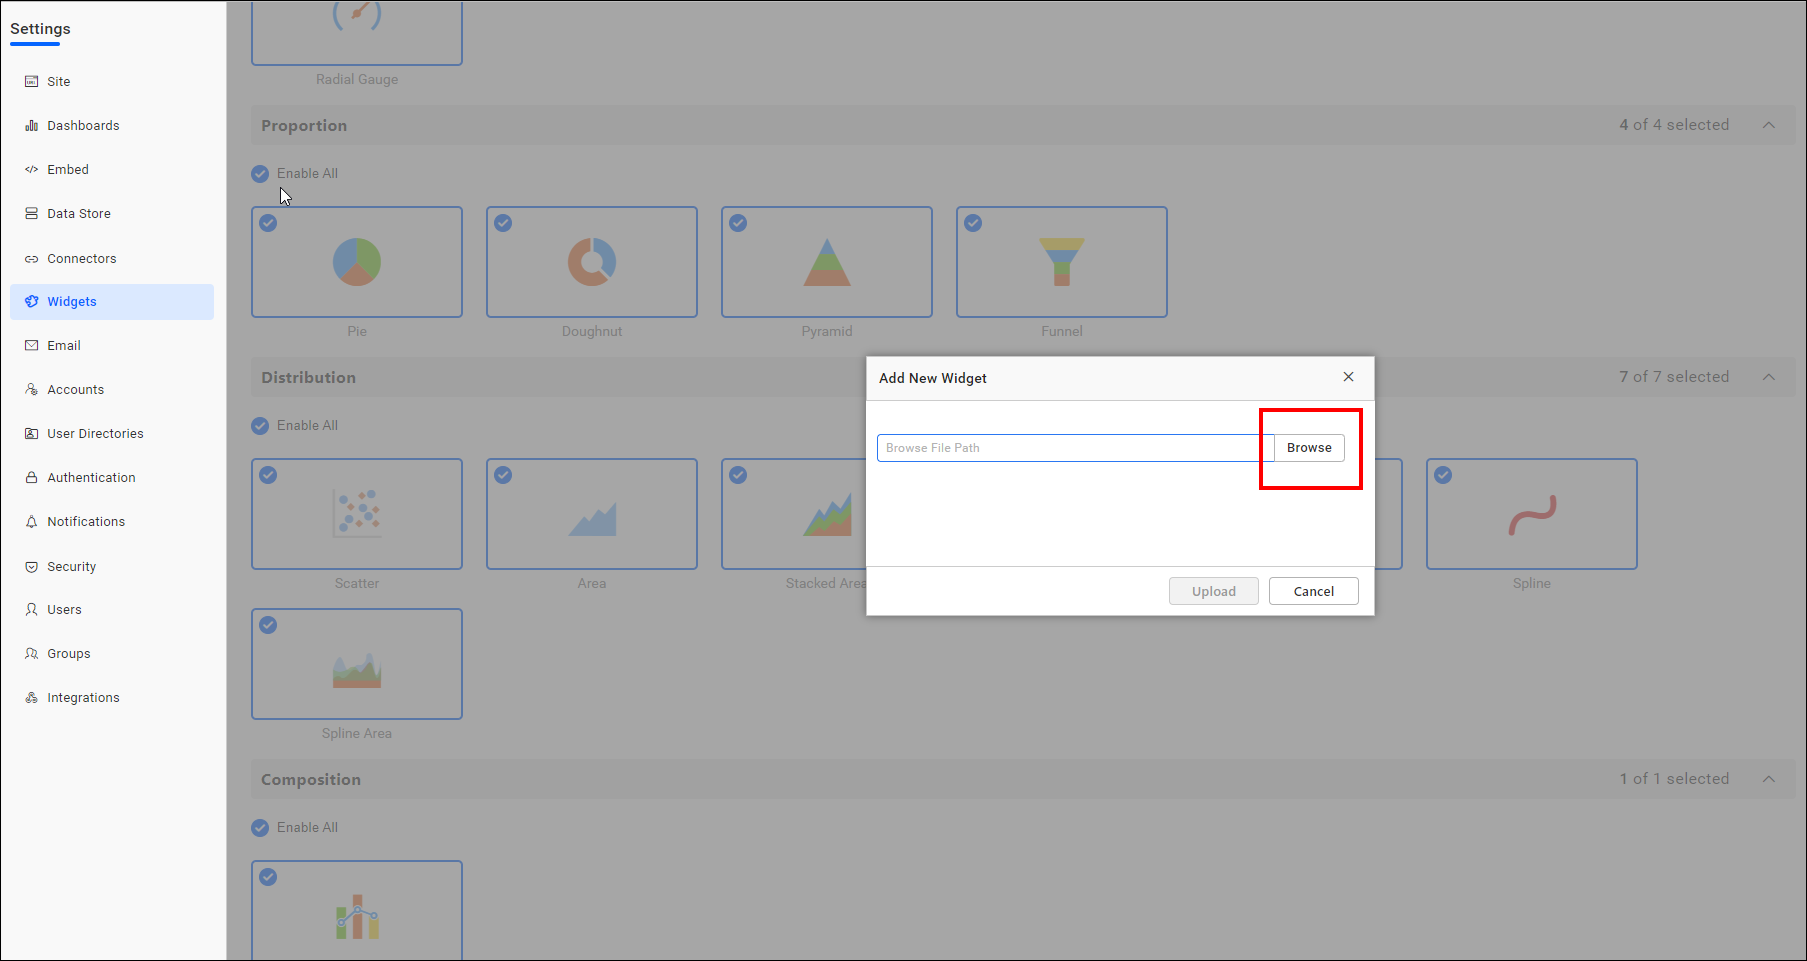
Click on Add New Widget, as shown in the image below.

Browse to the custom widget file location and select the custom widget (*.bicw) to be added to the designer.
The custom widget file selected should be in bicw format. Refer to this link for converting to “bicw” format.
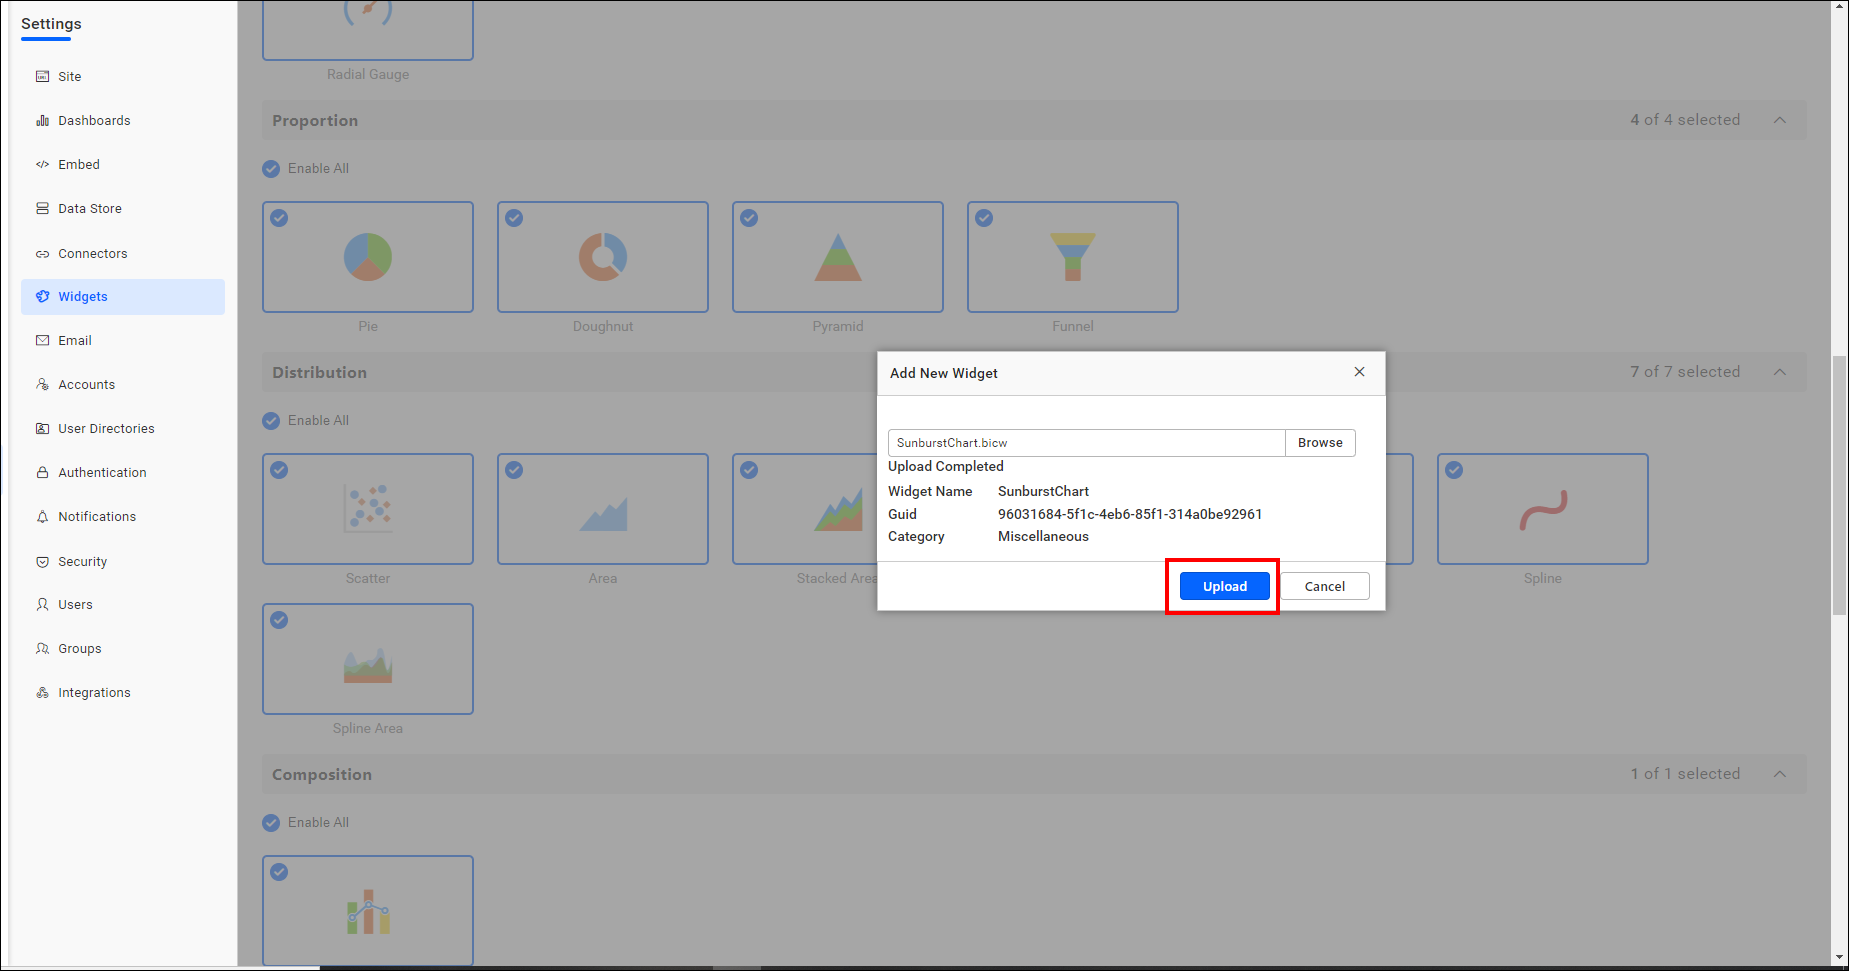
Once the custom widget is uploaded, it will appear under the Custom Widgets category.
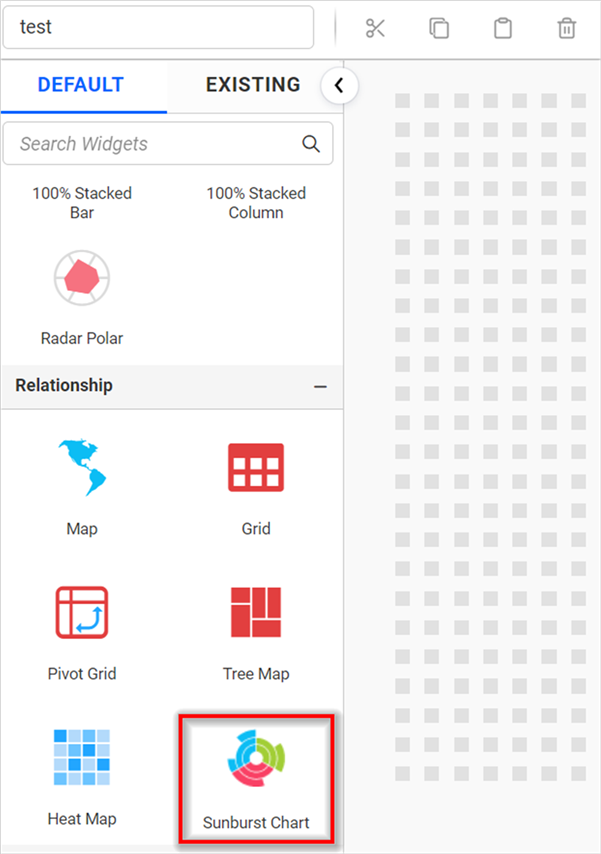
Now the custom widget will appear in the Bold BI Designer, as shown in the image below.
NOTE: The custom widget will be published within the particular tenant alone.
- Prerequisites and knowledge required for development of the custom widget
- Creating a new widget
- Create a custom widget template
Having trouble getting help?
Contact Support- Prerequisites and knowledge required for development of the custom widget
- Creating a new widget
- Create a custom widget template
Having trouble getting help?
Contact Support