Search results
Chart Axis Grid Lines
The chart widget with enabled axis gridlines makes it easier for users to read values.
Grid lines can be turned on or off using the checkbox option in the Grid lines section of the widget’s property pane for each chart axis.
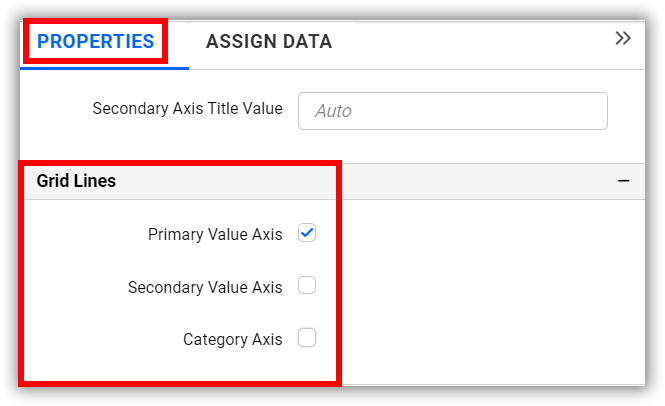
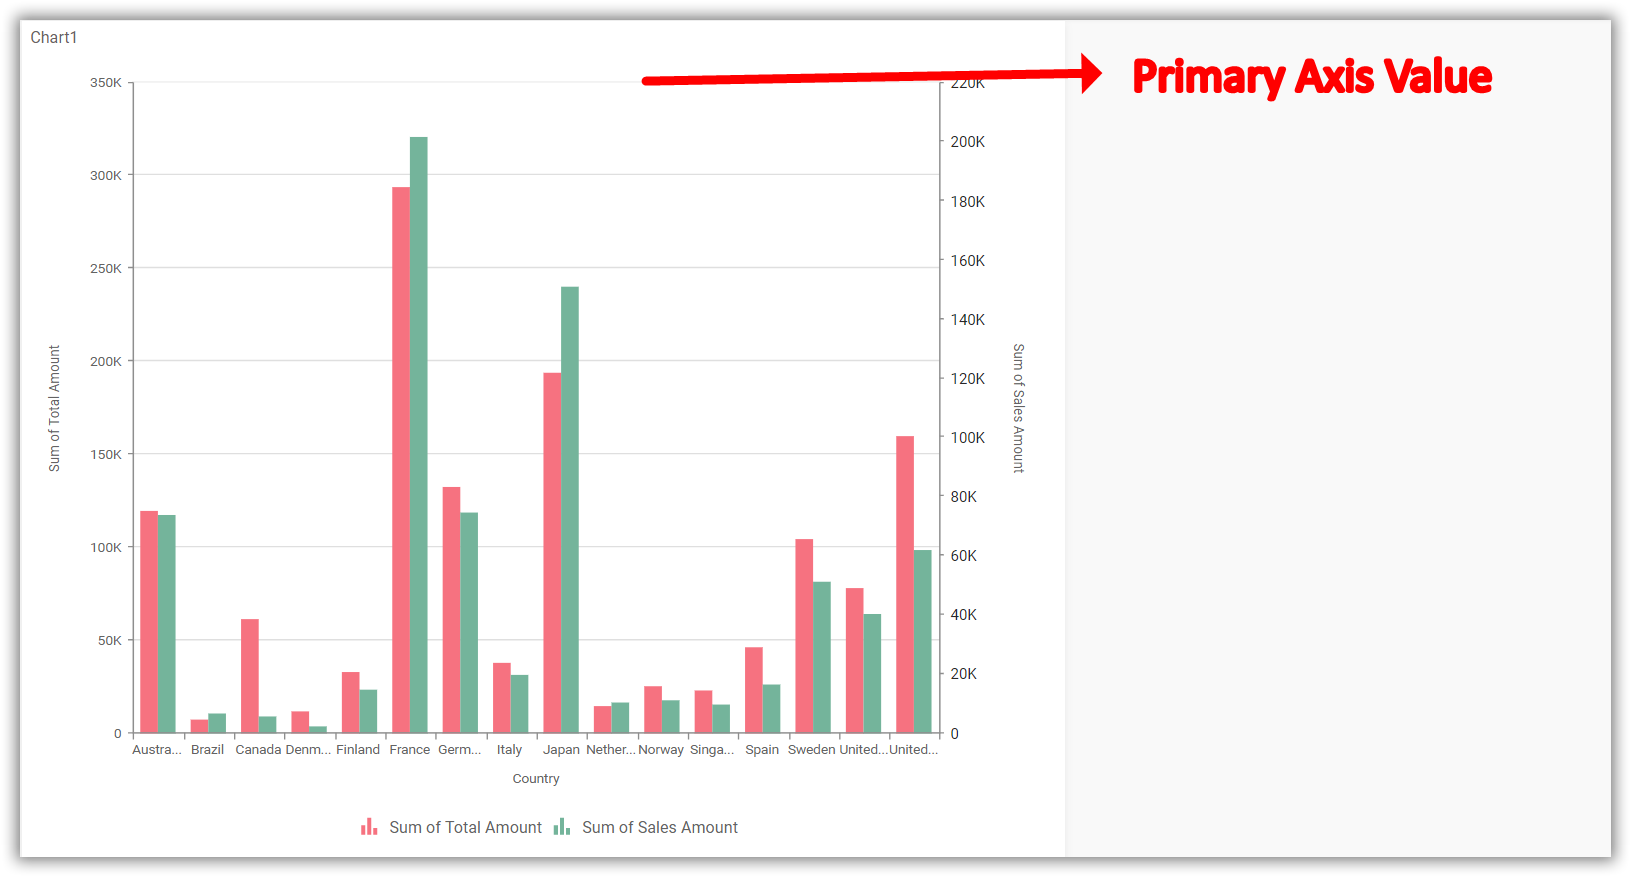
Primary value Axis
This option allows you to toggle the visibility of the Primary Value Axis gridlines in the chart. It is enabled by default.
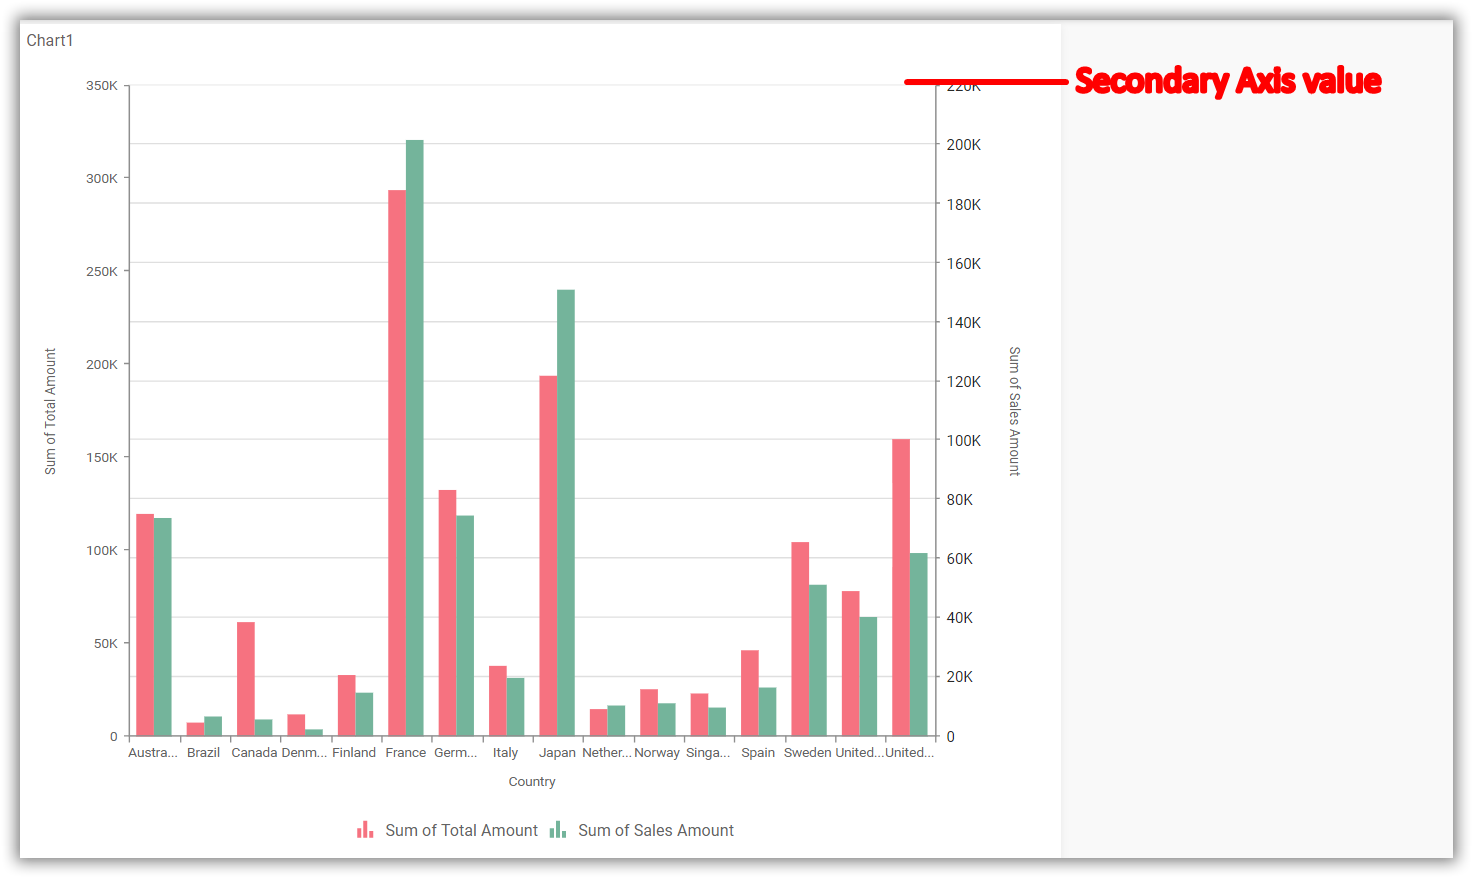
Secondary value Axis
This option allows you to toggle the visibility of the Secondary Value Axis gridlines in the chart. It will only be displayed in the widget when the secondary axis is used.
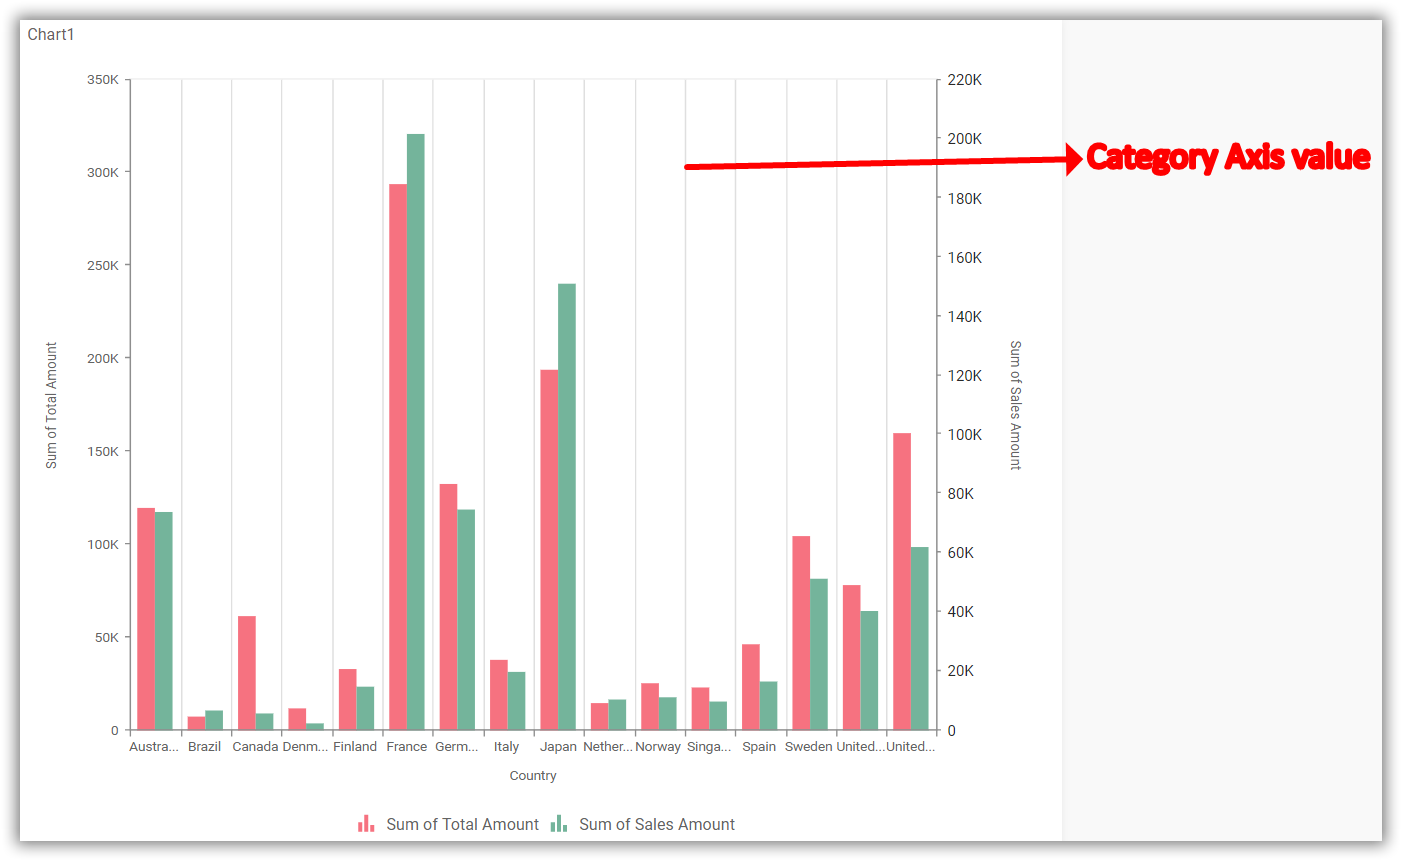
Category Axis
This option allows you to toggle the visibility of the Category Axis gridlines in the chart. By default, this option is disabled.
Contents
Having trouble getting help?
Contact SupportContents
Having trouble getting help?
Contact SupportThank you for your feedback and comments.We will rectify this as soon as possible!