Trendlines
Trendlines help determine the general pattern or overall direction of the data in the chart widget. You can add more than one trendline to Cartesian charts, except for bar type series (Line, Column, Area, Spline) and stacked types of charts. You are able to add, edit, and delete trendlines.
Add and edit trendline
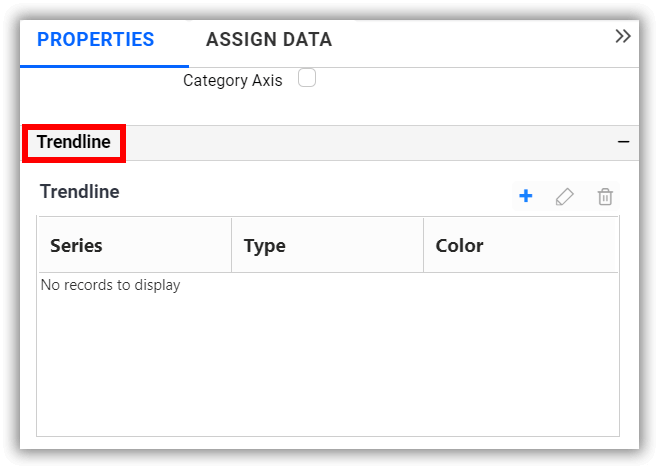
- The trendlines option can be found under the
propertiestab of the applicable chart widgets.
- To add a trendline, click the highlighted button.
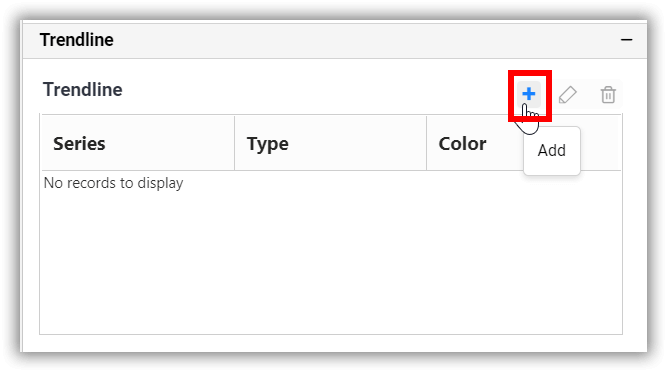
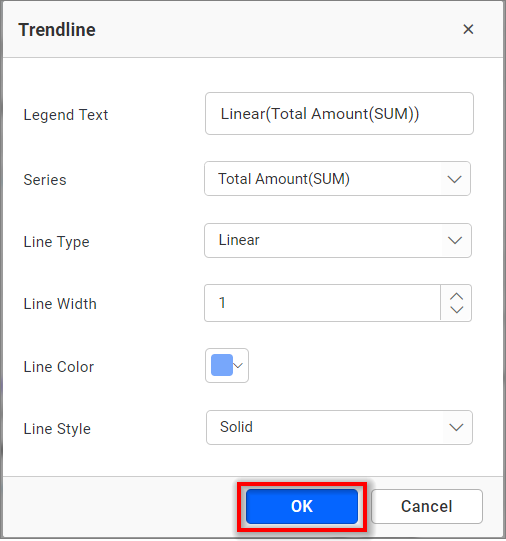
- A dialog will then open.
- Click the
OKbutton to add the trendline in the combination chart.
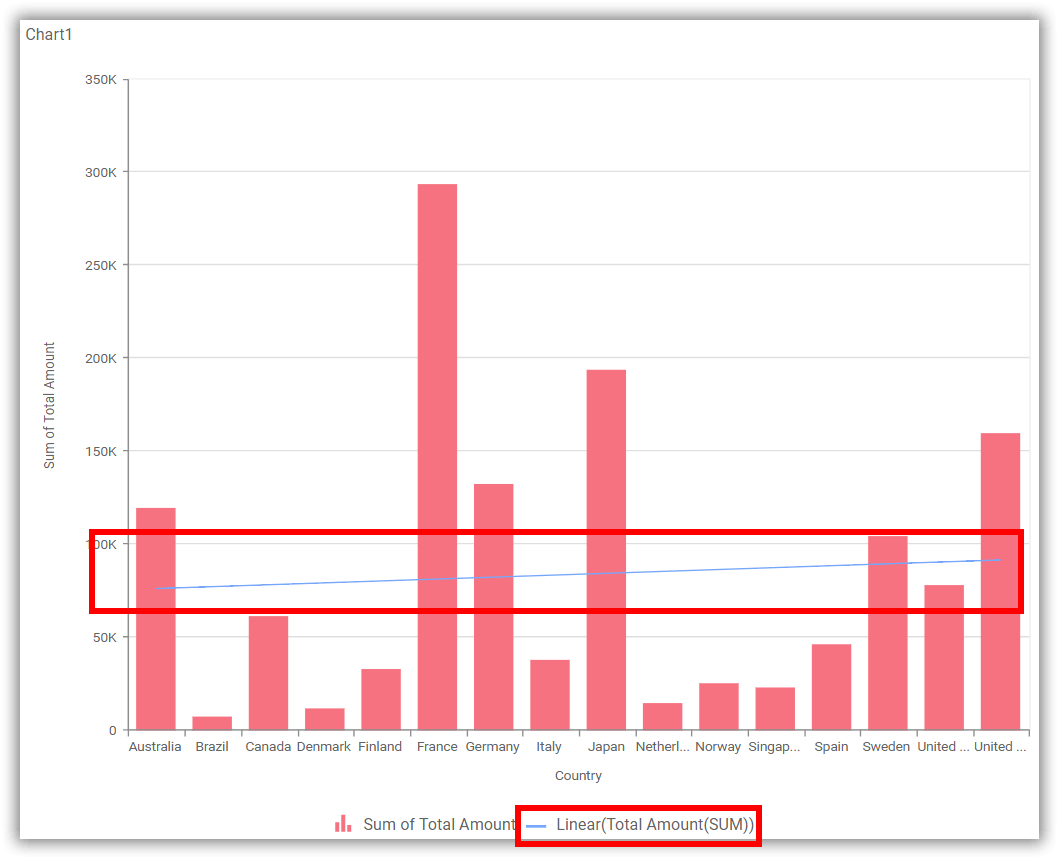
- The chart will render accordingly.
- To edit a trendline, select the one to be edited and click the highlighted button.
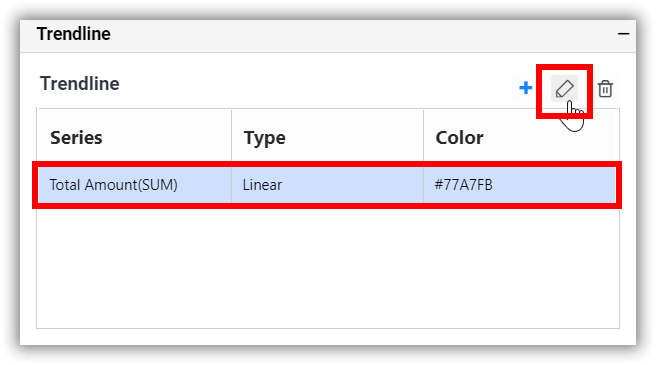
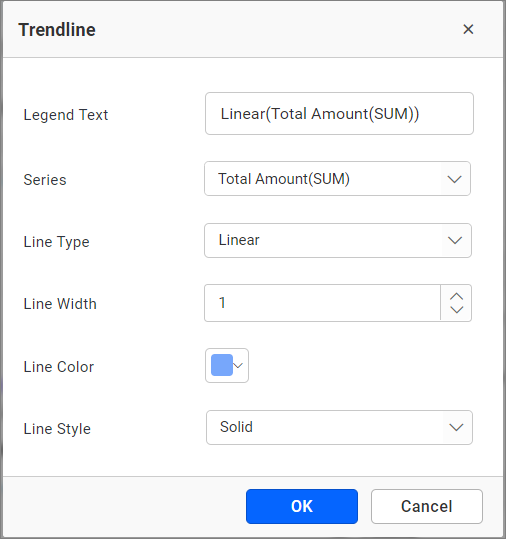
- Once again, the trendline dialog window will open.

Legend text
You can edit the trendline legend in the Legend Text text box. By default, the Legend Text is rendered based on the Line type and Series name.
Series
You can change the series that shows the trendline by selecting from the Series drop-down option.
Line type
The line type can be selected from the Line Type drop-down option (Linear, Exponential, Logarithmic, Power, and Polynomial).
Line Width
You can set the width of the trendline.
Line color
The color of the trendline can be changed using the Line Color color picker.
Line style
The style of the trendline can be changed by selecting from the Line Style drop-down option (Solid, Dot, Dash, DotDash, LongDash, and LongDashDotDot).
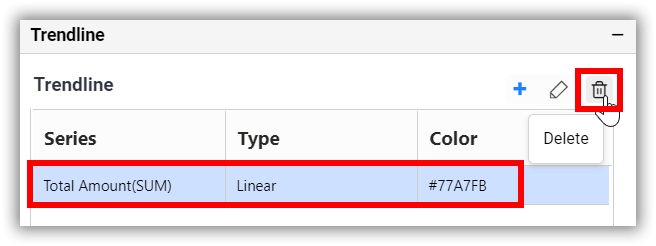
Delete trendline
To delete a trendline, select the one to be deleted and click the highlighted button.