Tooltip customization in the widgets
Tooltips help users understand the exact numerical representation of the data records displayed in the widgets. They are informative and provide a robust way for users to explore raw data for a specific period or point, instead of showing all records at once in the visual.
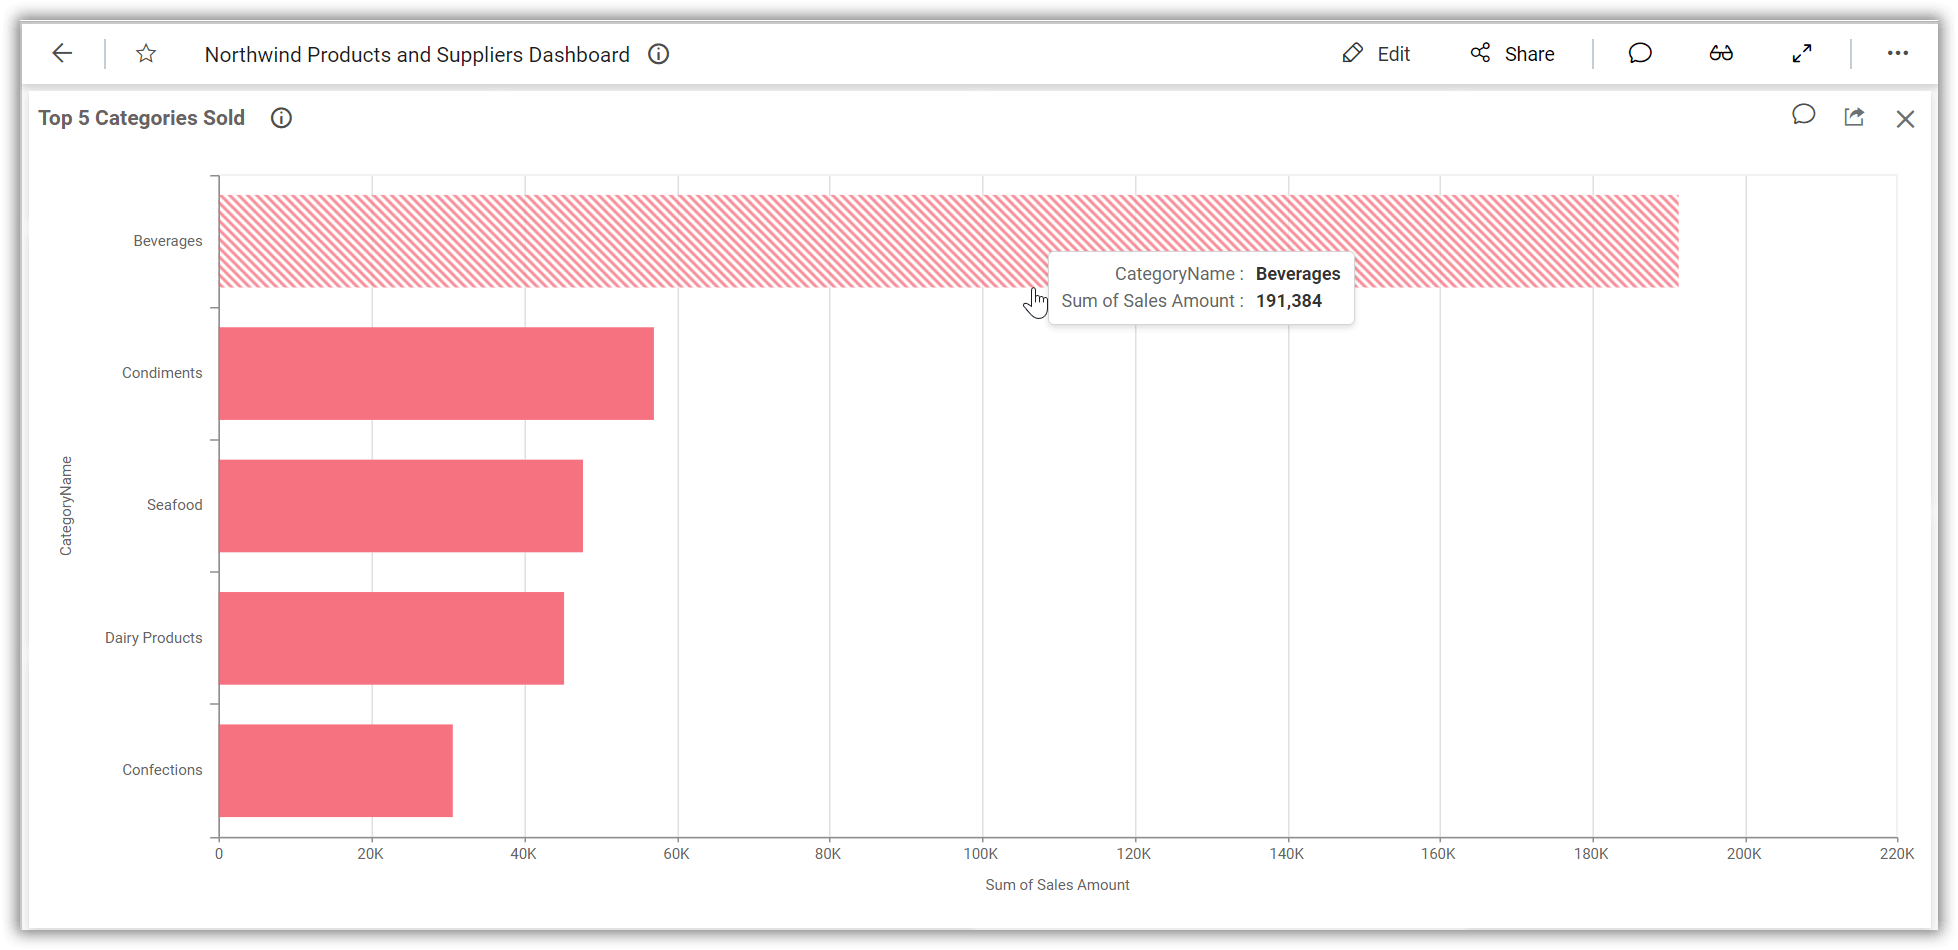
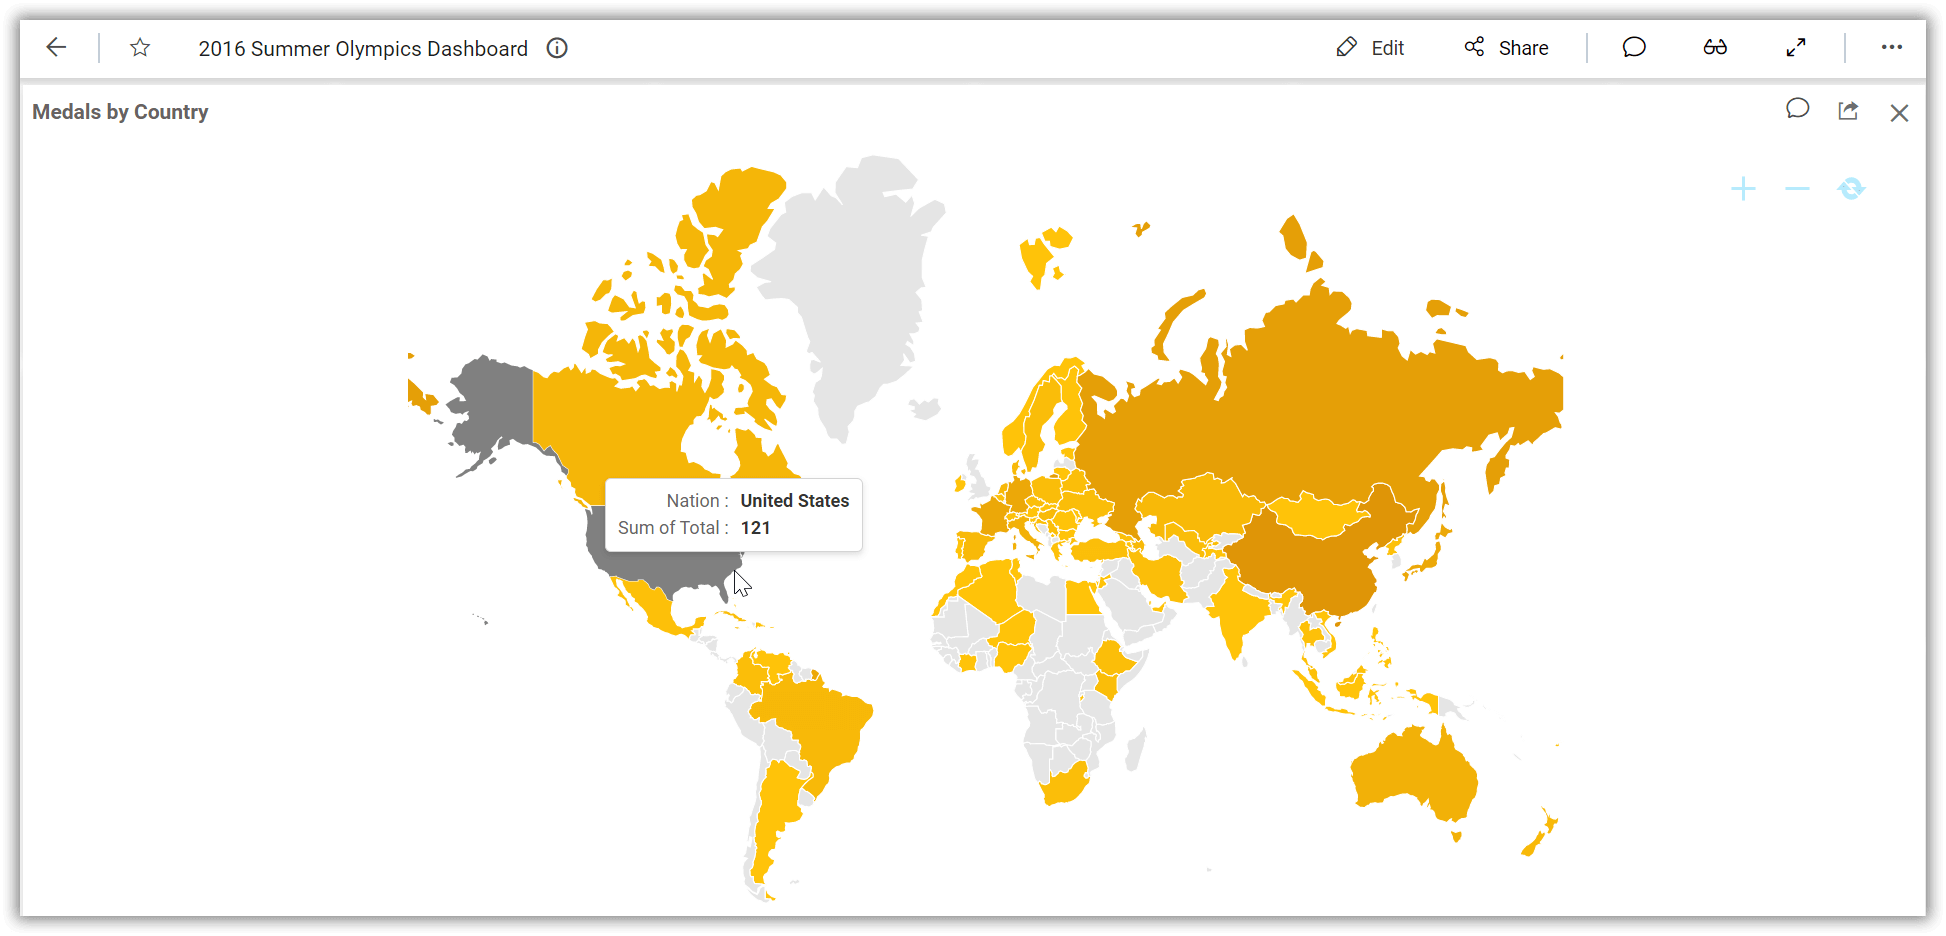
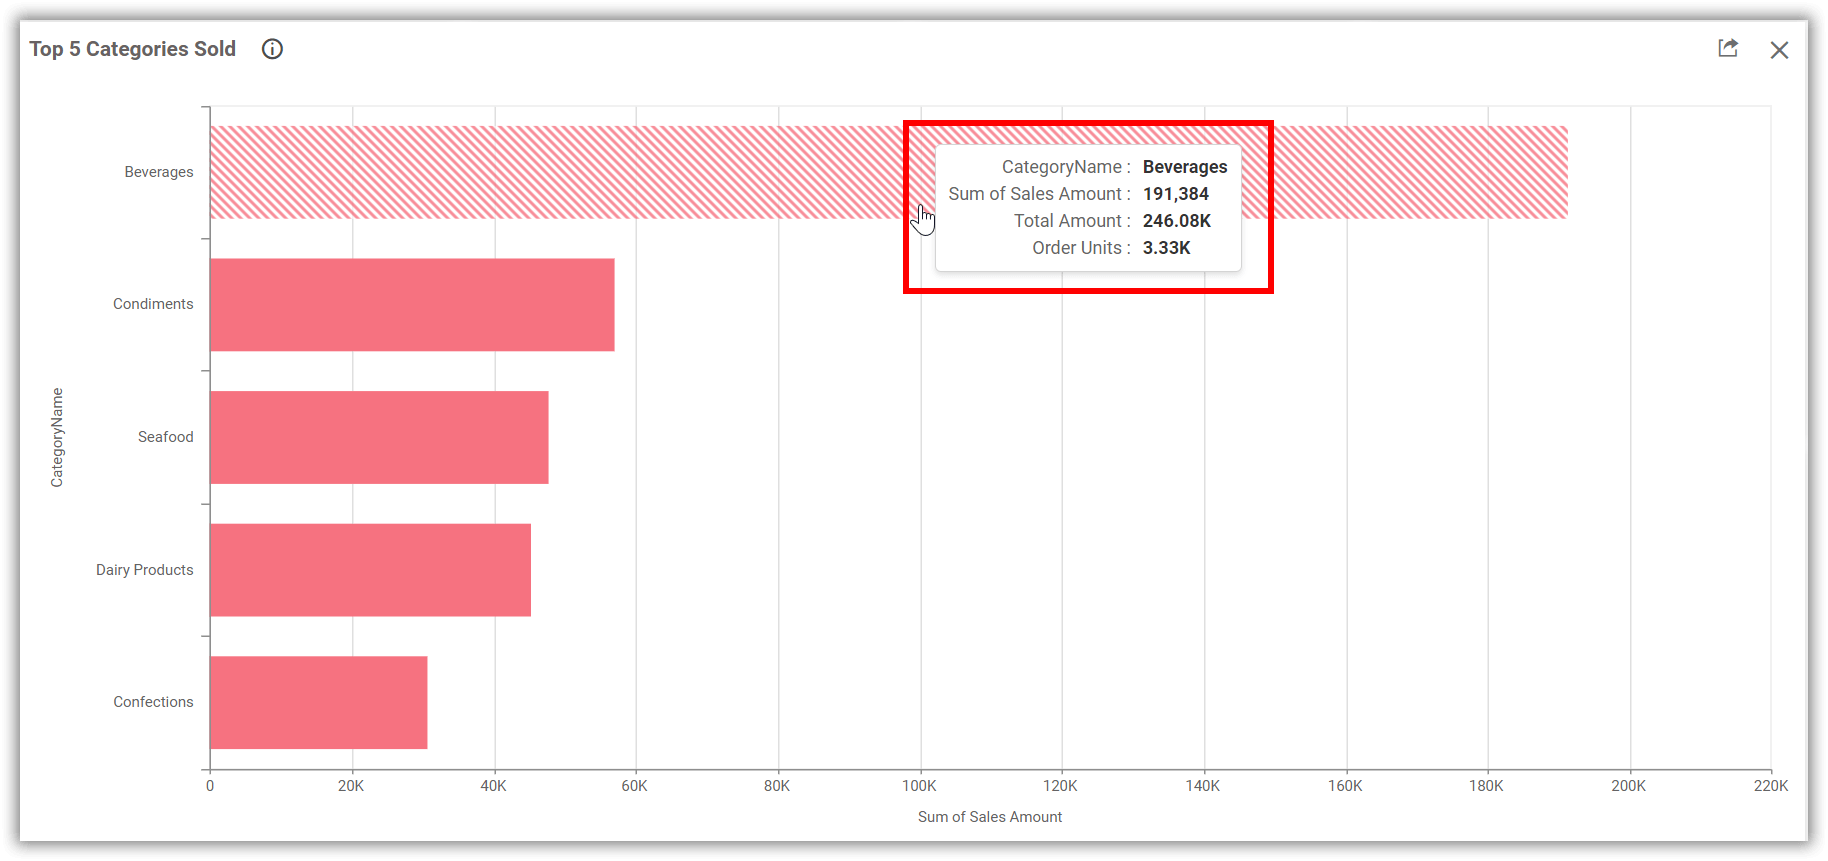
Initially, the widgets show the configured data values and corresponding data points’ category as default tooltip information when hovering the mouse, as shown in the screenshots below.
Chart widget: Shows the total sales amount for the sold top 5 categories.
Map widget: Shows the total number of medals won by each country during the 2016 Summer Olympics.
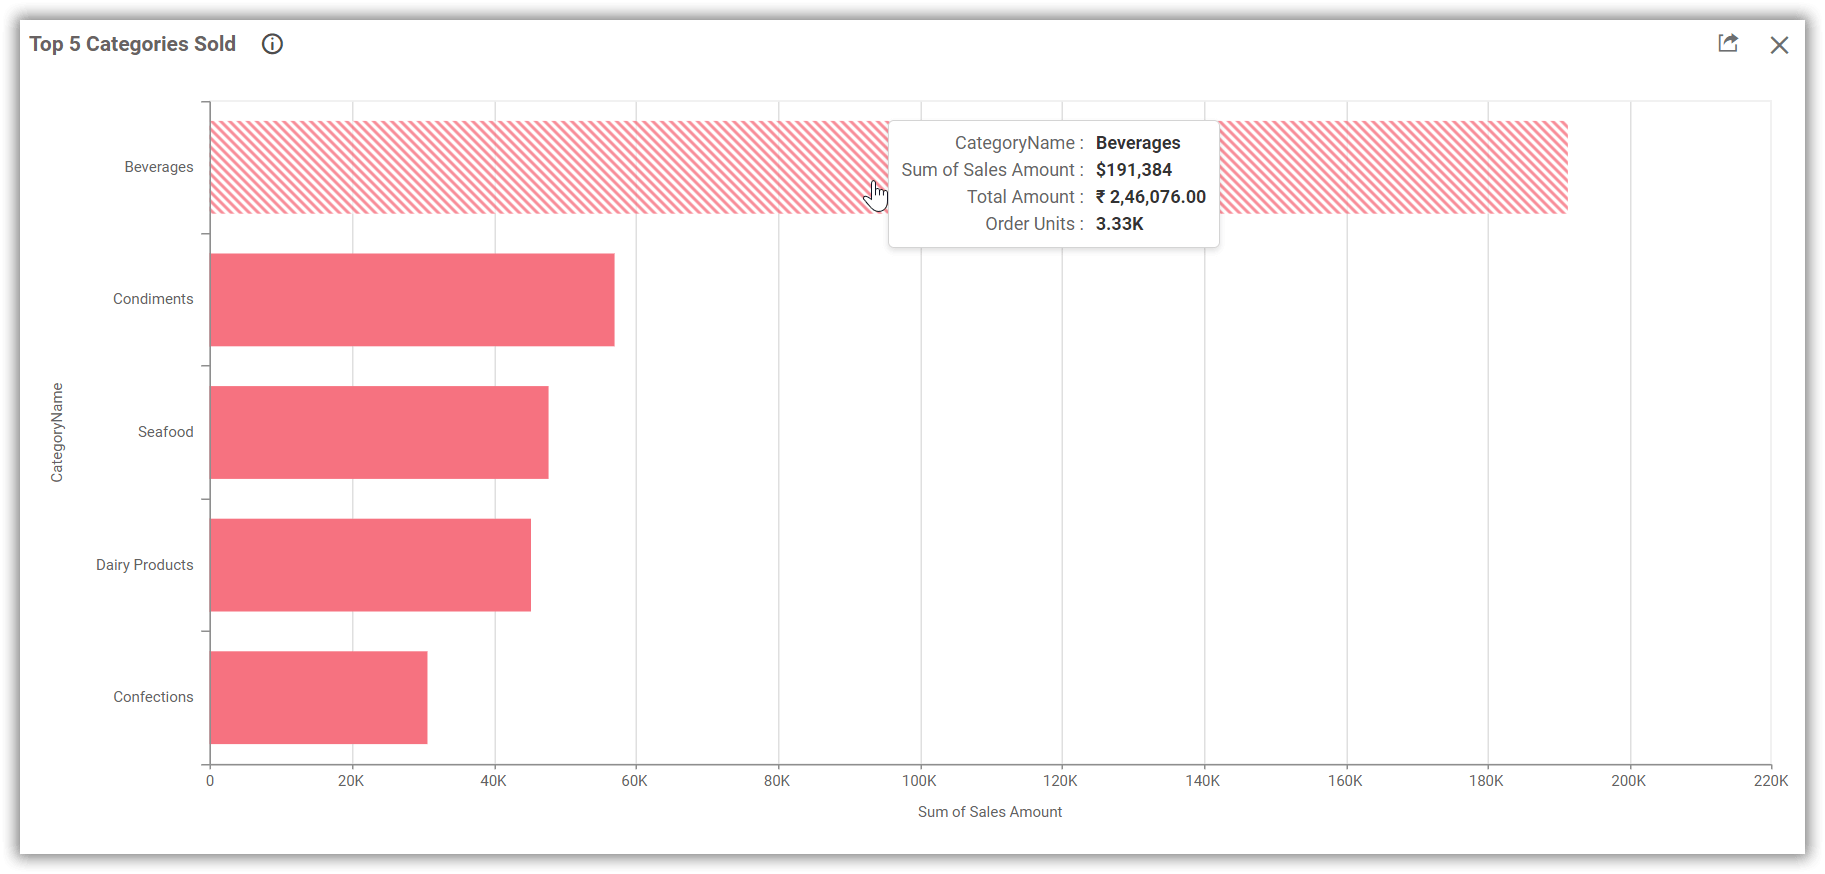
Additional information can be showcased in the tooltip without affecting the visualization of the configured widget.
To do this, configure additional tooltip fields in the applicable widgets. This will display extra information alongside the default tooltip information.
The following sections discuss how to add additional tooltip fields and how to format the data values displayed in the tooltip.
How to configure additional tooltip fields in the widgets
- Open the dashboard in the
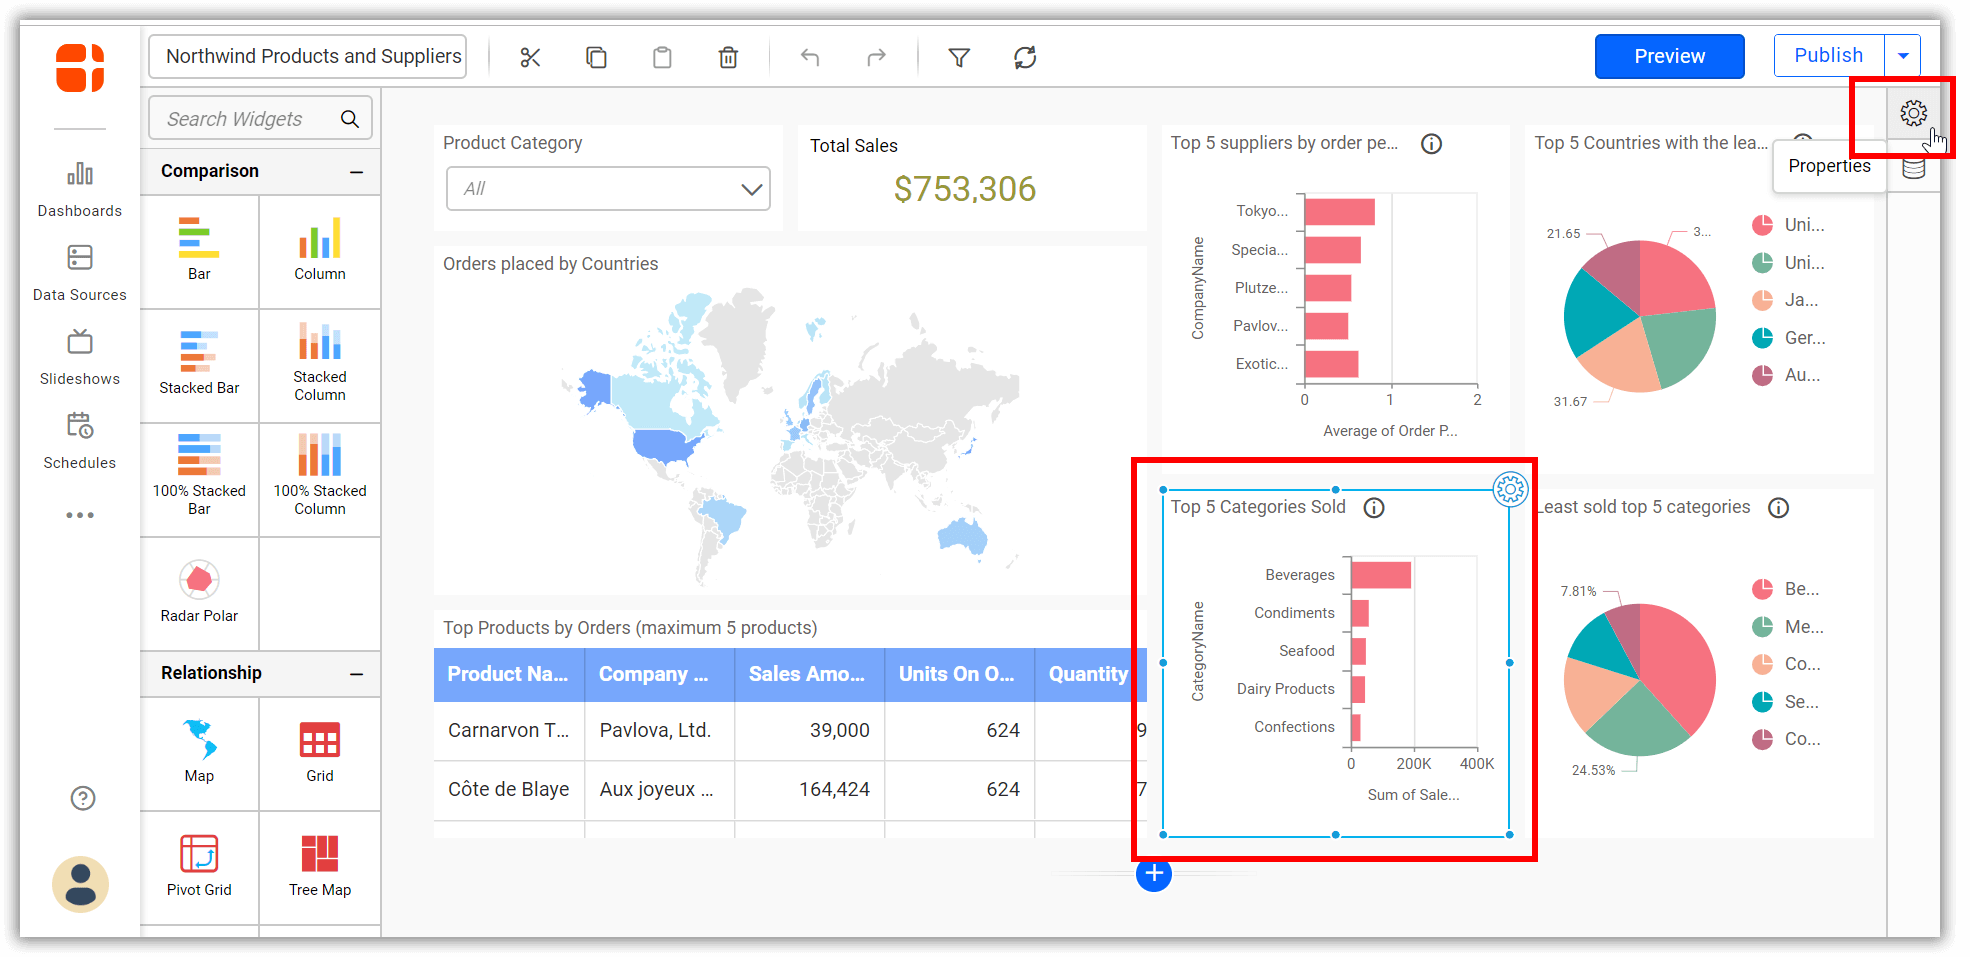
Dashboard Designer. - Select the
widgetin the design layout where you want to add additional tooltip fields. - Click the
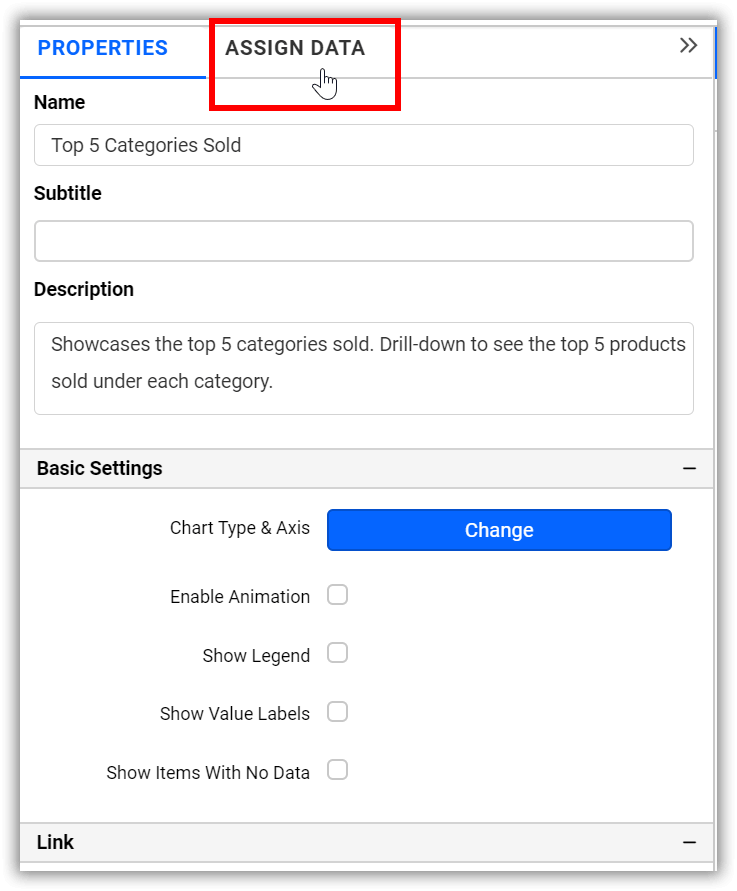
propertiesicon as shown in the screenshot.
 4. The properties pane will open. Click
 ASSIGN DATA to open the data pane.
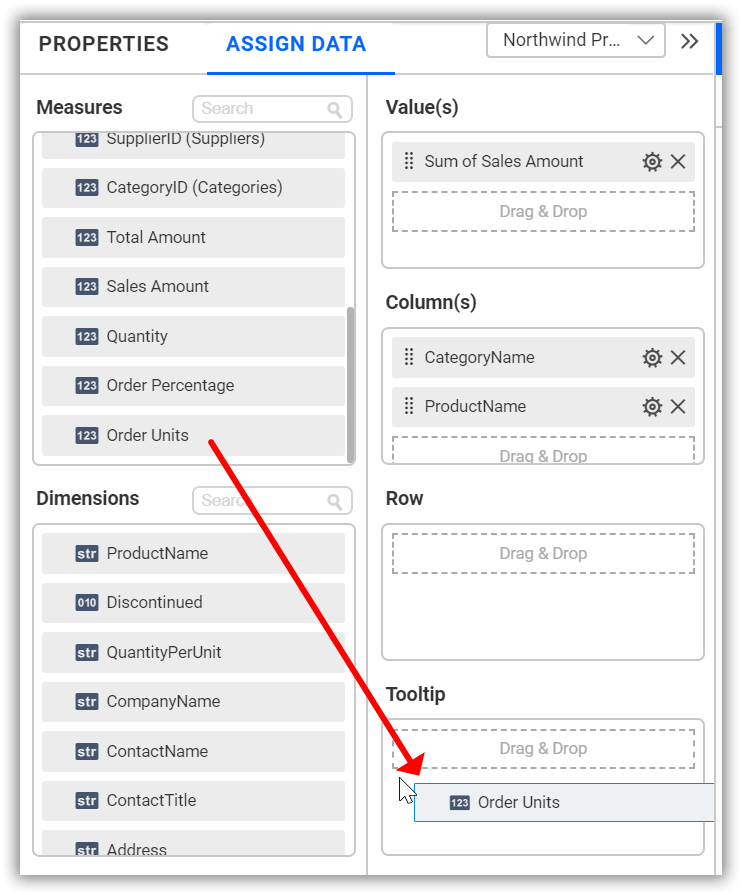
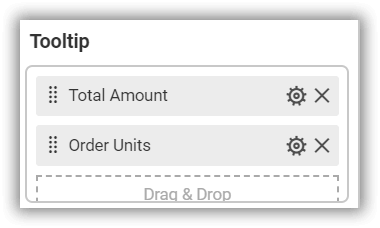
 5. Drag the fields you want to show as additional information in the widget’s tooltip to the
 Tooltip section.
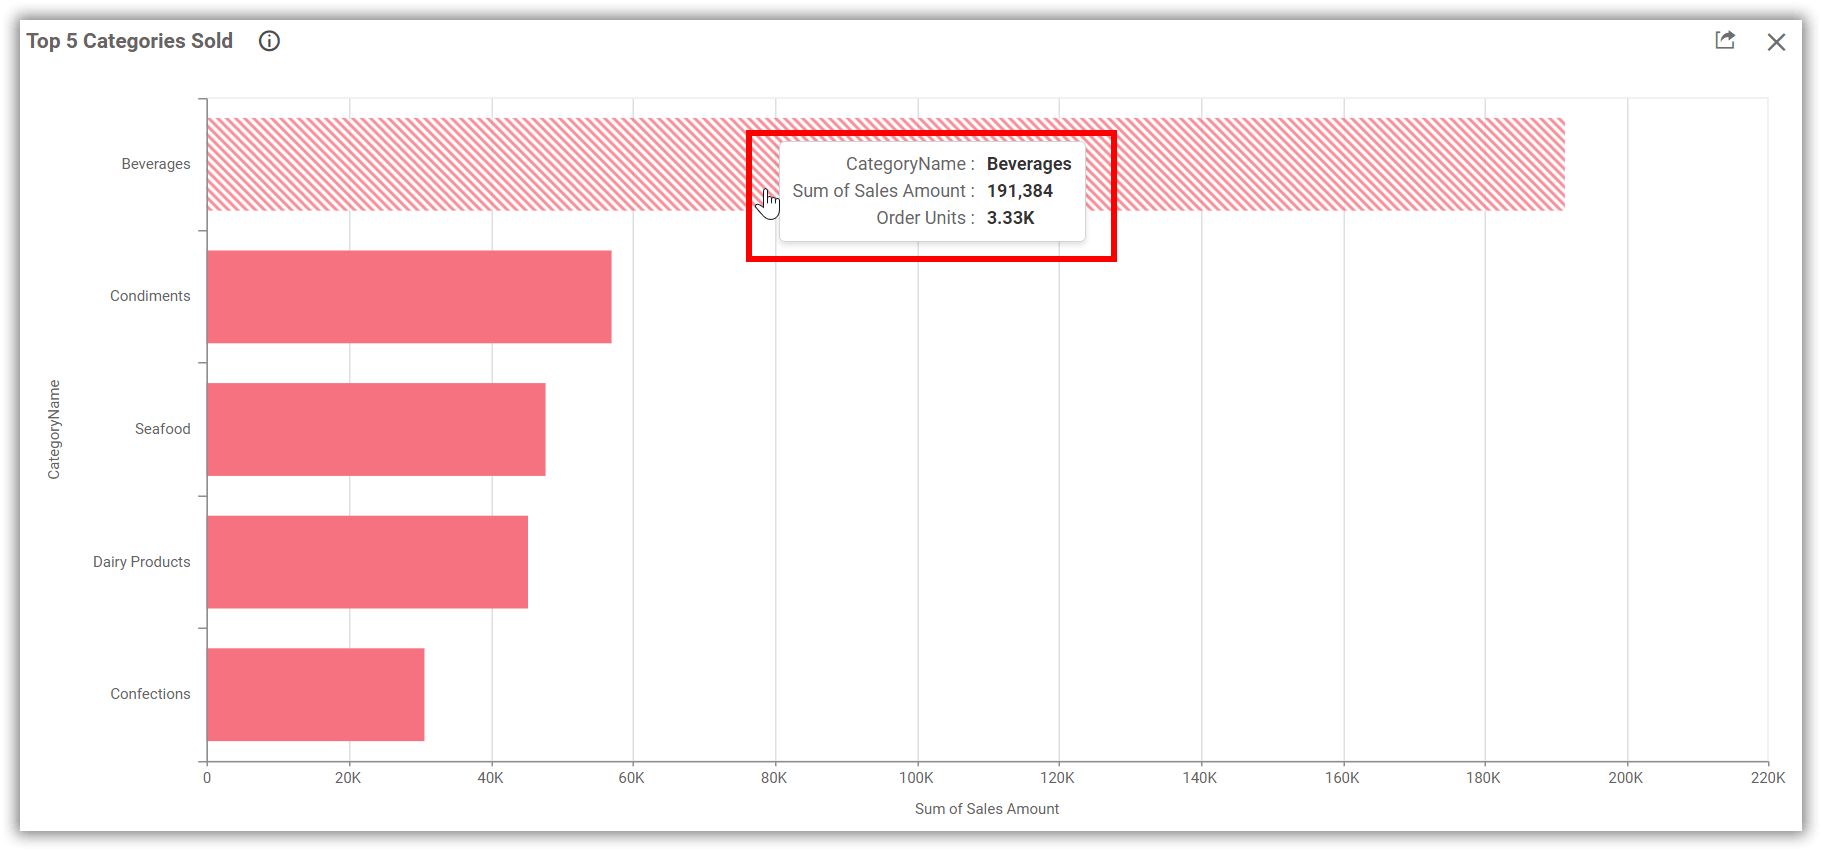
 6. Now, the widget will be rendered and on mouse hover, it will show the additional information as tooltip points for the configured measure.
IMPORTANT:
- Only measure fields are allowed as additional tooltip fields. If a Dimension field is added to the tooltip section, it will only act as a measure field.
- This section is optional. If no additional fields are required, you do not need to add any fields in the tooltip section.
- Tooltip fields do not affect the visualization and values are displayed only in the tooltip points.
- You can add any number of tooltip fields as needed.
- All types of charts, Choropleth Map, Bubble Map, Map, Tree map, and Heat map support tooltip fields.
- Tooltip fields are currently not supported in Radial Gauge, Grid, Pivot Grid, Image, Label, and filter widgets.
How to format the tooltip values
You can customize the tooltip field name and the format of the displayed data value.
Rename option
By using the Rename option provided in the settings menu, you can rename the tooltip field name.
To rename the tooltip field, follow these steps:
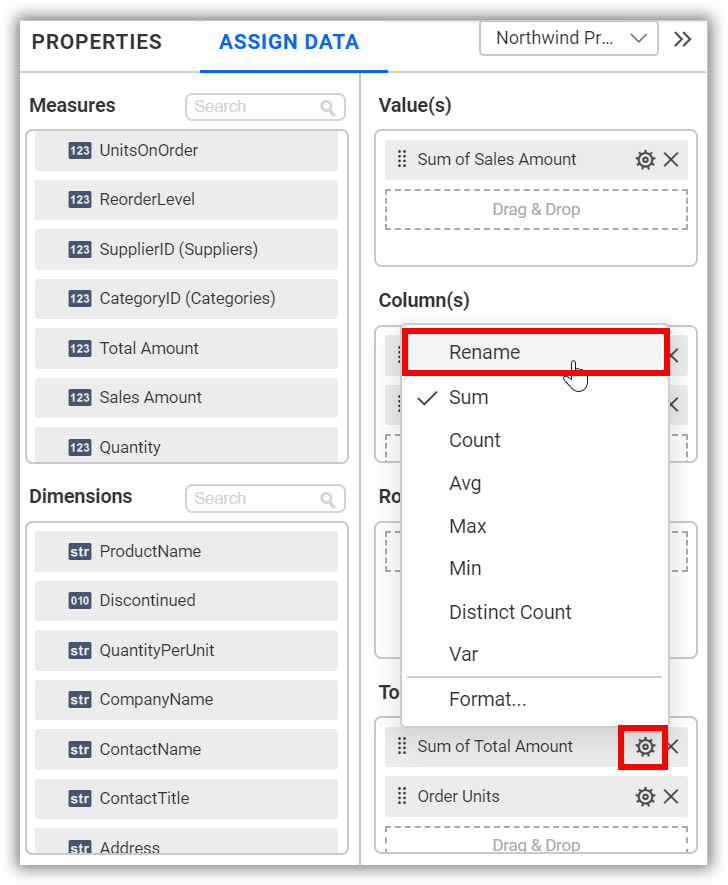
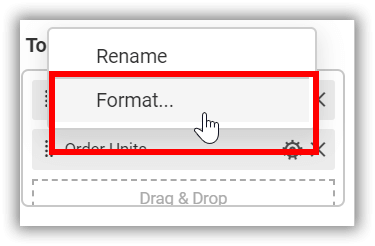
- Click on the
Settingsmenu and select theRenameoption as shown in the screenshot below. The text will then become editable.
 Now, the text will become editable.
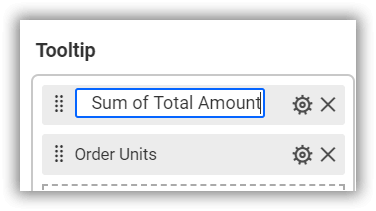 2. Enter the desired text and press
 Enter to save the changes.
Widget tooltip after modifying the field name.
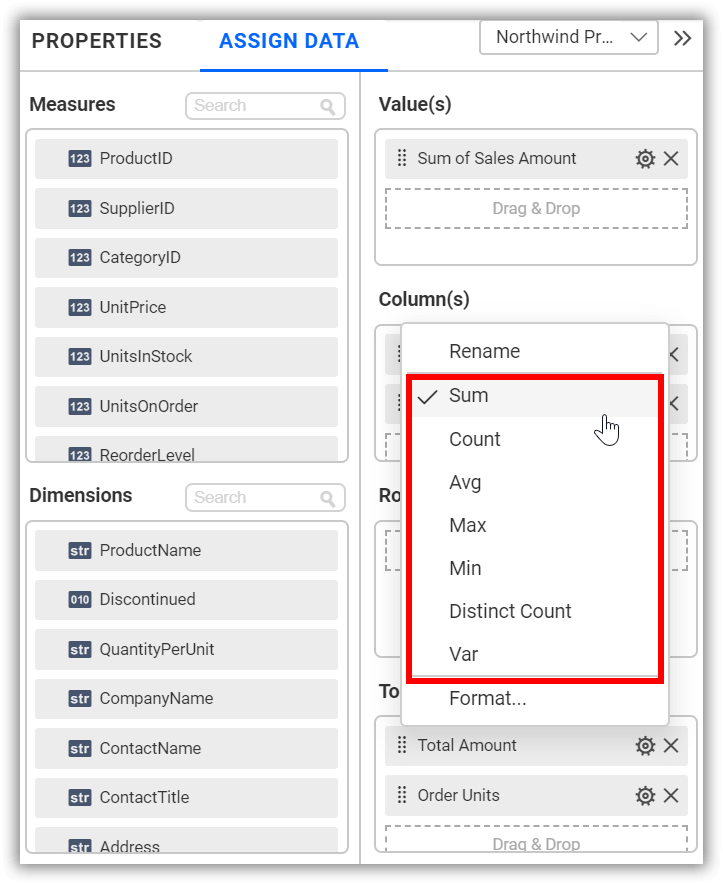
Changing the aggregation type
You can adjust the summary type of the measure field from the settings menu and refer to this section for more details on aggregation types.
Changing the first or last value of the dimension field
You can choose the First or Last option from the settings menu as shown below. This option will be available for the dimension or date field.
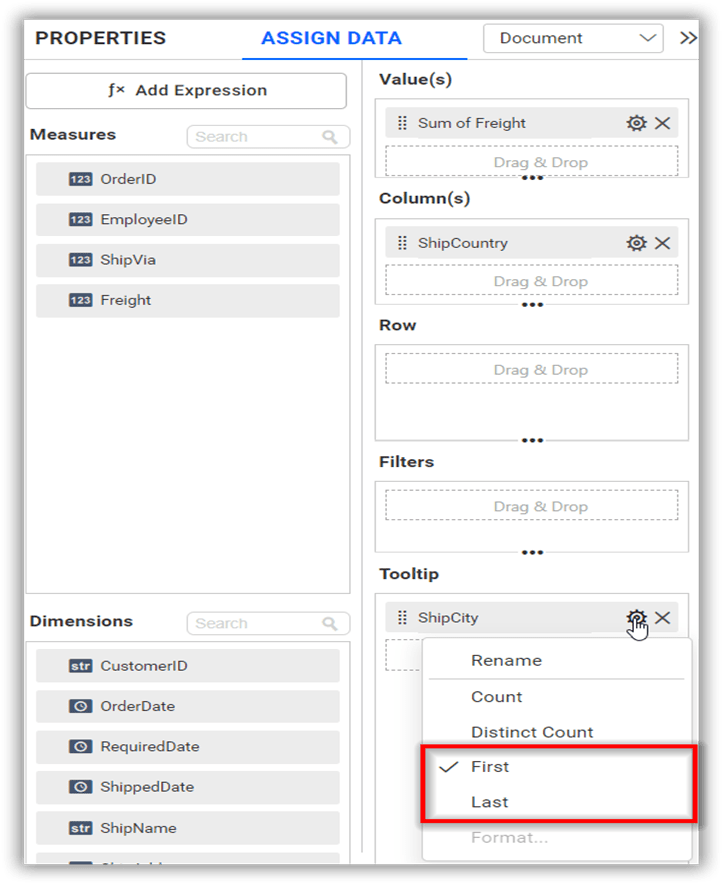
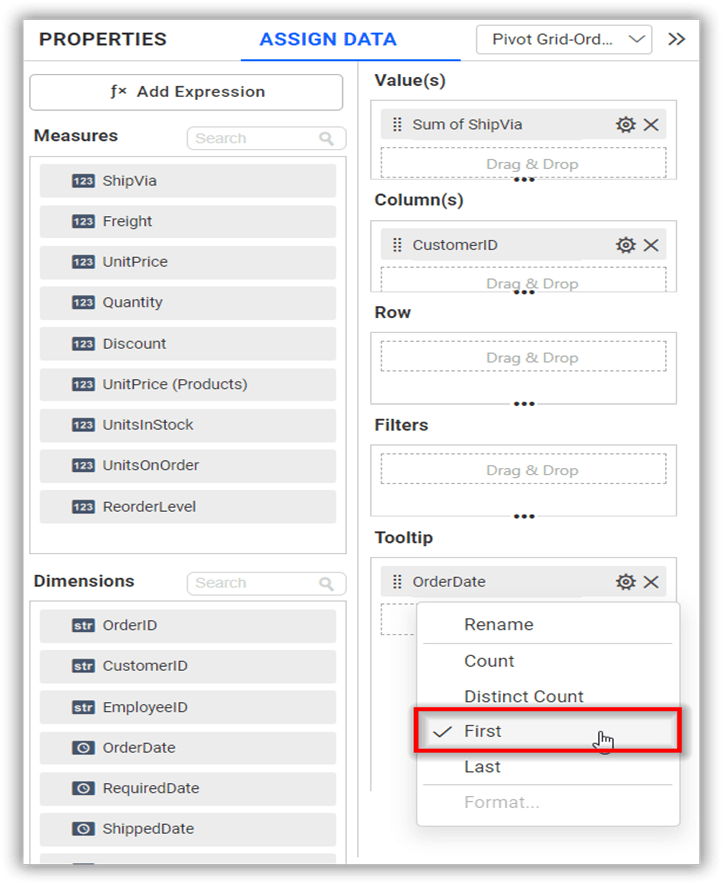
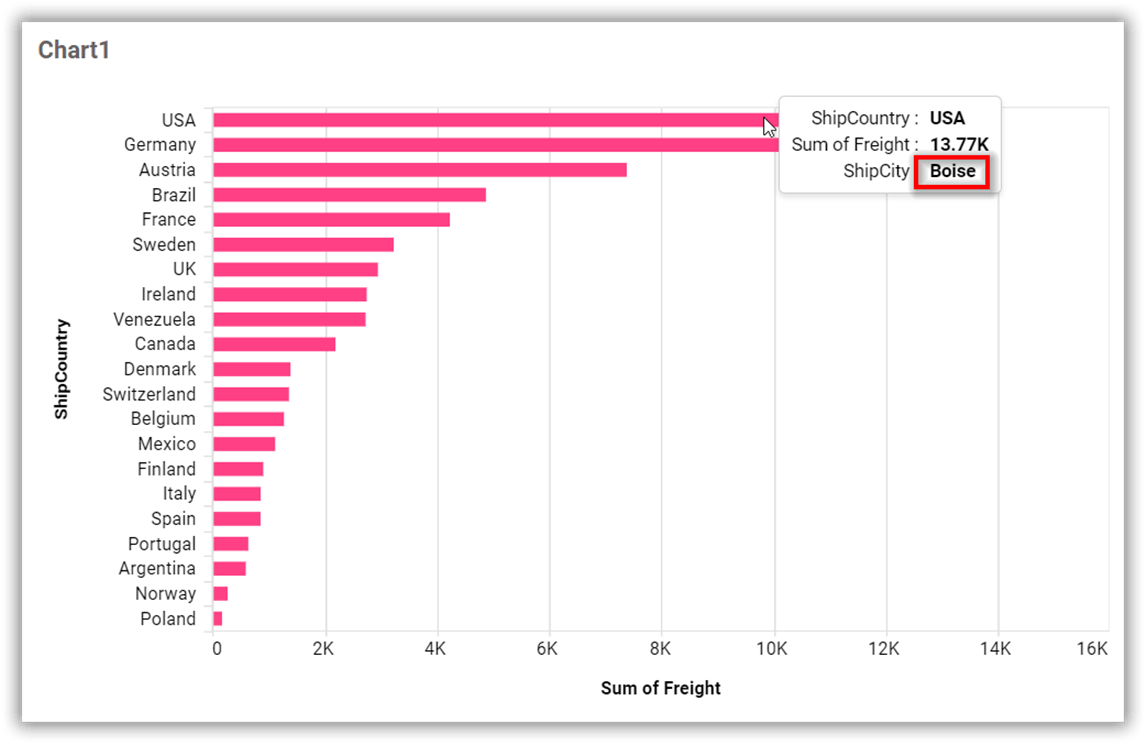
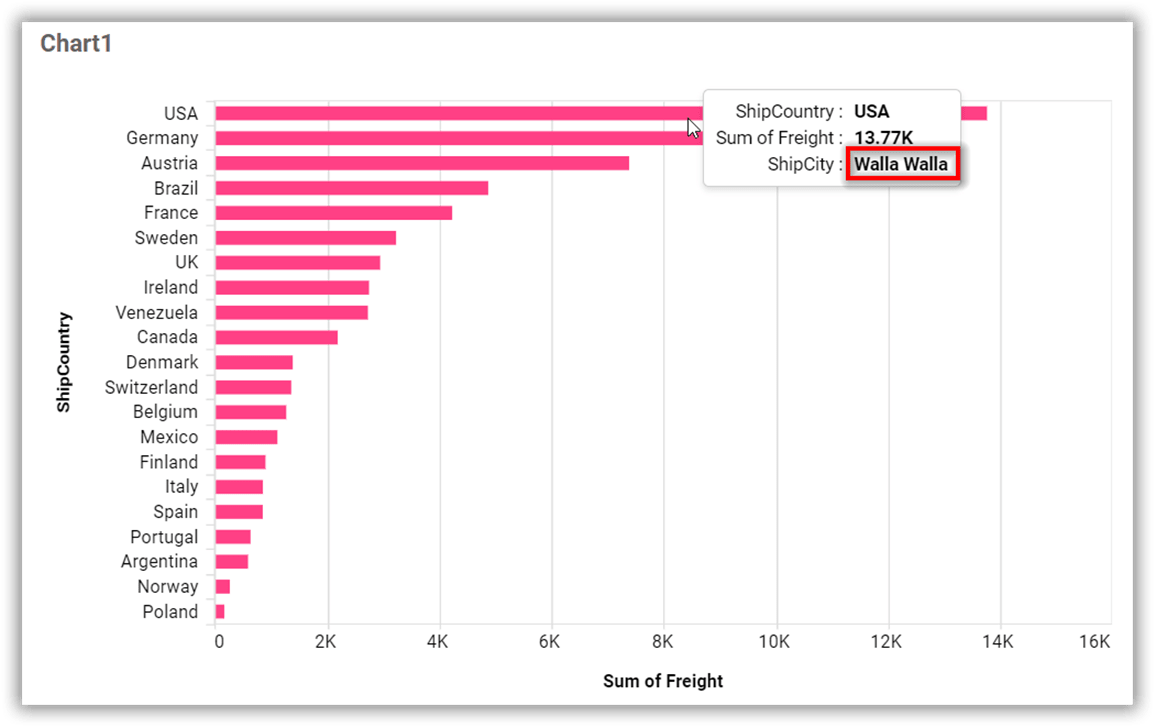
When the First option is chosen, the top value of the dimension or date field can be obtained based on the measure column configured in the Value(s) section, and the tooltip value will be displayed as shown in the screenshots below.
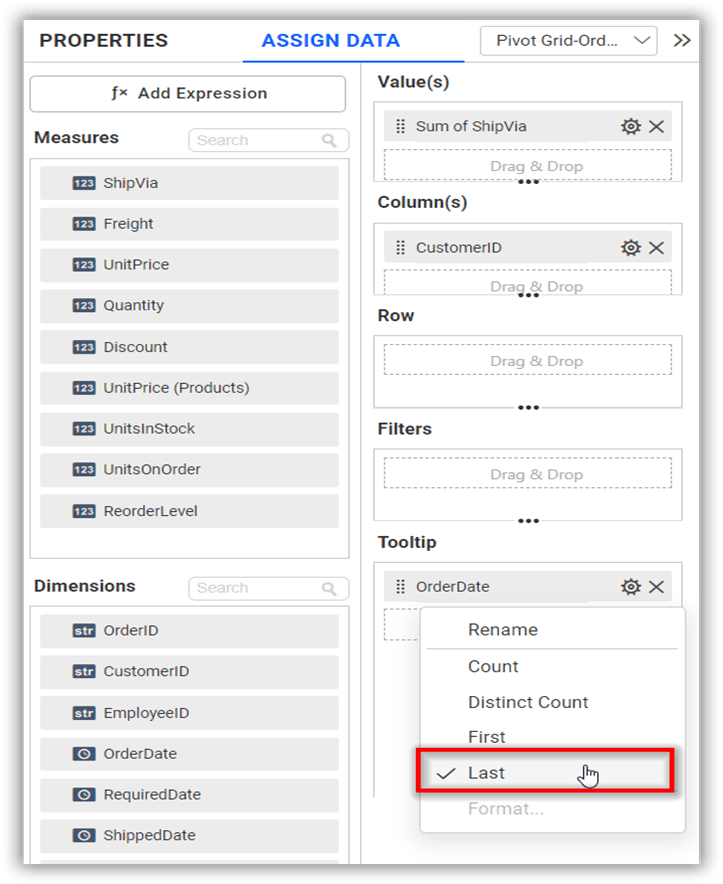
When the Last option is selected, the last value of the dimension or date field can be obtained based on the measure column configured in the Value(s) section, and the tooltip value will be displayed as shown in the screenshots below.
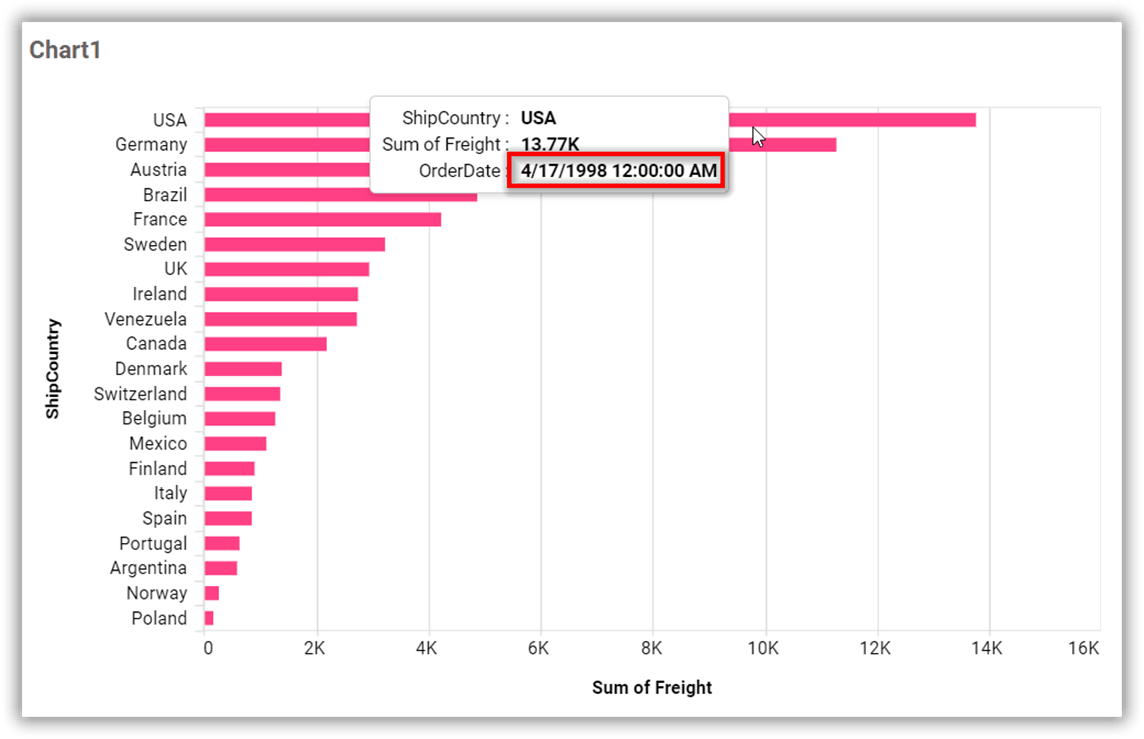
For a date column, the First or Last value will be displayed in date time format as shown in the screenshot below.
Measure formatting
The measure value can be formatted by selecting the Format option from the settings menu.
Refer to this section for more details on formatting.
Screenshot of the widget with applied measure formatting.