View Underlying Data
The View Underlying Data feature allows users to access detailed data linked to a widget and specific sections within the view data grid. This functionality enhances data transparency, providing deeper insights into the information behind visual representations and facilitating more informed decision-making.
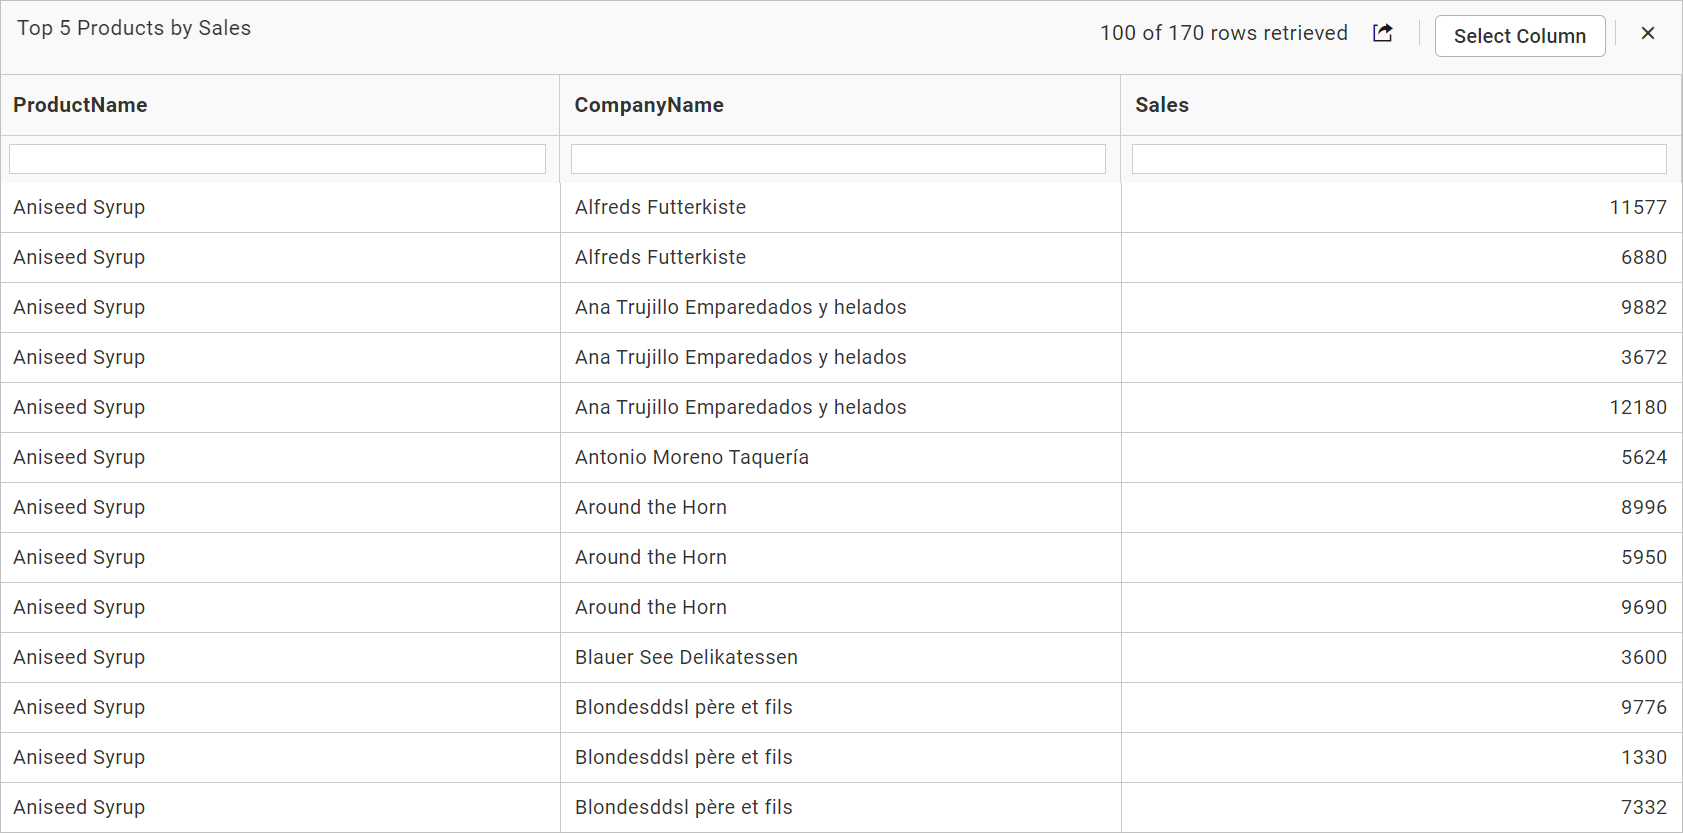
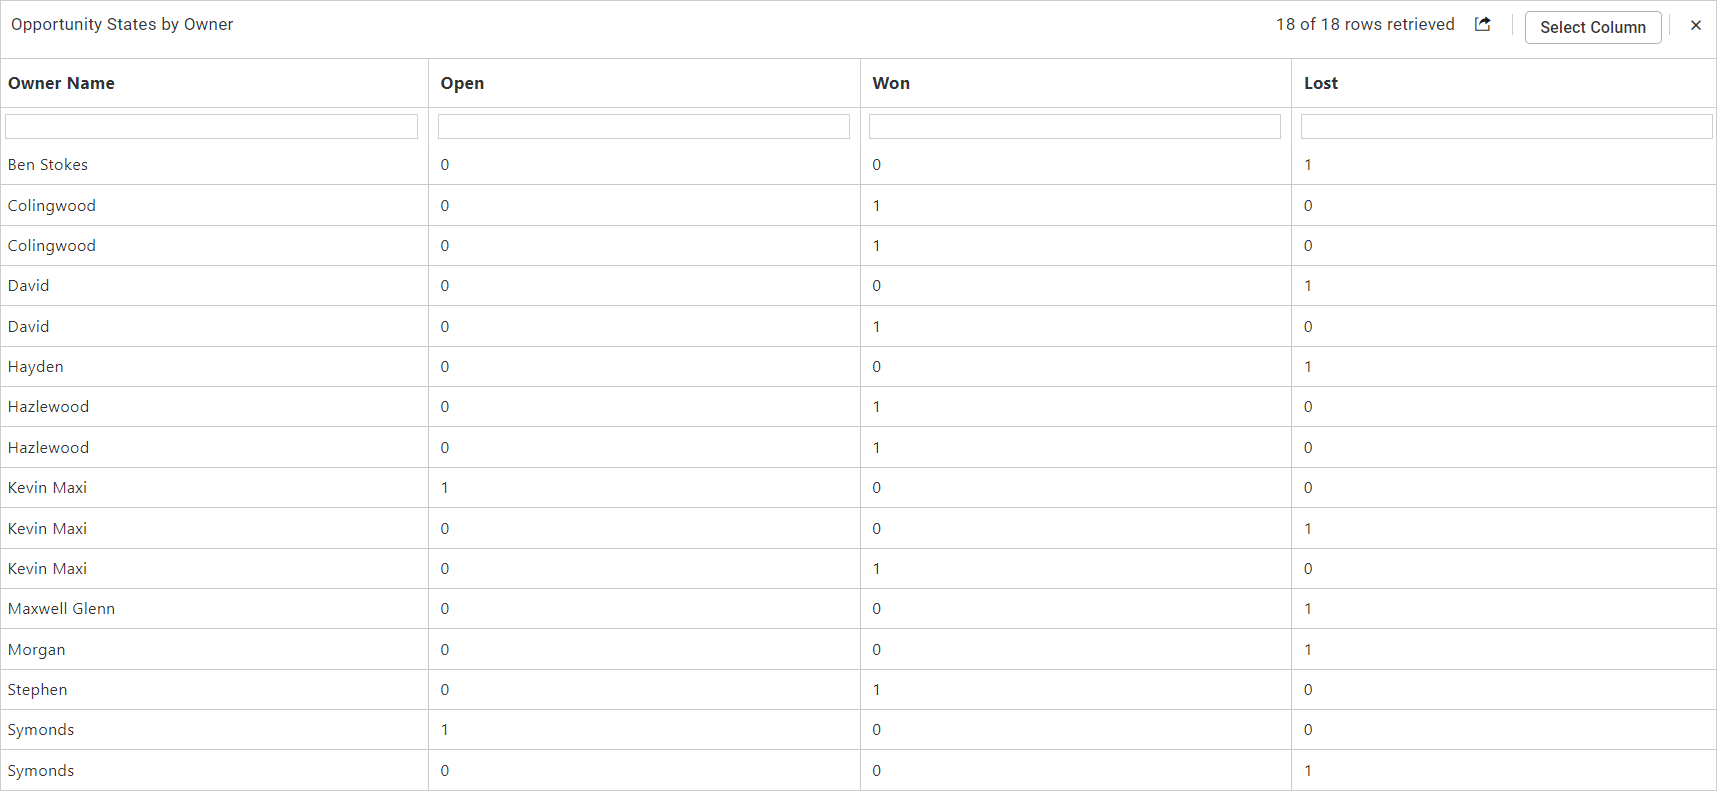
The figure below illustrates the view data grid for the selected widget.
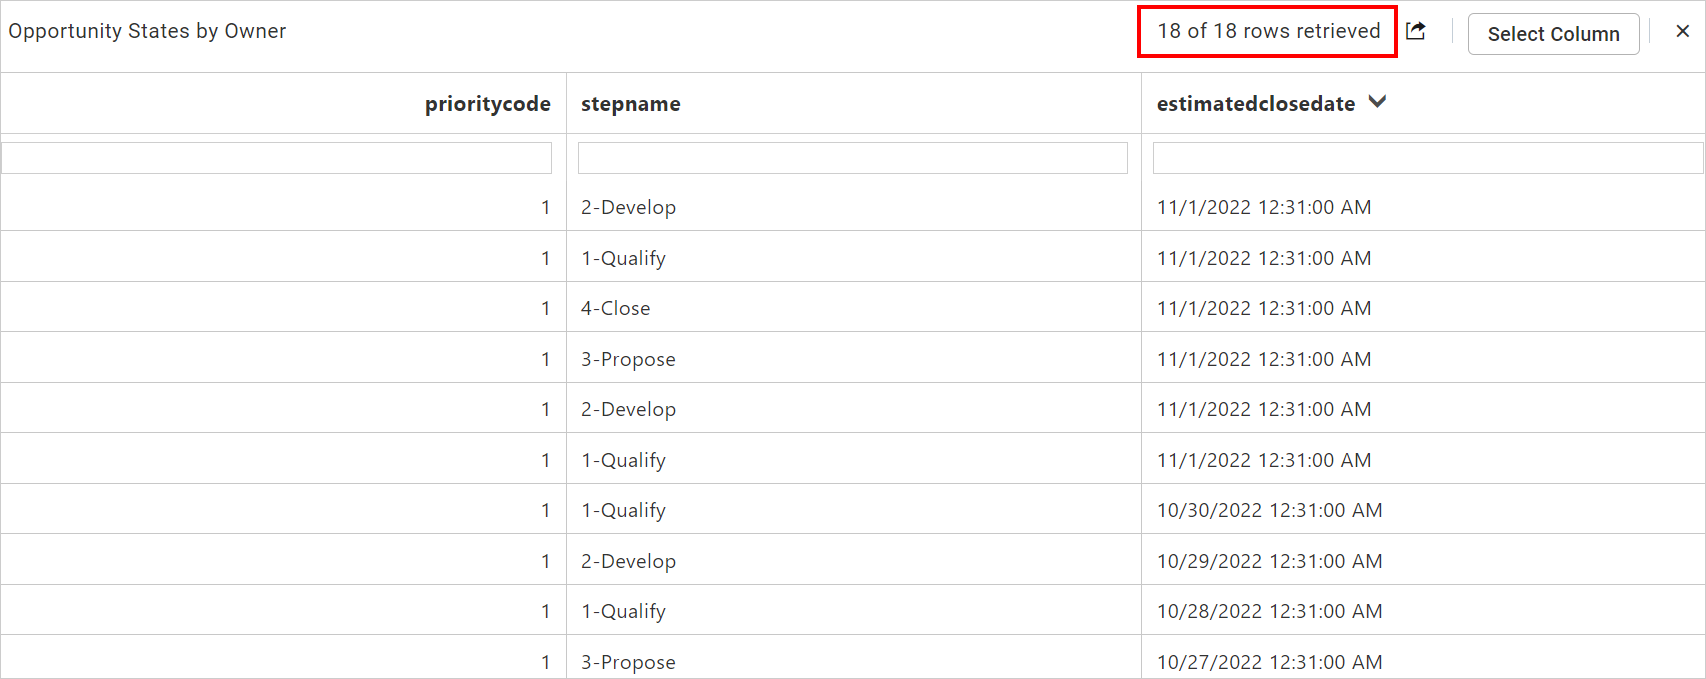
The count of fetched records out of the total records will be displayed in the popup, as shown below.
Let’s explore the features of the View Underlying Data option.
Enable
This option allows you to enable or disable the View Underlying Data feature.
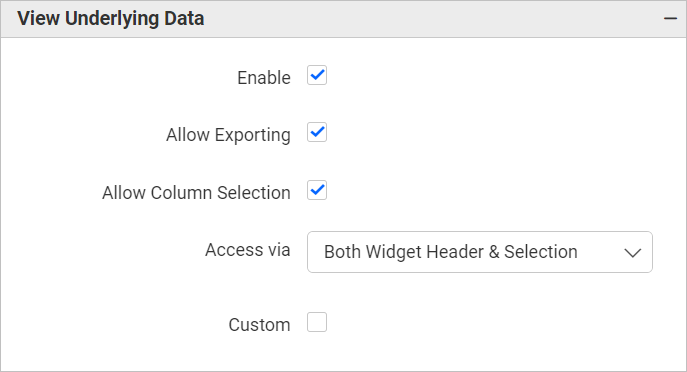
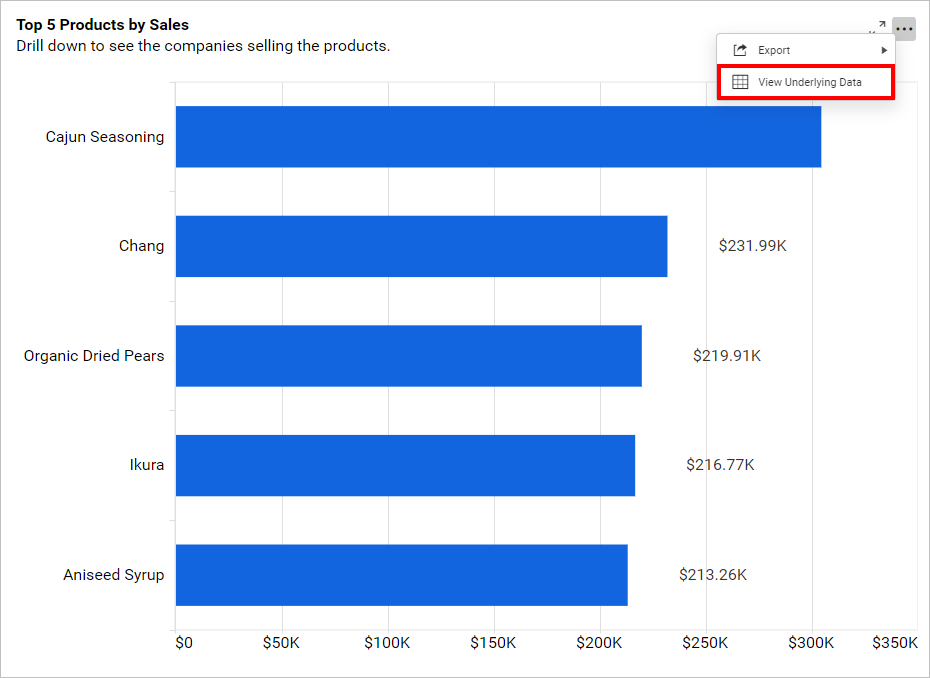
By selecting the Enable option under the View Underlying Data section in the property panel, you can access the View Underlying Data menu, as illustrated in the following image.

Allow Exporting
This option allows you to enable or disable the export feature in the View Underlying Data.
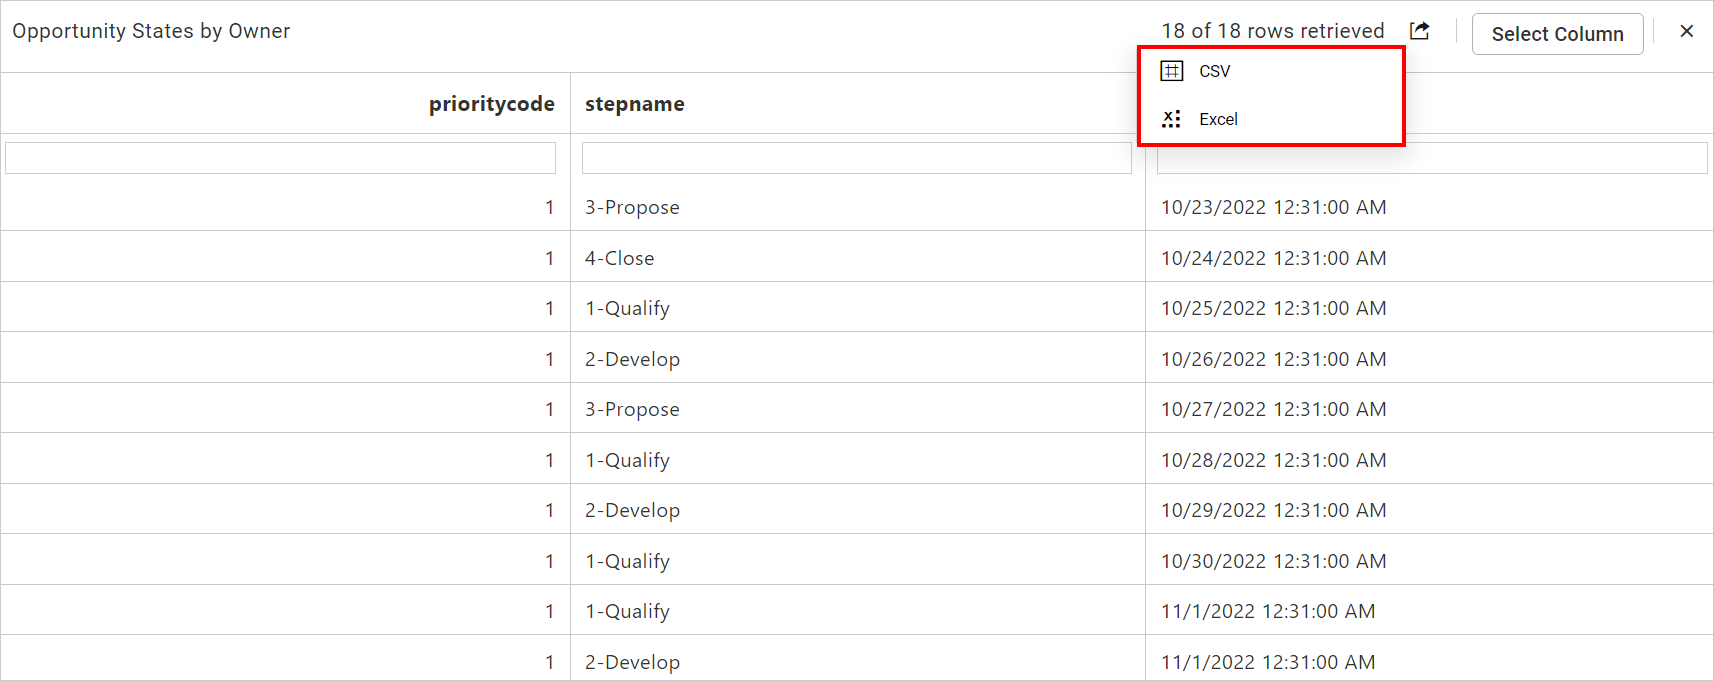
You can export the selected column values or all column values into a CSV or Excel file by clicking the Export option.
Allow Column Selection
This option allows you to enable or disable the Select Column feature in the View Underlying Data.
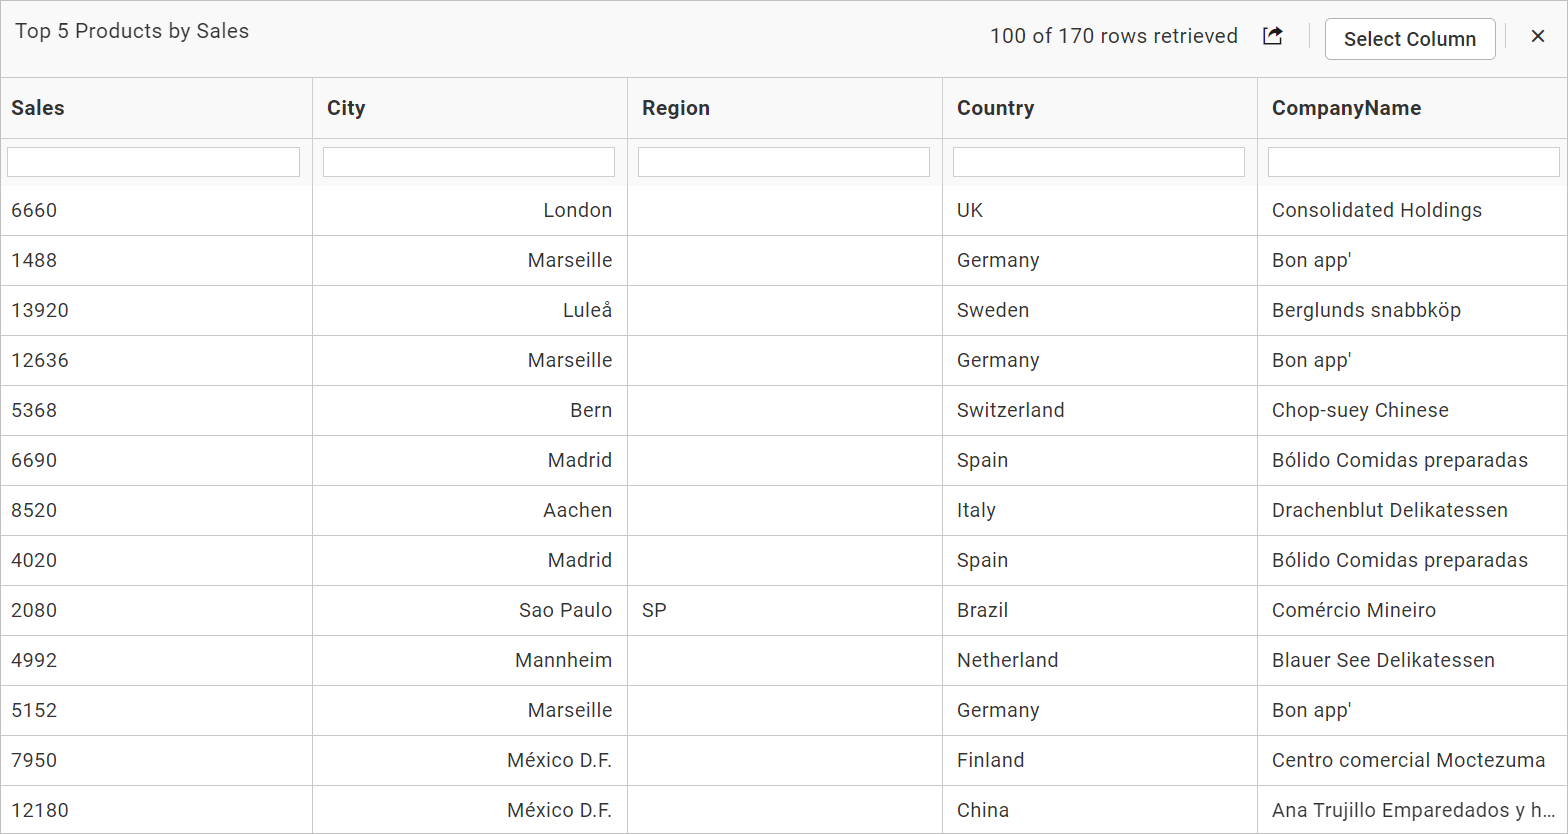
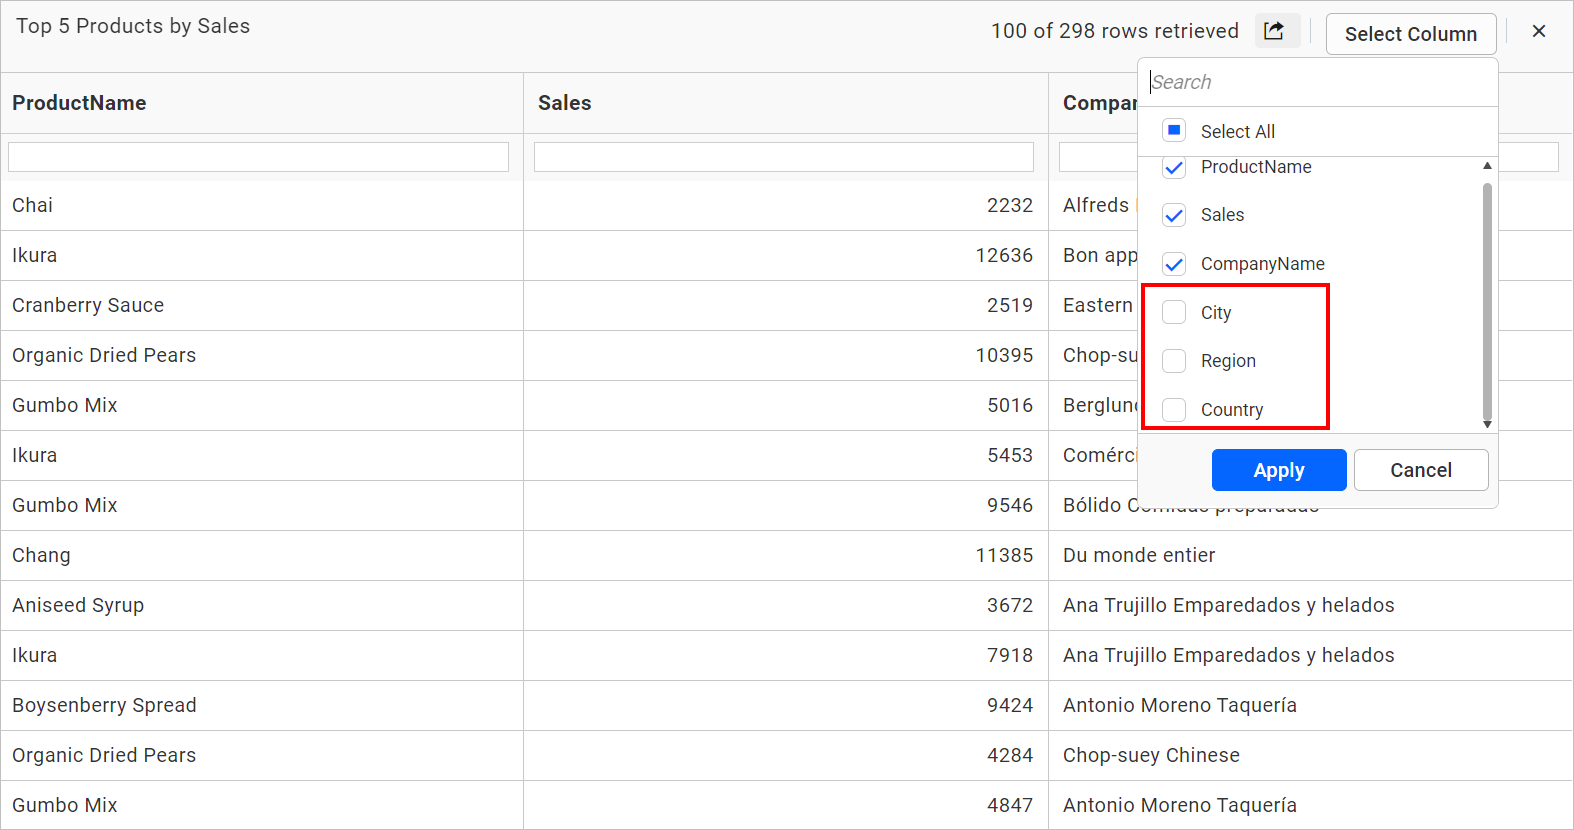
By default, the columns configured with the widget will be displayed in the data view grid. The Select Column button can be found at the top right corner of the dialog.
When you click the Select Column button, a list box containing the columns from the configured data source will be displayed in the widgets.
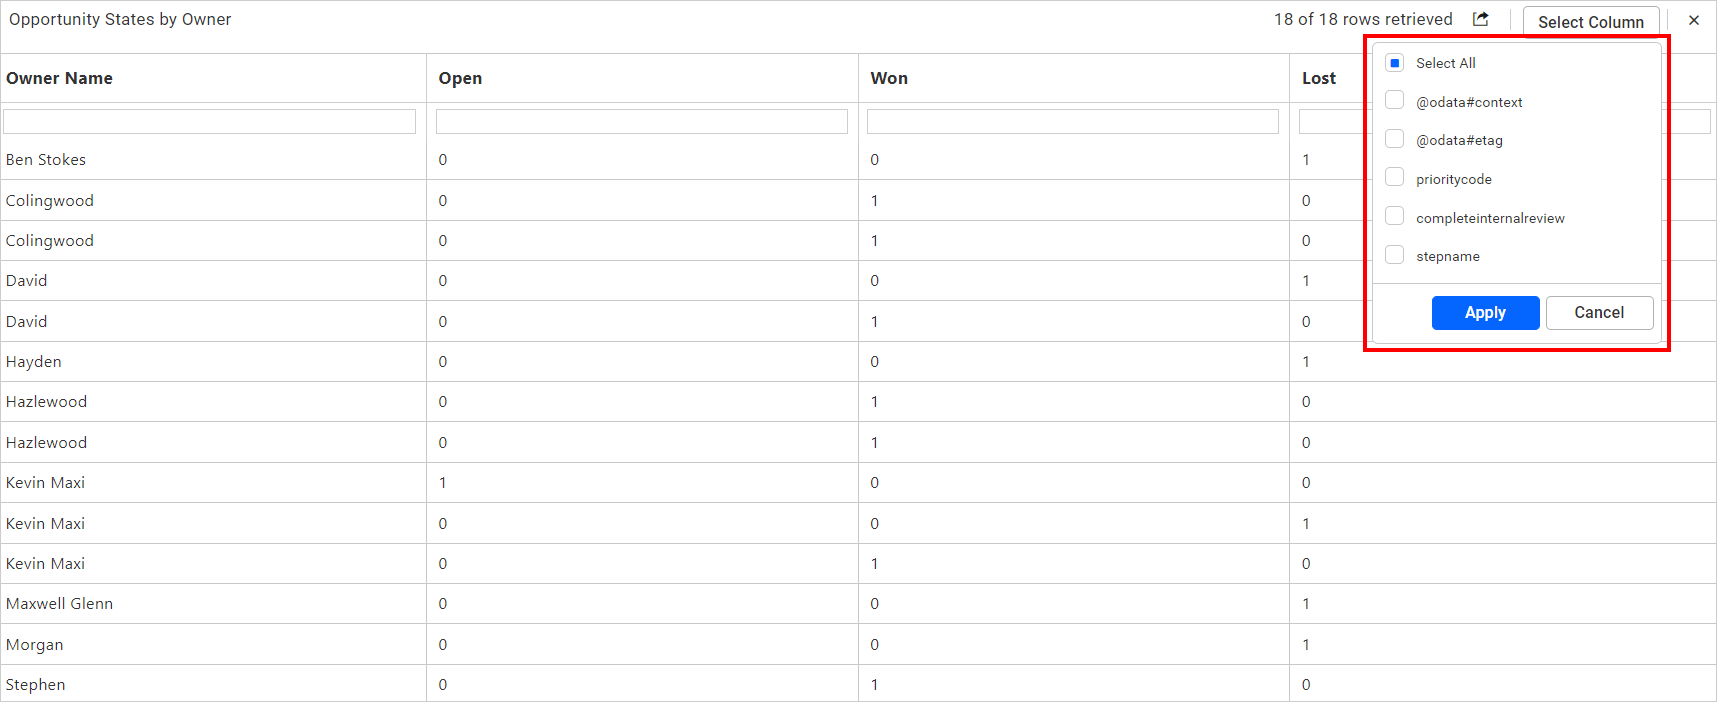
You can select one or more specific columns from the list box, and then click the Apply button.

The values of the selected columns will be displayed in the data grid once you click the Apply button.
By selecting the Select All option, you can display all column values in the data source.

Note: By default, the
Enable,Allow Exporting, andAllow Column Selectionoptions will be enabled in theView Underlying Datasection in the properties panel.
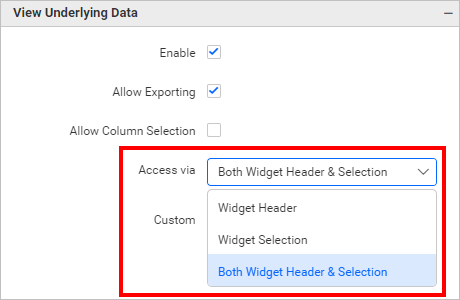
Access Via
This option allows you to access the widget view data through the widget header, the widget selection, or both the widget header and selection.
Widget Header
This option allows you to find the View Underlying Data option in the widget header menu, which will display all column data associated with the widget.
Widget Selection
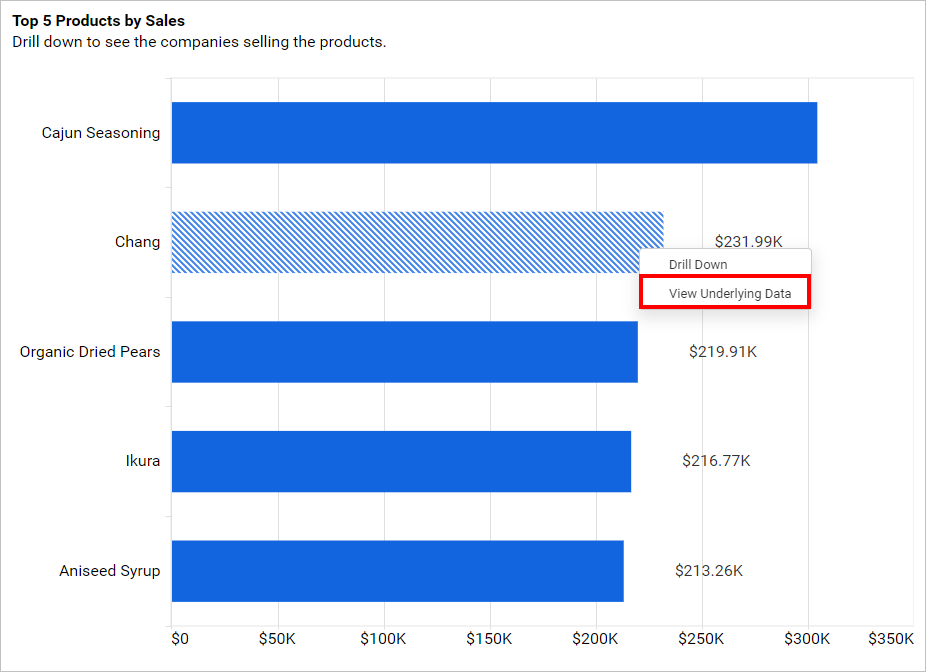
This option allows you to open the View Underlying Data with specific selected data.
Both Widget Header and Selection
This allows you to view both all data bound to the widget and the data associated with the specific widget selection.
Custom
This option allows you to manage the list of columns in the data grid and the fields in the selected column list within the View Underlying Data.
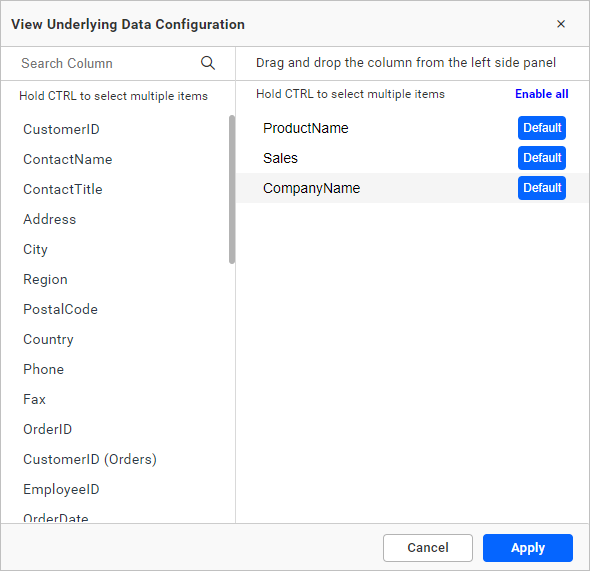
By enabling the Custom option or clicking the Configure button, the View Underlying Data Configuration dialog will appear. In this dialog, the fields that are bound to the widget are displayed on the right side by default, while those on the left side represent the unbound data from the data source, as shown in the figure.
You can customize the columns in the data grid view by dragging fields between the left and right list boxes. To add more columns, simply move the desired field from the left list box to the right list box, or use the Add or Add Items button. To remove fields from the data grid view, you have two options:
-
Drag the specified field from the right section back to the left list box to remove it completely.
-
Disable the default button. The field will still be available in the select column list for future use, making it easy to select and view when needed.
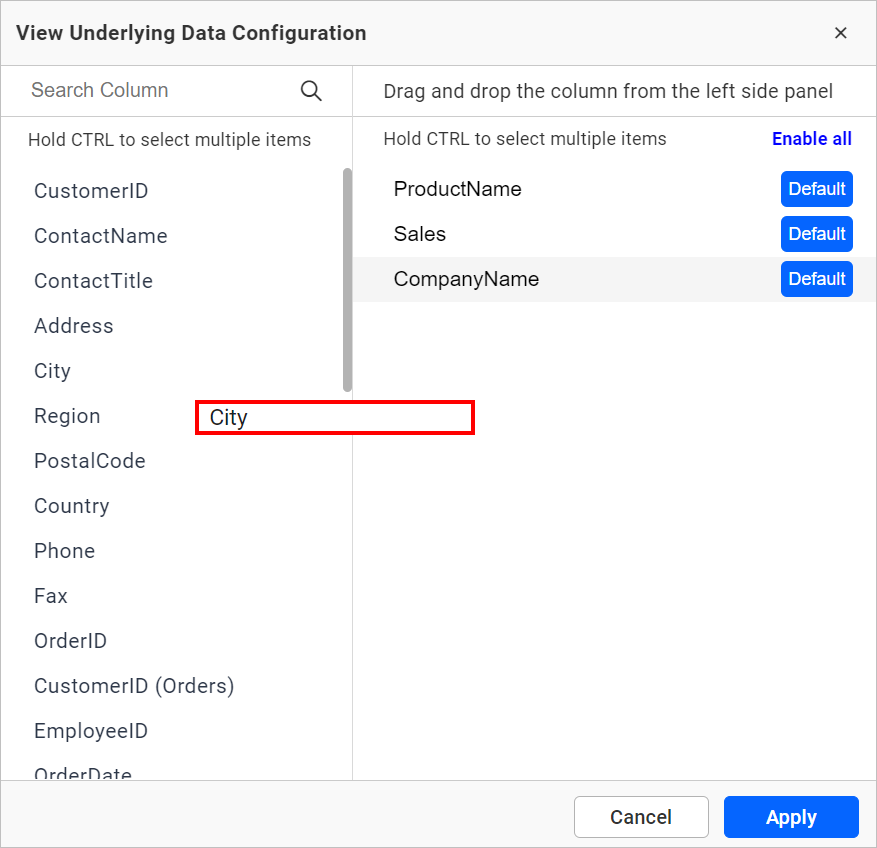
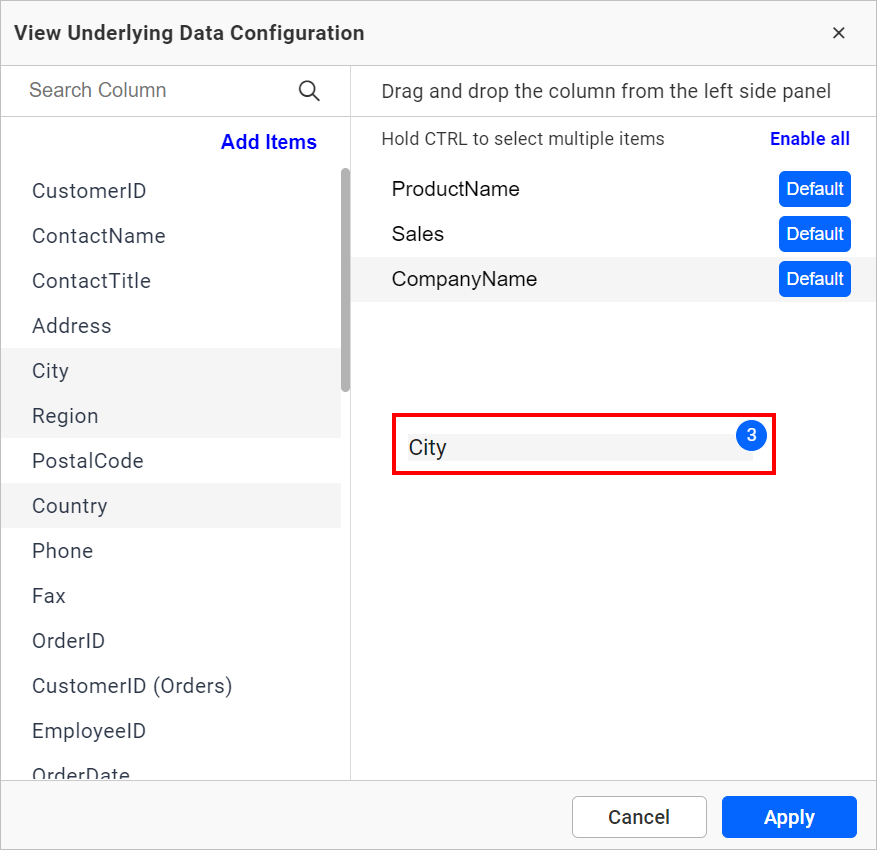
You can select multiple fields at once by holding down the CTRL key and moving them to the right side, as shown below.
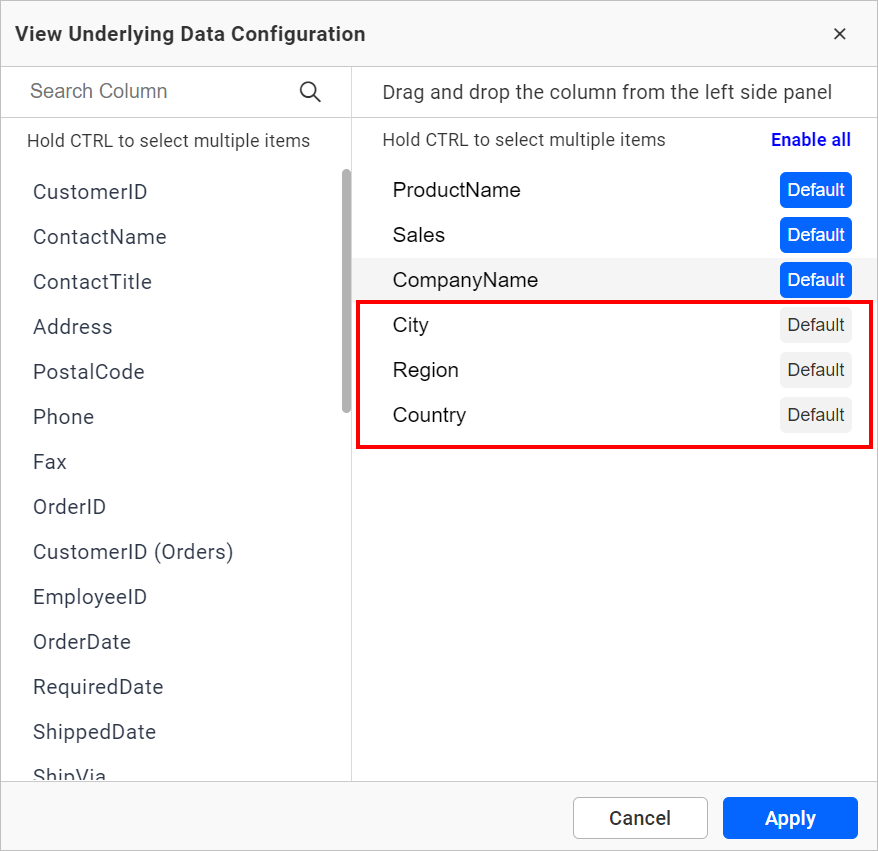
If the Default option is enabled, the columns will be displayed by default in the data grid view. Other columns will not appear in the data grid view but will still be available under the Select Column option, as shown below.
Having trouble getting help?
Contact SupportHaving trouble getting help?
Contact Support