Dashboard Performance Metrics
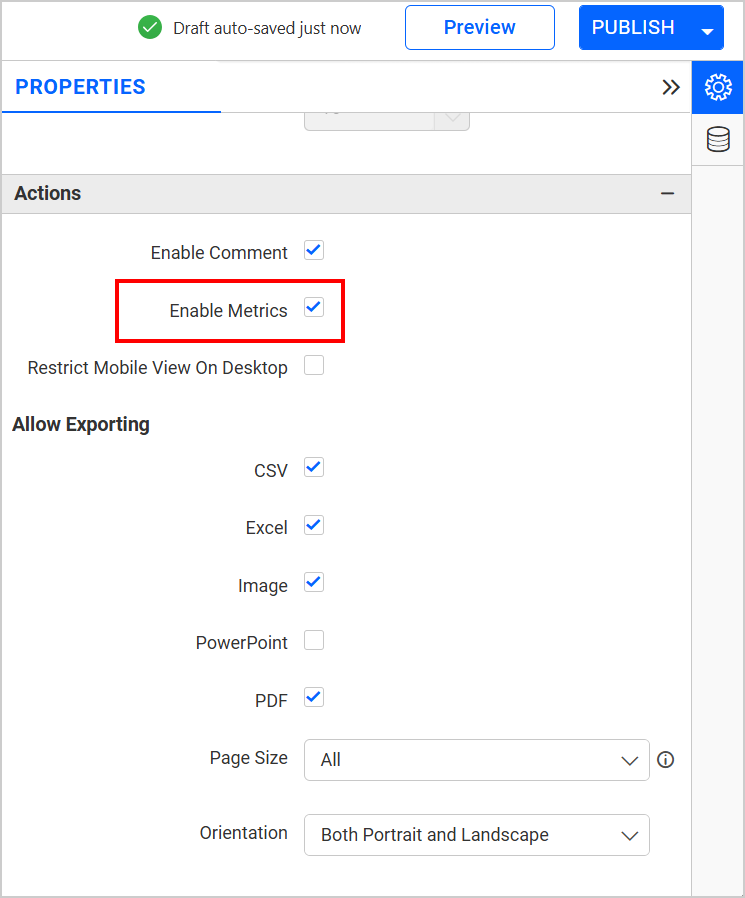
The Dashboard allows you to enable or disable specific dashboard metrics options in the dashboard properties section. By default, metrics options is enabled.
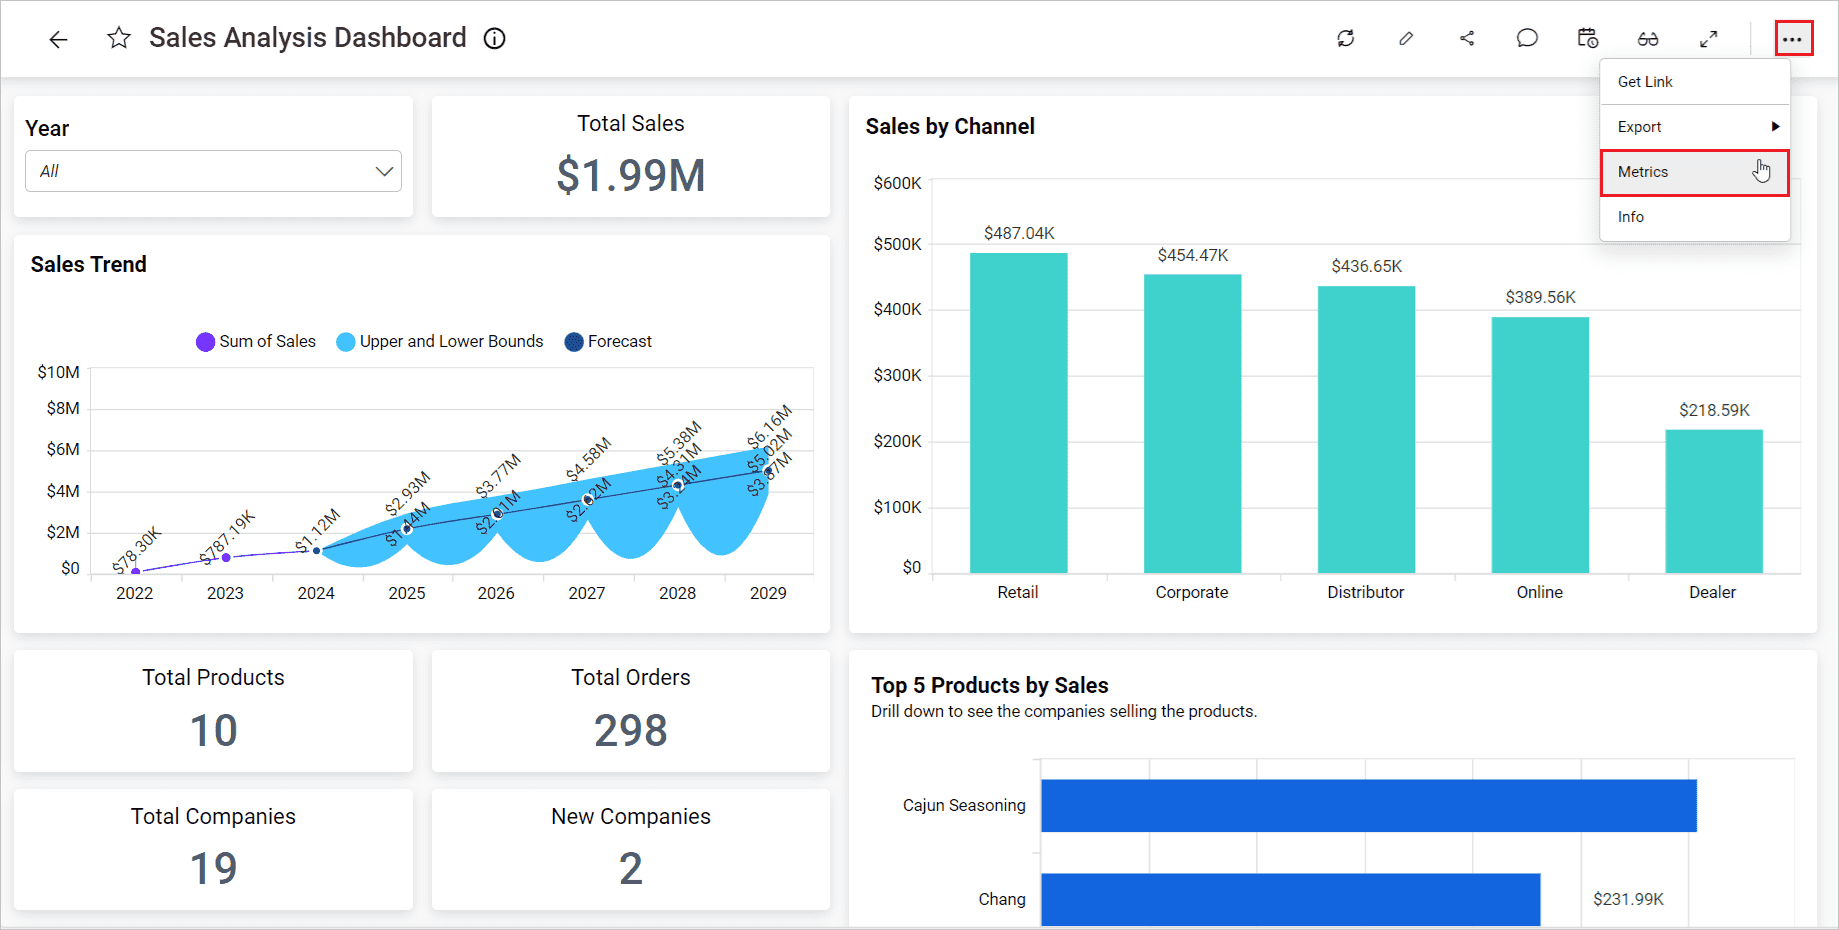
The Dashboard Performance Metrics pop-up allows you to view detailed performance metrics for overall layout rendering and parsing times as well as the processing times for individual widgets. The Metrics option is available in the drop-down menu located in the upper right corner of the dashboard title section.
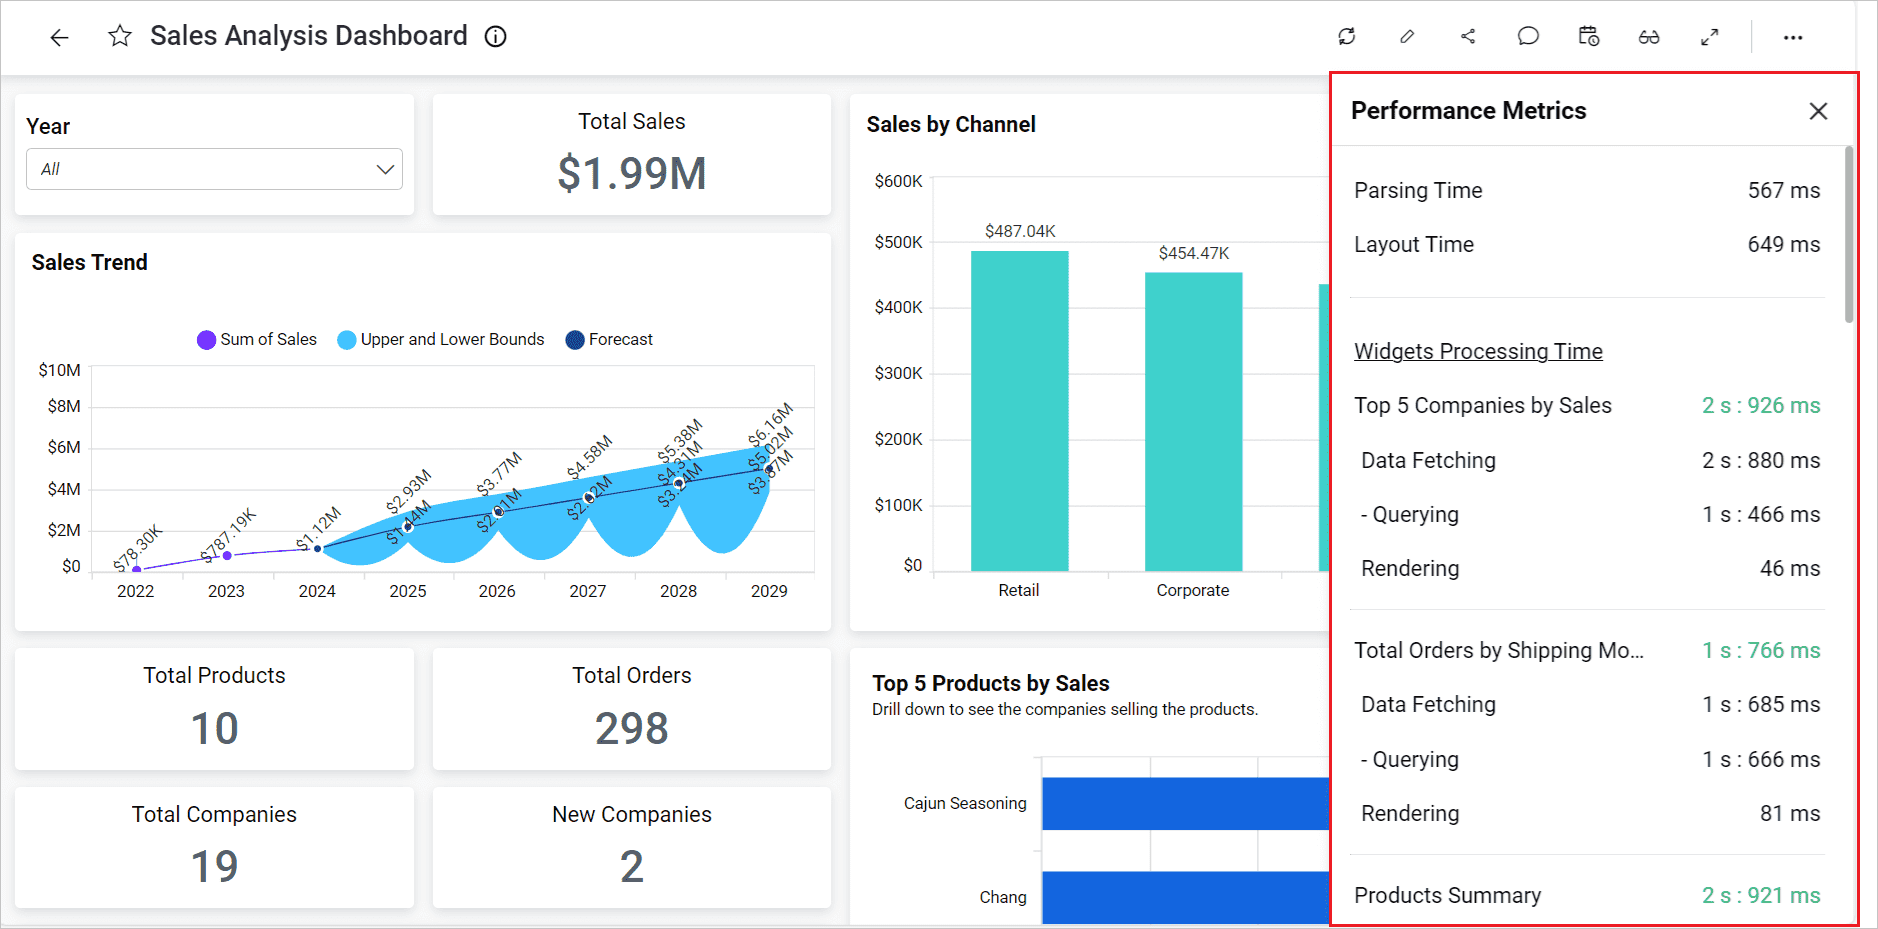
By clicking Metrics option, Performance Metrics pop-up will be displayed as follows.
Mobile View Mode
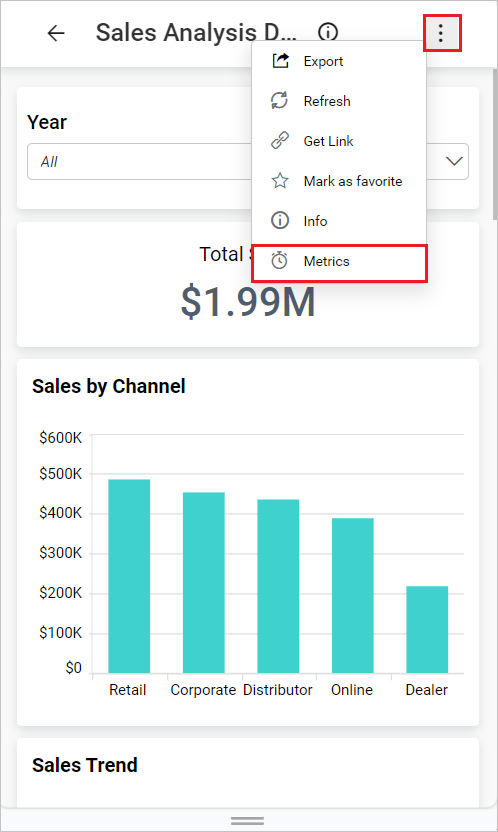
For the mobile view mode, the option is included as shown below.
Performance Metrics Details
Parsing time
Parsing time is measured from the initial load until the successful completion of the load dashboard API method call.
Layout time
Layout time is calculated from the beginning of the layout render action until just before the widget data fetching call action.
Widget Processing Metrics
In this section, you can view the processing time for each widget. The overall widget processing time is calculated as the sum of data fetching and rendering time. The total widget processing time will be displayed alongside the widget name.
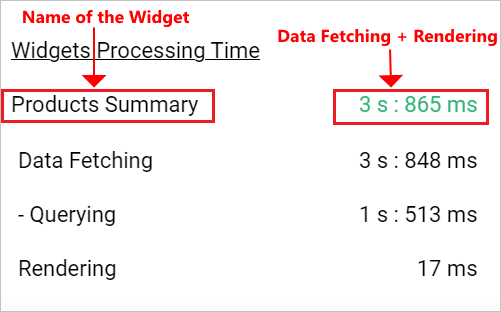
Data Fetching
Data Fetching time includes querying and data processing time of a widget.
Querying
This displays the querying time at the moment of a particular widget’s data fetching.
Rendering
Rendering time is measured from the completion of the data fetching action to the point when the data is bound and displayed in the user interface.
NOTE: The metrics data may vary depending on the data bindings and server responses, and it may also be affected by system performance.
