Allow dashboard exporting options
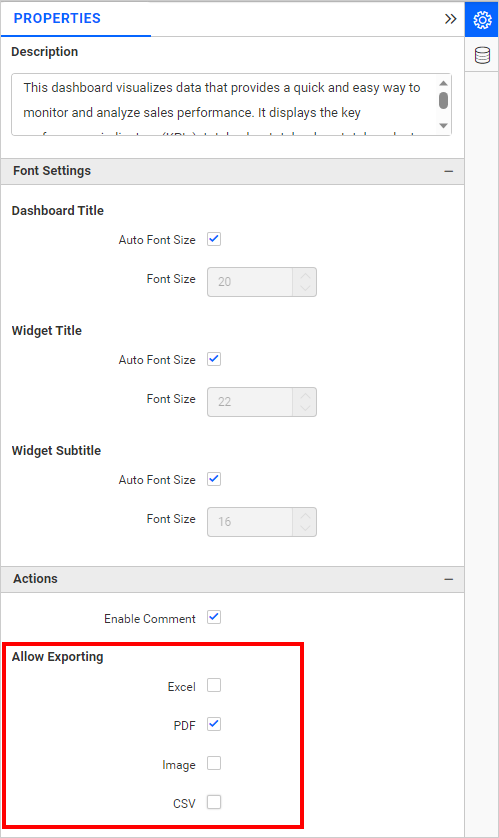
The Dashboard allows you to enable or disable specific dashboard exporting options in the dashboard properties section. By default, all exporting options are enabled.
To disable the export option, go to the Properties tab and disable the specific export options under the Allow Exporting section.
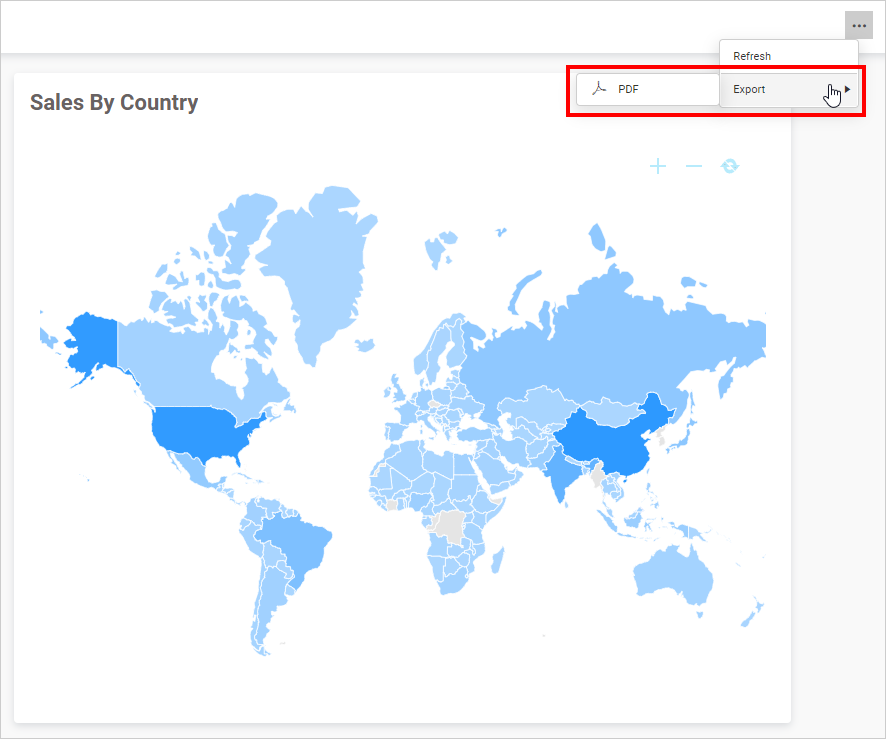
The selected export options can be seen when previewing or viewing the dashboard.
NOTE: Exporting options have been provided in the dashboard properties section for Bold BI version 4.2.68 or later.
Exporting dashboard to Image
Exporting the dashboard to Image can be done by clicking the Export to Image option in the drop-down menu at the right corner of the title section.
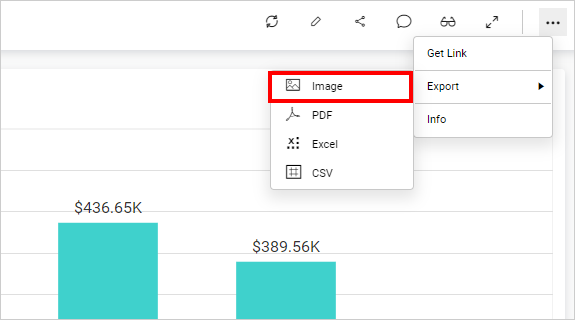
By clicking Export to Image, a pop-up will be shown as follows.

Set the File Name field with the preferred value to replace the default one.
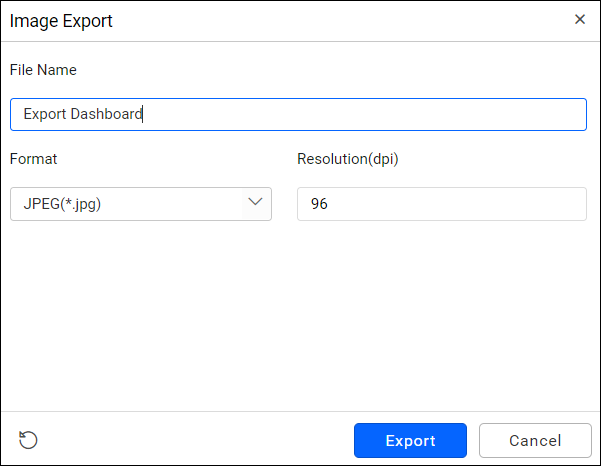
The default and minimum value for Resolution is 96 dpi (dots per inch), with the maximum value allowed to be set at 1790 dpi.
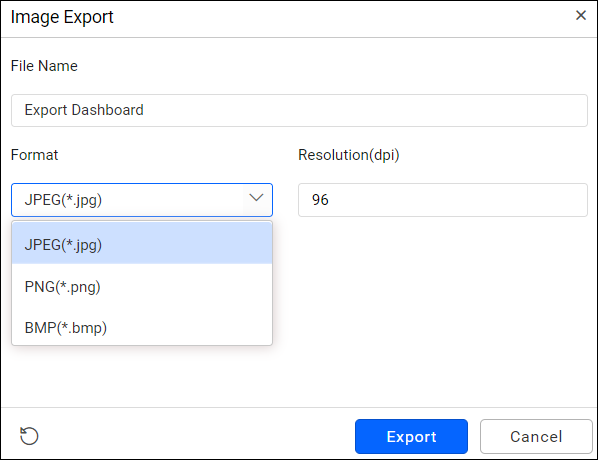
You can choose the image Format as JPEG (.jpg), PNG (.png), or BMP (*.bmp).
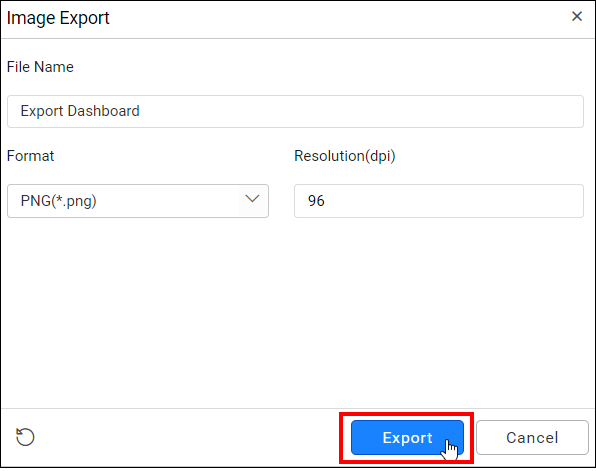
Click Export to display the current view of the dashboard in the chosen image format with applied settings.
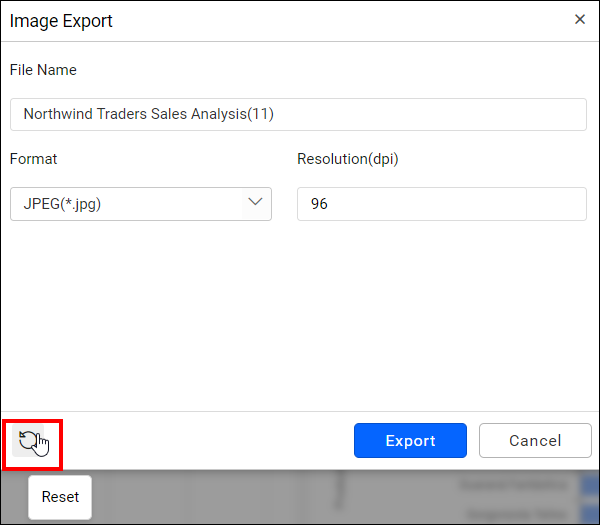
Click Reset to restore the default values in the pop-up.
NOTE: In Windows, the Safari browser does not support the
Export to Imagefunctionality. However, Mac OS or iOS with Safari browser version 6+ do support this functionality.
Exporting dashboard to PDF
You can obtain the data showcased in the dashboard by exporting it as a PDF format. This can be achieved by clicking Export to PDF in the drop-down menu at the right corner of the title section.

By clicking Export to PDF, a pop-up will be shown as follows.

Set the File Name field with a preferred value to replace the default one.

When the include filter information is switched on, the exported PDF file of the dashboard will contain the applied filter information.

Export all widgets on a single page as a PDF
The Dashboard option is selected by default, and all the widgets in the dashboard will be exported as a one-page PDF file.

Export all widgets on a separate page as a PDF
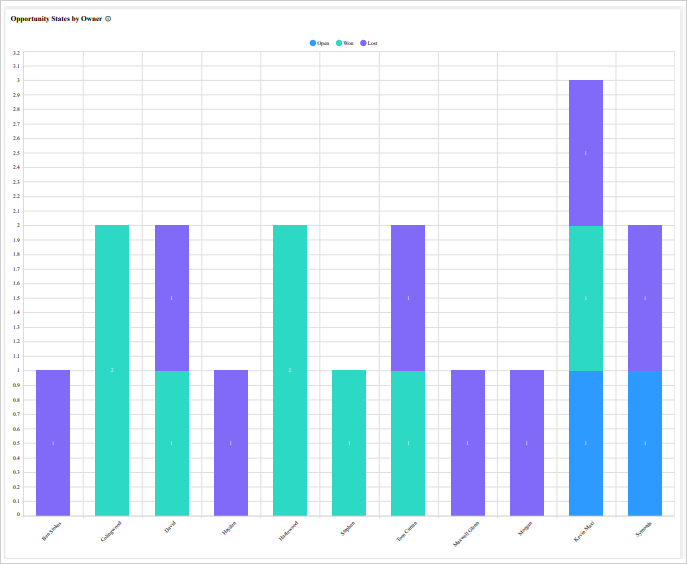
By choosing the Widgets option, the user can export all the widgets present in the dashboard on individual pages as a PDF.

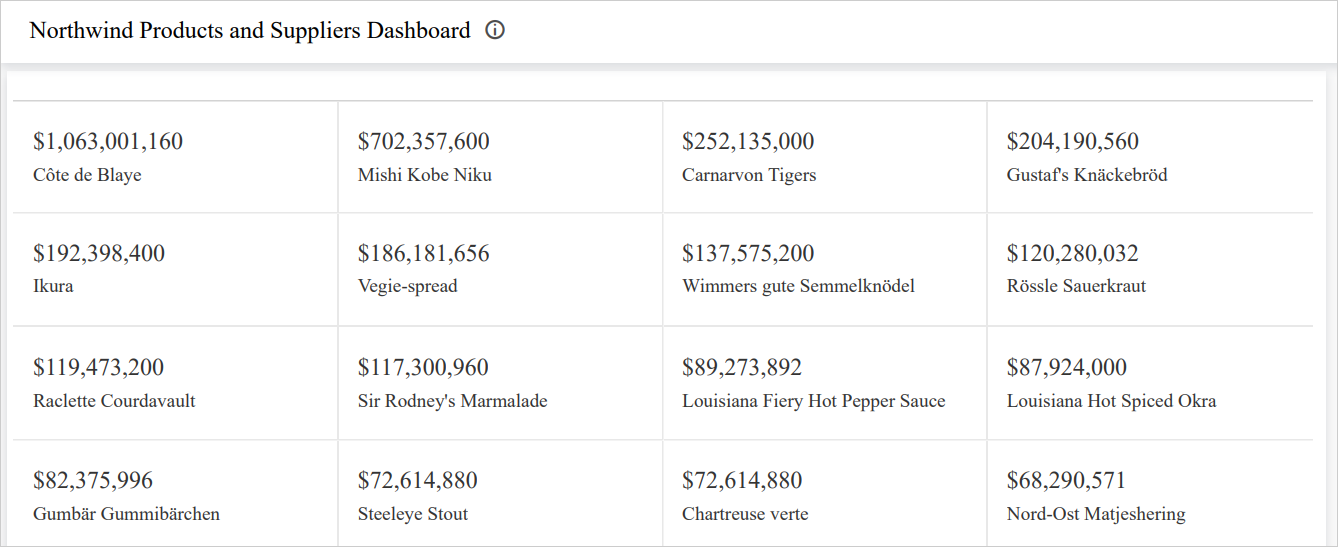
The exported PDF file will look like the one below.
NOTE: If the dashboard has Grid and Card (with series) type widgets, it will export all the records in those widgets.
Export the user selected widgets as PDFs
By choosing the widget option, the dropdown will be displayed on the right side of the popup.

By clicking the dropdown, all widgets in the dashboard will be displayed (excluding Filter Widgets). Users can choose the widgets required and click on Export to export selected widgets in a PDF.

The exported PDF will be downloaded with each widget on an individual page.
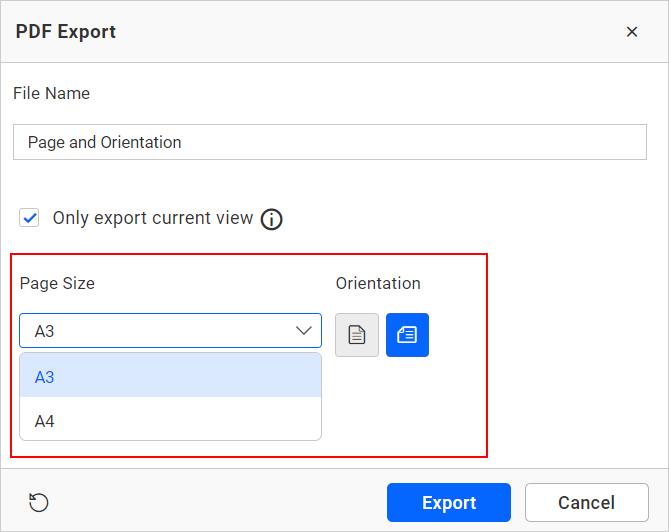
Set the preferred Page Size of the PDF File.

Choose the Orientation of the page as either Portrait or Landscape mode.

By clicking Export, the data in the dashboard will be displayed in PDF file format.

By clicking Reset, the default values will be restored in the pop-up.

Customizing the PDF Page Size and Orientation option in the PDF export
Bold BI dashboards offer a feature that allows users to customize the Page Size and Orientation while exporting a PDF file through the PDF export options to meet their specific needs. This customization can be done directly from the design mode of the dashboard. The customized design mode settings will be reflected in the dashboard viewer when exporting a dashboard or individual widgets.
The following steps explain how to customize the Page Size and Orientation in the PDF export options through the dashboard properties section:
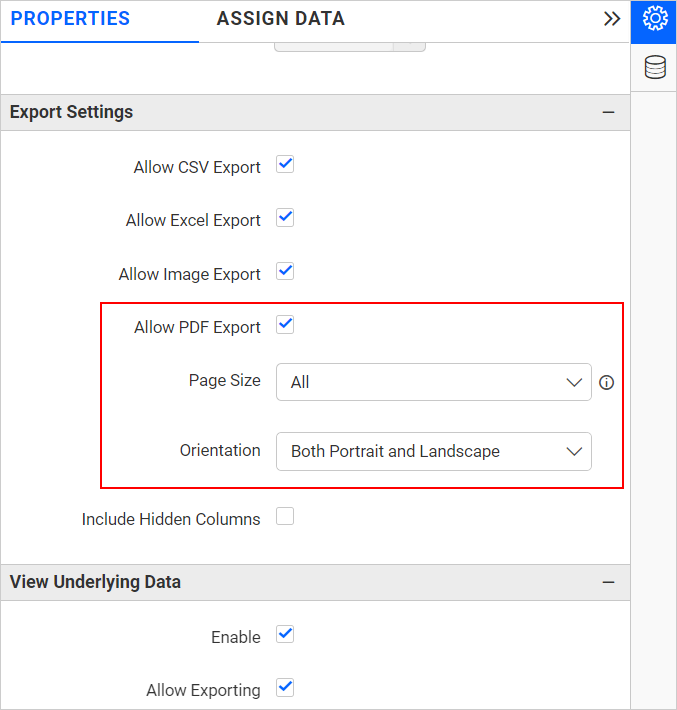
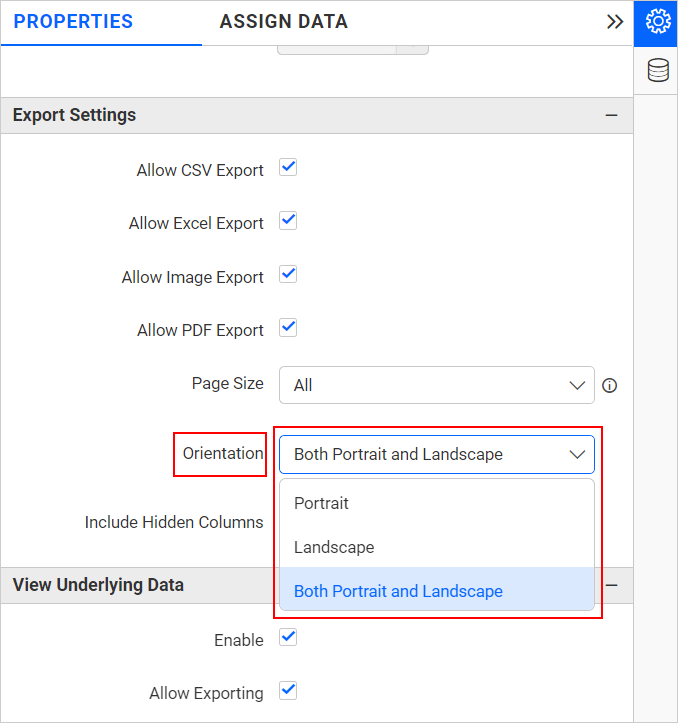
- Go to the properties panel of the widget. By default, all the Page Size options are selected for Page Size, and similarly, the “Both Portrait and Landscape” option is selected for Orientation.
- To enable the Page Size options, go to the Properties tab and enable the specific Page Size options to meet your specific needs under the Allow PDF Exporting option.
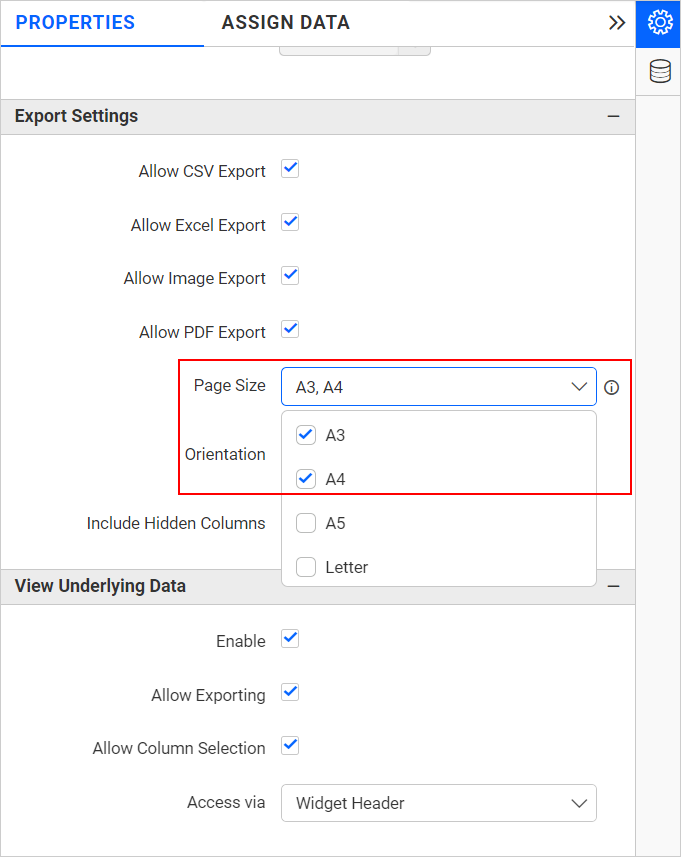
- Similarly, use the dropdown menu to select your preferred
Orientation. These Page Size and Orientation selections will determine how your dashboard will appear when exported to a PDF.
- The selected Page Size options and Orientation can be seen when previewing or viewing the dashboard.
Exporting dashboard to PowerPoint
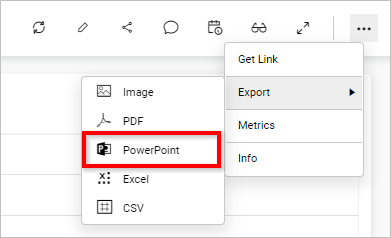
Exporting the dashboard to PowerPoint can be done by clicking the Export to PowerPoint option in the drop-down menu at the right corner of the title section.
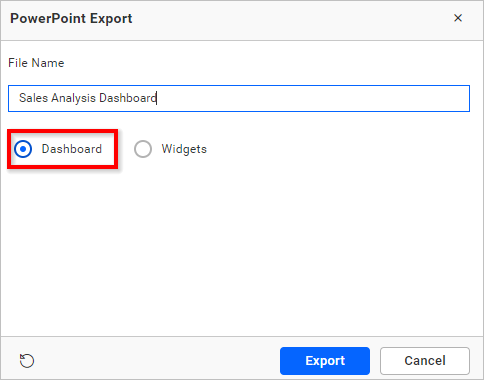
By clicking Export to PowerPoint, a pop-up will be shown as follows. Set the File Name field with a preferred value to replace the default one.
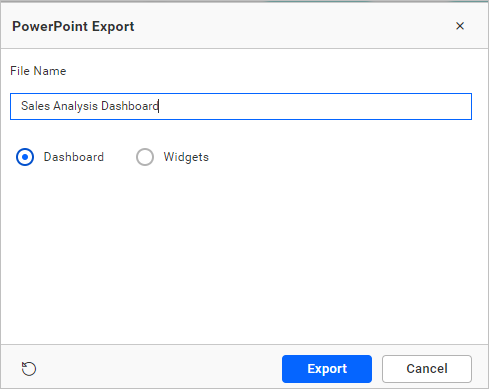
Export all widgets on a single slide as a PowerPoint
The Dashboard option is selected by default, and all the widgets in the dashboard will be exported as a single slide PowerPoint file.
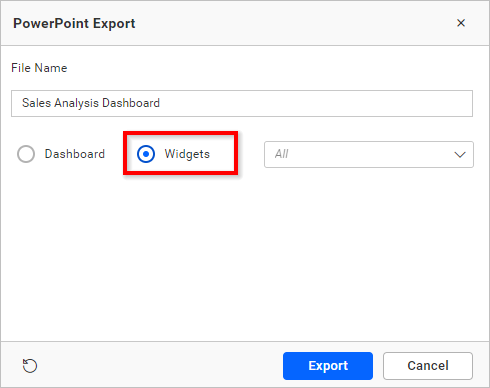
Export all widgets on a separate slides as PowerPoint
By choosing the Widgets option, the user can export each widget present in the dashboard onto individual slides in a PowerPoint presentation.
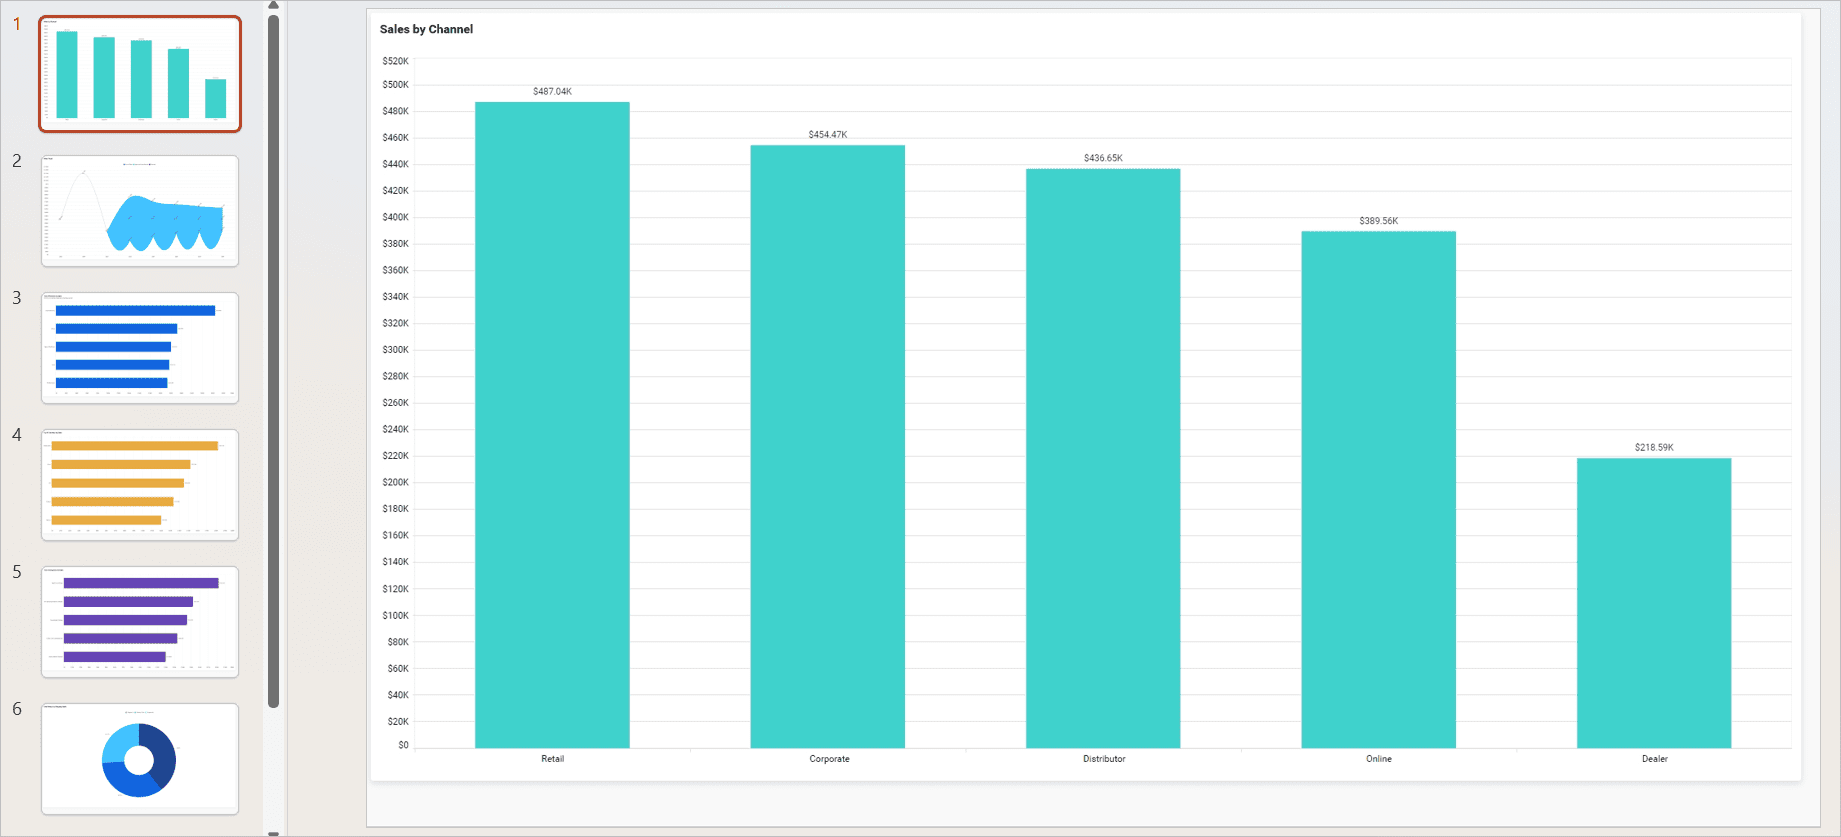
The exported PowerPoint file will look like the one below.
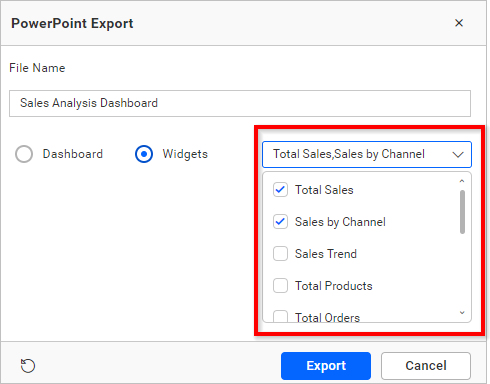
Export the user selected widgets as PowerPoint
By choosing the Widgets option, the dropdown will be displayed on the right side of the popup. By clicking the dropdown, all widgets in the dashboard will be displayed (excluding Filter Widgets). Users can choose the widgets required and click on Export to export selected widgets into a PowerPoint presentation.
By clicking Export, the data in the dashboard will be downloaded with each widget on an separate slide.
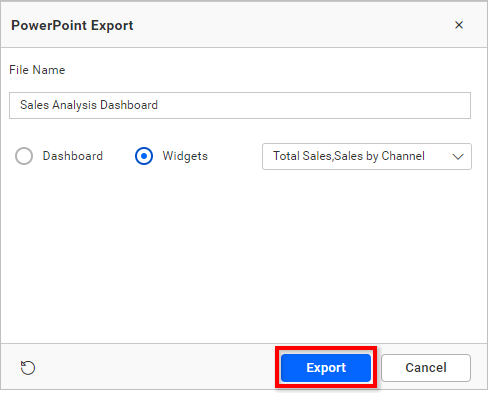
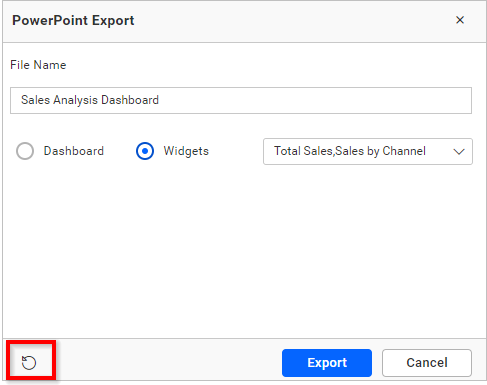
By clicking Reset, the default values will be restored in the pop-up.
Exporting dashboard to Excel
You can obtain the aggregated data showcased in the dashboard by exporting it as Excel format. This can be achieved by clicking Export to Excel in the drop-down menu at the right corner of the title section.

By clicking Export to Excel, the pop-up will be shown as follows:

Set the File Name field with a preferred value to replace the default one.
Choose the Format as either Excel Workbook (.xlsx) or Excel 97-2003 Workbook (.xls).

When the include filter information is switched on, the exported Excel file of the dashboard will contain the applied filter information.
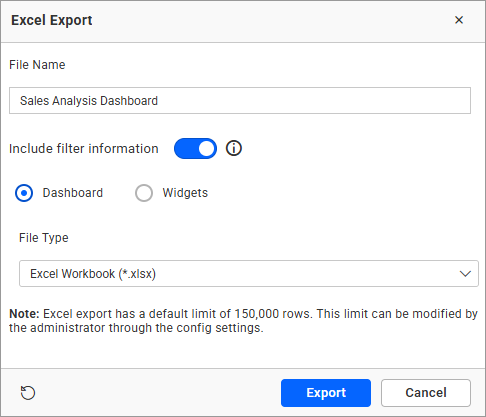
Click Export to display the data in the dashboard in the chosen Excel format.

Click Reset to restore the default values in the pop-up.

Export the user selected widgets as Excel
By choosing the Widgets option, the dropdown will be displayed on the right side of the popup. By clicking the dropdown, all widgets in the dashboard will be displayed (excluding Filter Widgets). Users can choose the widgets required and click on Export to export selected widgets into Excel format.

By clicking Export, the data in the dashboard will be downloaded with each widget on an separate sheet.

By clicking Reset, the default values will be restored in the pop-up.

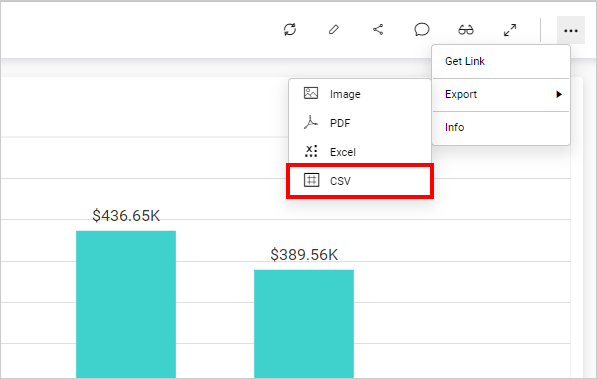
Exporting dashboard to CSV
You can obtain the aggregated data showcased in the dashboard by exporting it as CSV format. This can be achieved by clicking Export to CSV in the drop-down menu at the right corner of the title section.
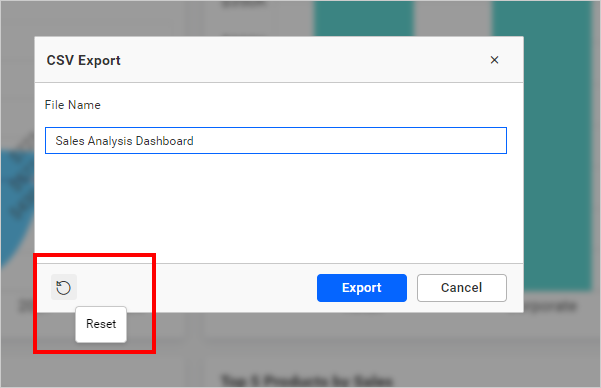
By clicking Export to CSV, the pop-up will be shown as follows:
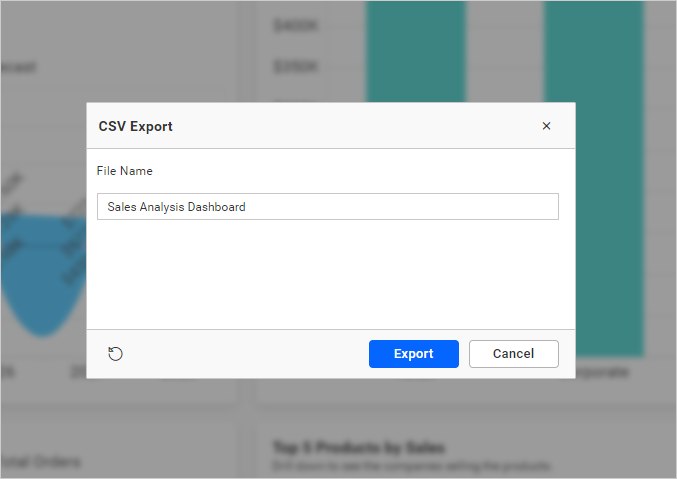
Set the File Name field with a preferred value to replace the default one.
By enabling Disable Double Quotes, the exported file will exclude double quotes from the column headers and values.
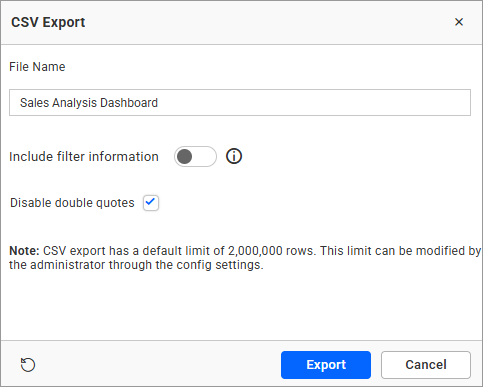
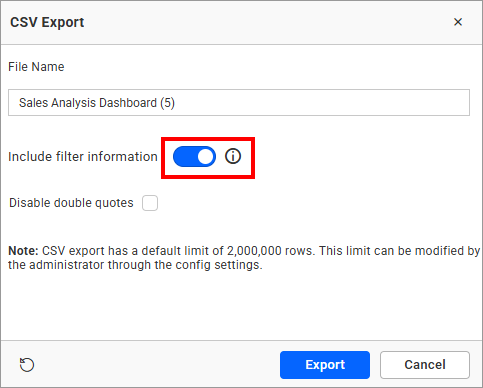
When the include filter information is switched on, the exported CSV file of the dashboard will contain the applied filter information.
Click Export to display the data in the dashboard in the chosen CSV format.
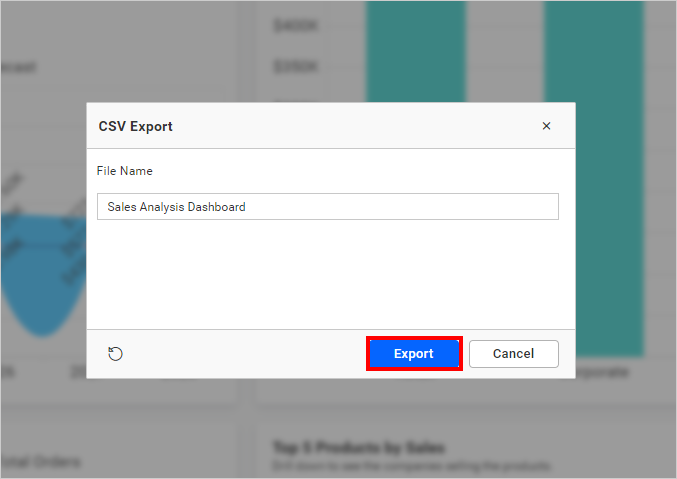
Click Reset to restore the default File name values in the pop-up.
NOTE: When initiating a CSV export, a dashboard with a single widget will directly produce the data in CSV format. In contrast, dashboards with multiple widgets will generate a zip file, encompassing CSV files tailored to each widget item.
Updating dashboard
You can update the dashboard manually by clicking Update Dashboard at the right corner of the title section.
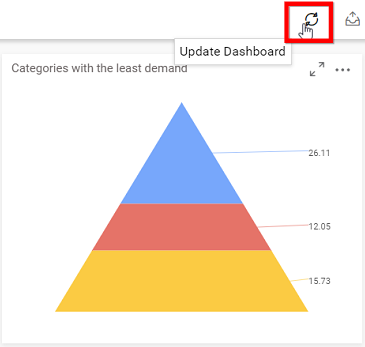
This updates the dashboard with the browser cached data view, which will remain for 10 minutes. After updating the dashboard, the updated data will be fetched from the data server and stored in the cache.
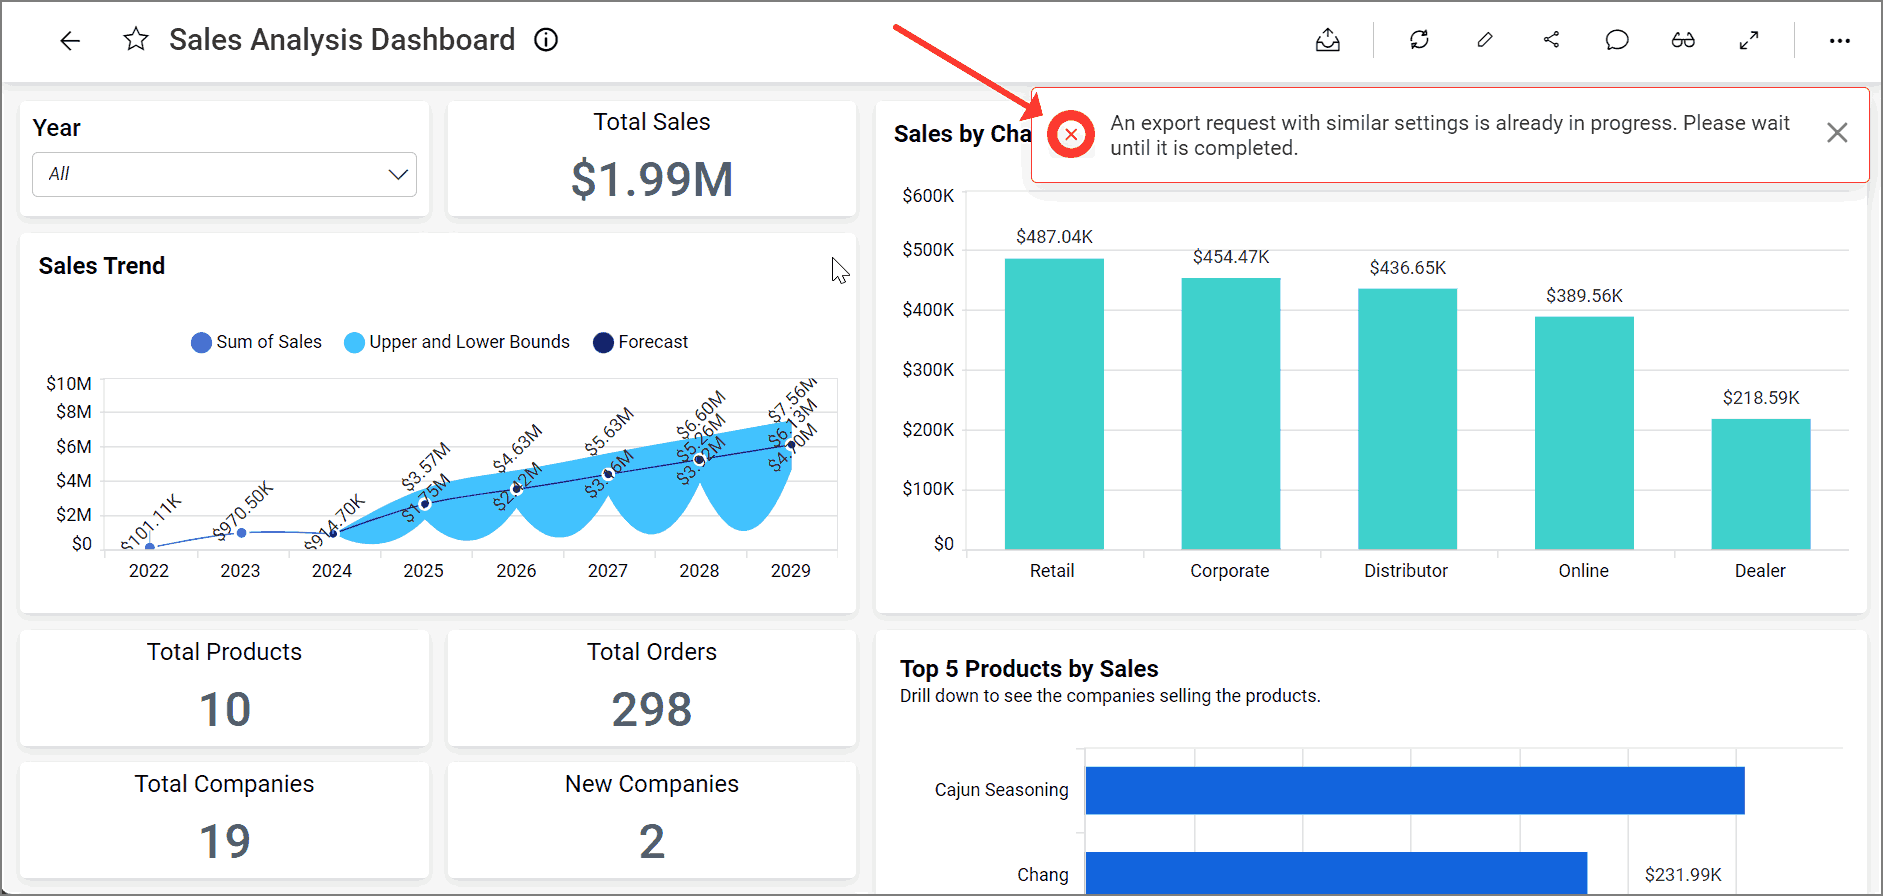
Exporting restriction
We have limitations on exporting files of each format at a time when there are ongoing exports of the same format.
For example, if we choose to export a dashboard in PDF format, we must wait for the ongoing PDF export to finish before starting another export.
If an attempt is made to export another PDF file while one is already in progress, a toast message will be displayed, exhibiting the relevant message.
Additionally, it is possible to export other formats, such as images, Excel, and CSV files, while a PDF export is ongoing.
Also, note that when exporting a dashboard in PDF format or any other format, if you make changes to the filter configuration or apply filters, you will be able to export the PDF format or any other format in both the dashboard and widget levels.