Uses of Filters in Visuals
You can now use dashboard parameters to drive filters on individual visuals. This filters only the selected widget based on the parameter value without affecting the rest of the dashboard.
Prerequisites
- The parameter should be created, refer Dashboard Parameter document to create the parameter.
- Ensure the dashboard that contains the target widgets has already been created.
How it works
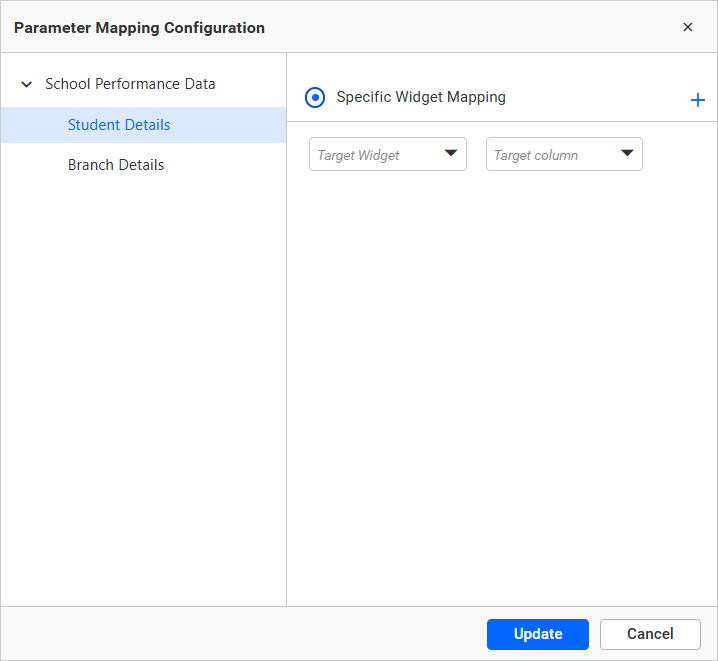
- A dashboard parameter is mapped to a specific widget column using Parameter Mapping Configuration dialog.
- At runtime, the parameter’s value is applied only to the mapped widget.
- Multiple widgets can map to the same parameter; each reacts independently.
How to configure Parameter Mapping
-
You can use the Parameter Mapping Configuration dialog which can be accessed by clicking on the Parameter Mapping icon in the toolbar.
-
By clicking on the Parameter Mapping icon, the Parameter Mapping Configuration dialog will open as follows:
-
In the left pane tree, each data source with configured parameters is listed, and the first data source with its first parameter is expanded and selected by default. Expand the needed data source (for example, School Performance Data) and choose the parameter you want to map (for example, Branch Details).

-
The right pane shows the mapping options for the selected parameter. The Target Widget—the dropdown lists all widget available on the dashboard.

-
After choosing a widget, the Target column dropdown loads the fields configured in that widget; select the column that should receive the parameter value.
-
Click the + icon to add more mappings: you can tie the same parameter to multiple widgets, and a widget can also be controlled by different parameters through different column selections.
-
Click Update to save your mappings, or Cancel to discard the changes.
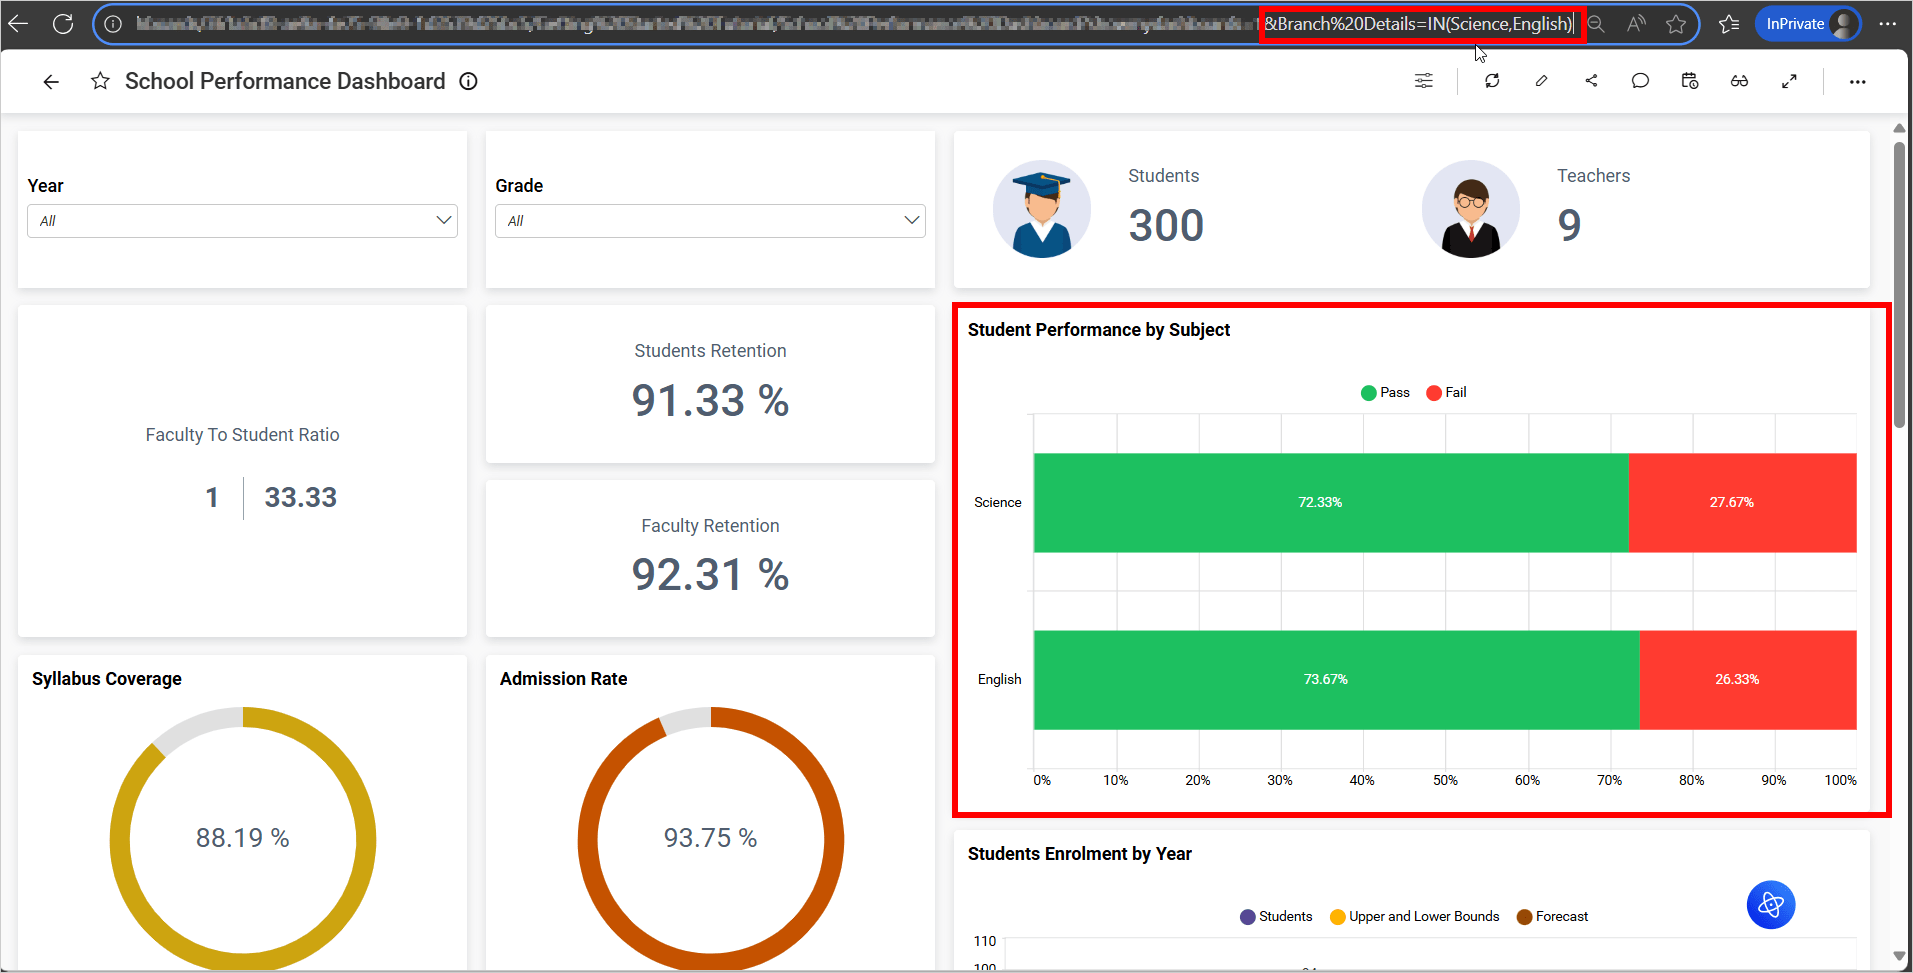
Drive filters via URL parameters (Viewer/Embed)
You can filter visuals by passing parameter values through the dashboard viewer or embed URL. For detailed steps, see Change the Dashboard Parameter Value Dynamically and Change the Dashboard Parameter Value in URL.
In this example, the Branch Details dashboard parameter was passed through the URL, so only its mapped widget was filtered.
Notes
- Parameter data type must match the target field type.
- A widget can reference the same parameter multiple times, but only one column mapping per parameter is honored—the last saved configuration takes effect.