Data filters
Configuring Data Filters
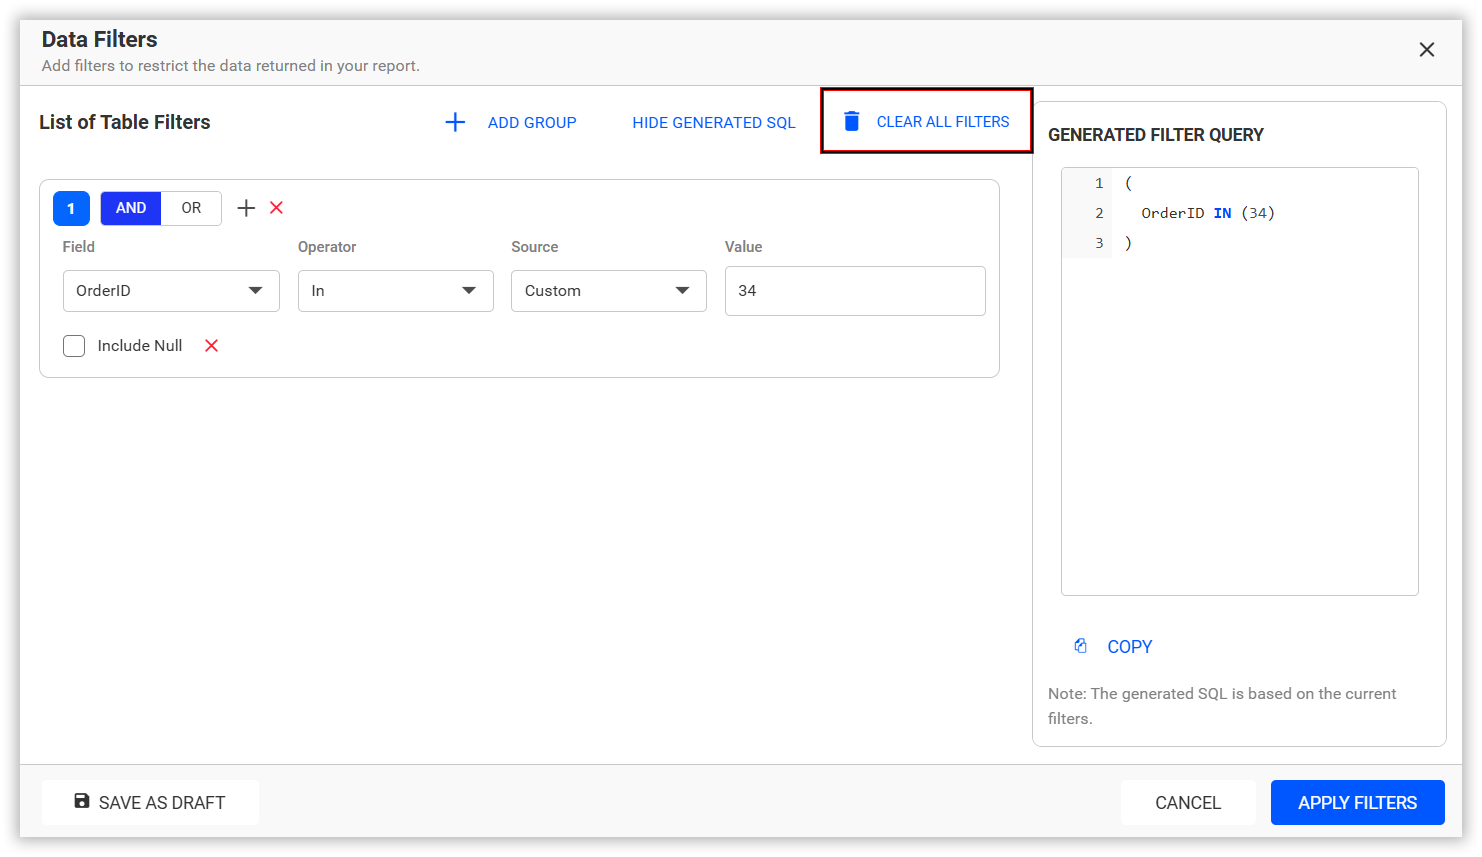
Data Filters can be configured to restrict record visibility based on defined criteria. The configuration can be done by adding and deleting a filter condition.
Adding a filter condition
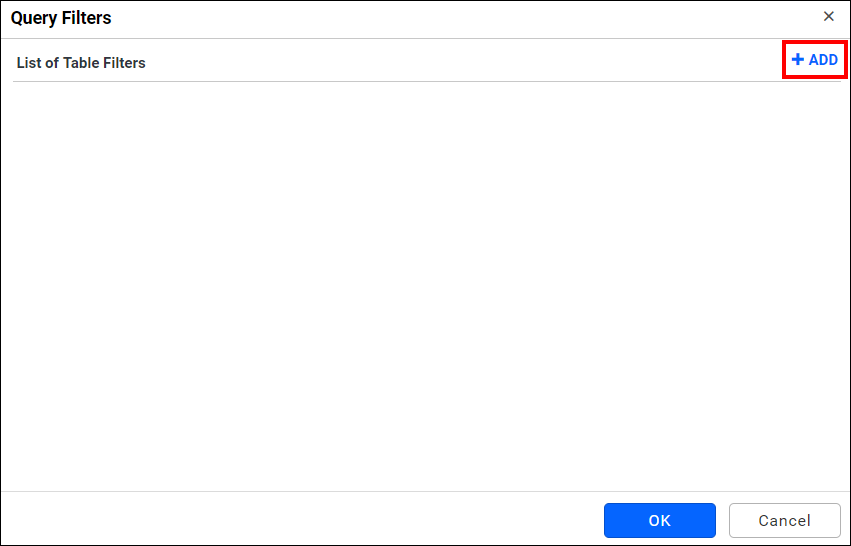
Click on the Filters option shown in the data design view window. The Data Filter window will open.

Now, a filter condition will be added by default as shown below:
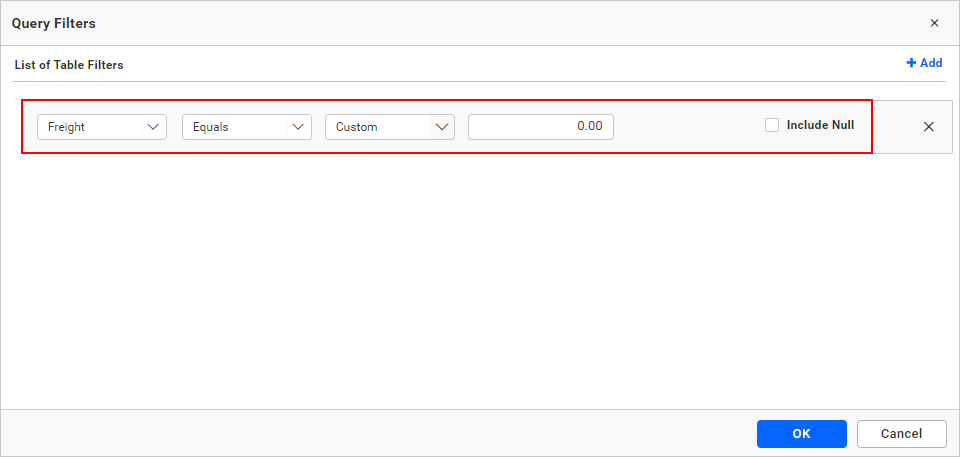
You can add Add a filter condition by clicking the Add Group button in the Data Filters window.
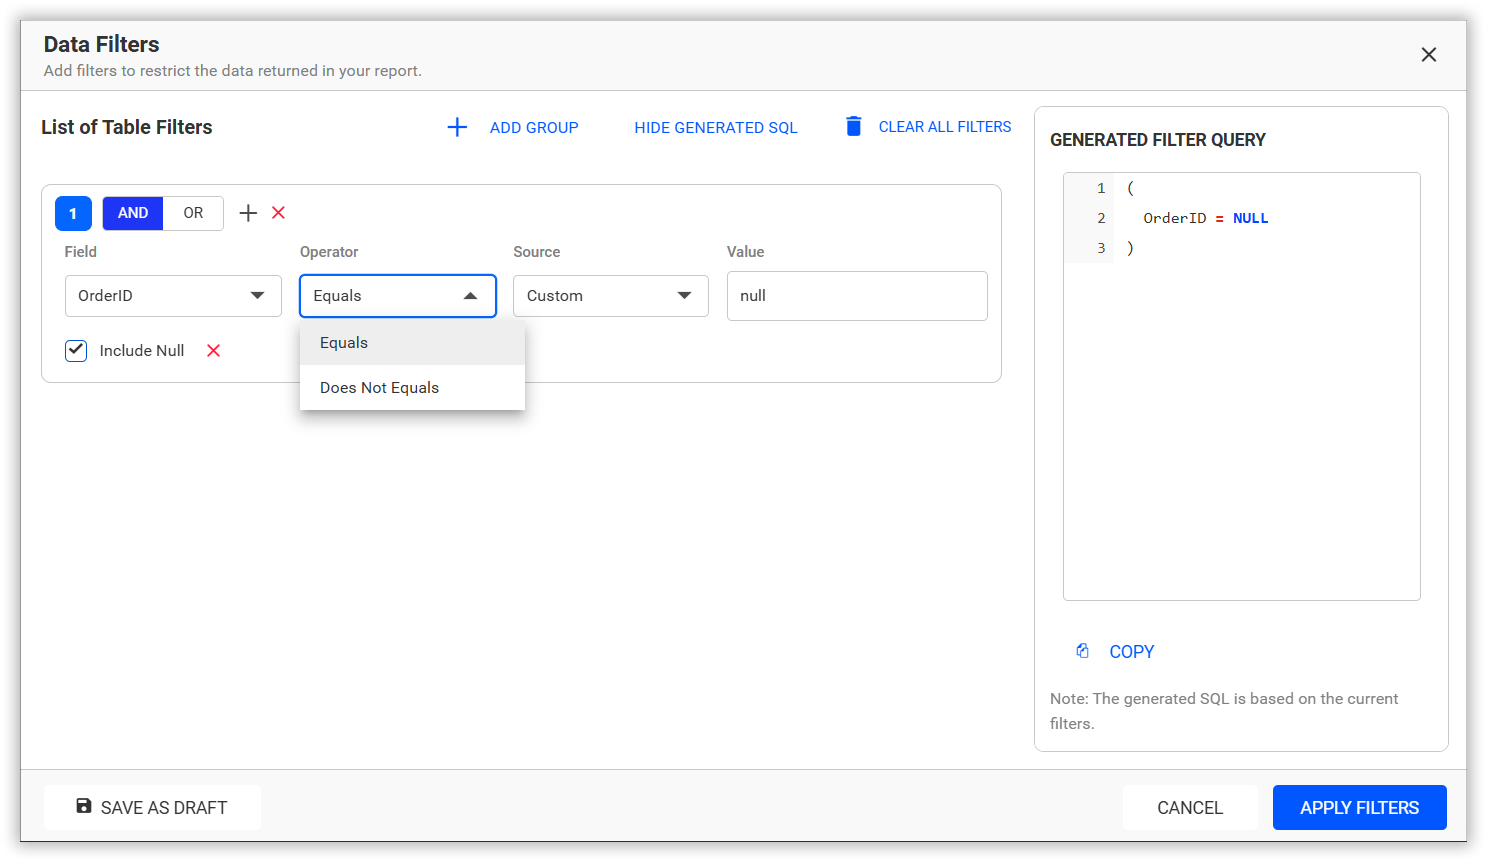
You can filter values with or without Null by checking or unchecking the Include Null option. If you check this option, only Equals and Does Not Equal conditions will be shown. Based on these conditions, you may filter values with or without Null.
Nested Groups and Conditions
The Data Filters feature allows you to organize filter conditions into nested groups to configure complex filtering requirements. Each group can contain multiple conditions and additional nested groups.
You can combine conditions and groups using the AND/OR operators to define how the filter conditions are evaluated.
Adding Nested Groups and Conditions
Click the + icon within a group to display the available options.
- Add Group: Adds a nested group within the selected group.
- Add Condition: Adds another filter condition within the selected group.
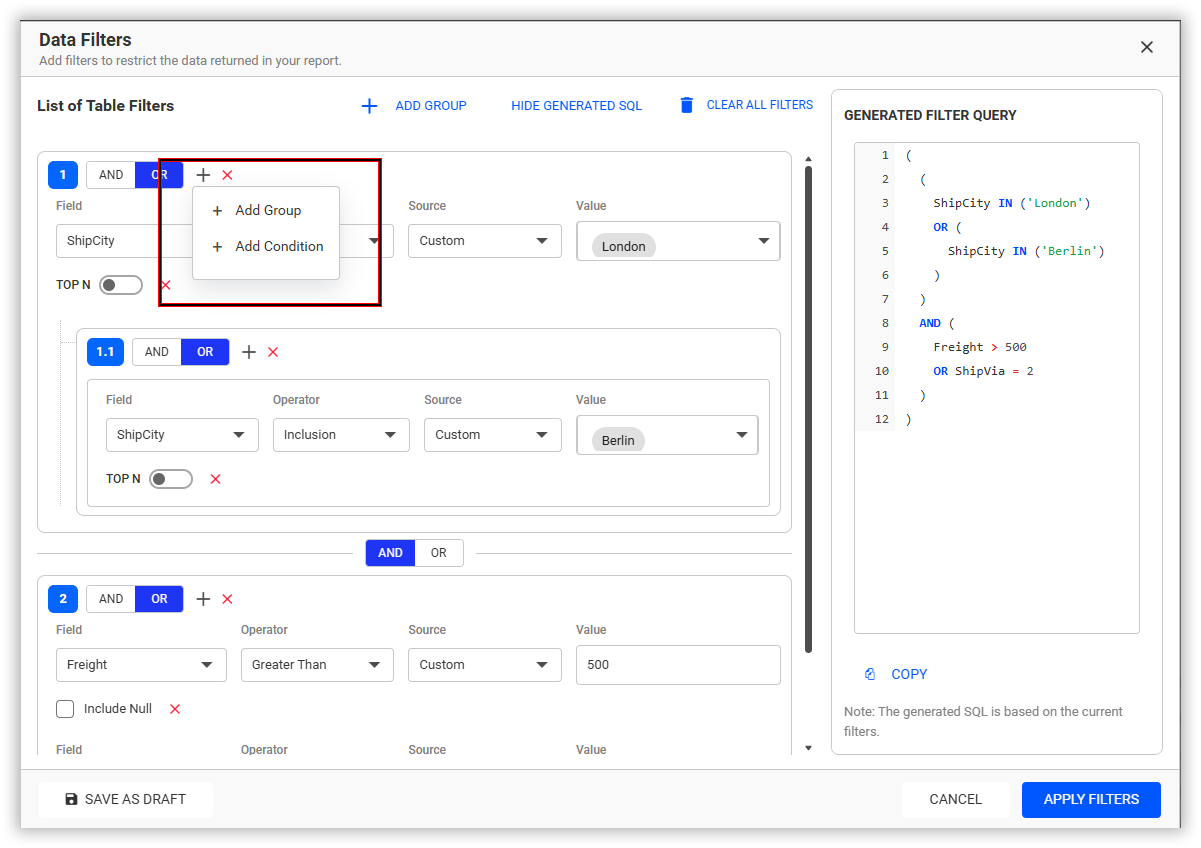
You can add multiple conditions within a group and combine them using the AND/OR operators.
Understanding Nested Groups
Nested groups allow you to organize related conditions and control how they are evaluated.
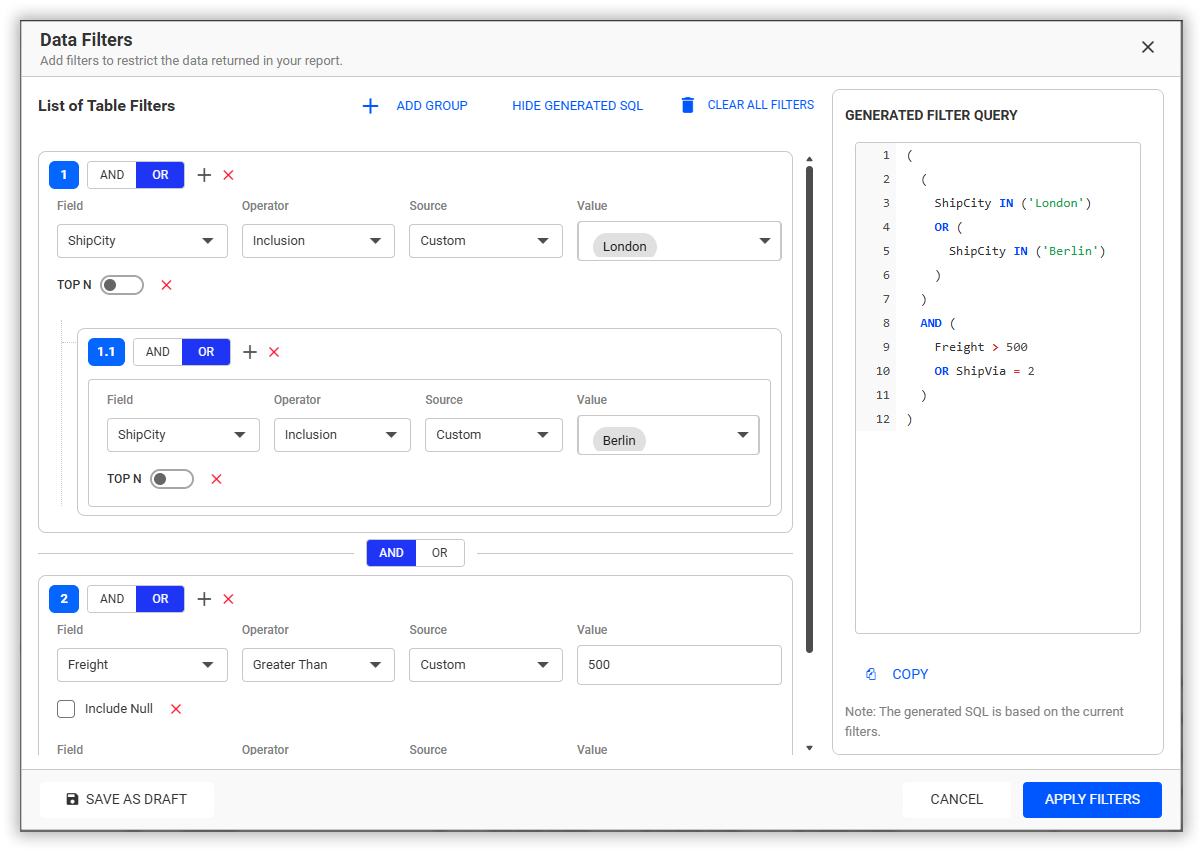
For example, to retrieve orders shipped to London or Berlin where the freight is greater than 500 or the shipping method is 2, configure the following conditions:
Filter configuration:
Configuring Maximum Nested Group Depth
By default, Data Filters supports a nested group depth of 3.
When the configured nesting depth is reached, the Add Group option will no longer be displayed. You can continue adding filter conditions within the existing group.
The default value of DataFiltersMaxDepth is 3, and the maximum supported value is 8.
Modifying the Maximum Nested Group Depth
To increase the maximum nesting depth, modify the DataFiltersMaxDepth property in the config.json file.
Follow these steps:
- Navigate to the Bold BI administration page.
- Open Settings → Configuration.
- Select the
config.jsonfile. - Locate the
DataFiltersMaxDepthproperty. - Update the value to the required maximum nesting depth.
- Click Save to save the configuration.
For example, to increase the maximum nesting depth to 4, configure the following property:
{
  "DataFiltersMaxDepth": "4"
}
In this example, users can configure nested groups up to the configured depth of 4.
Note: When the configured maximum nesting depth is reached, the Add Group option will be hidden, while the Add Condition option will remain available. The maximum supported nesting depth is 8.
Modify the condition as needed and define the criteria. The condition can be defined based on two options:
- Custom
- Parameters
Custom
In the custom option, filter the records based on the columns. The parameters to define will differ based on the data type.

For columns like date time or text type, you may see a toggle button for TOP N on the right to enable the Top Nfilter and configure the field and condition.
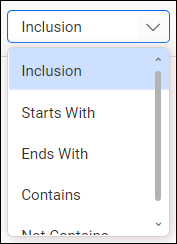
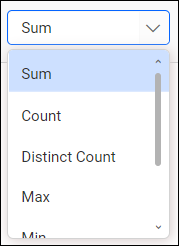
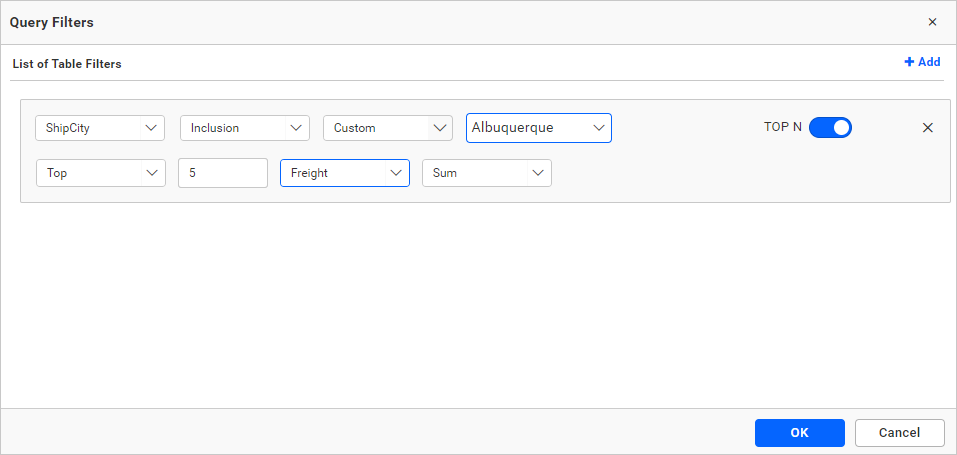
Below example shows top 5 freight data of a city.
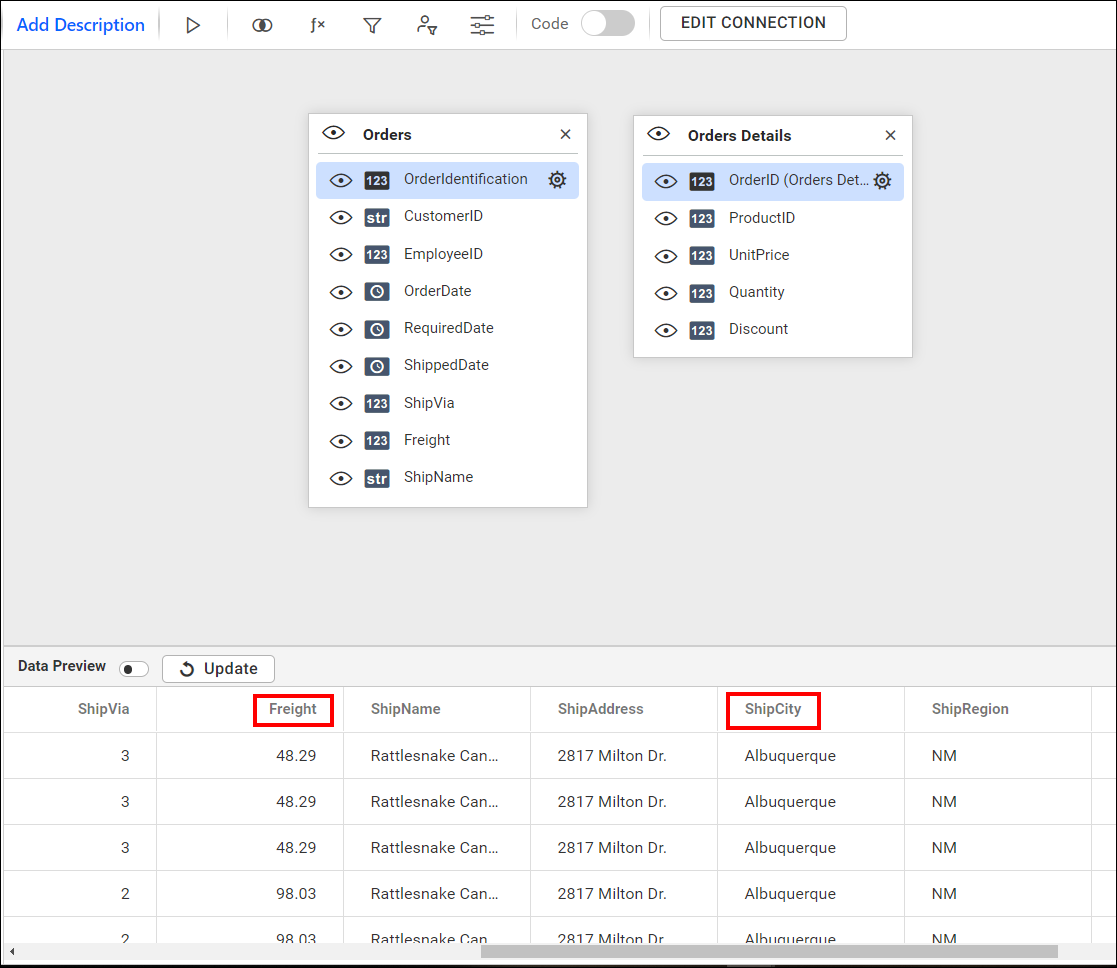
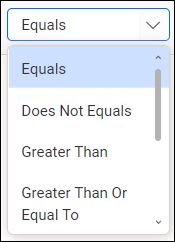
For numeric type columns, the parameters will be as shown below:

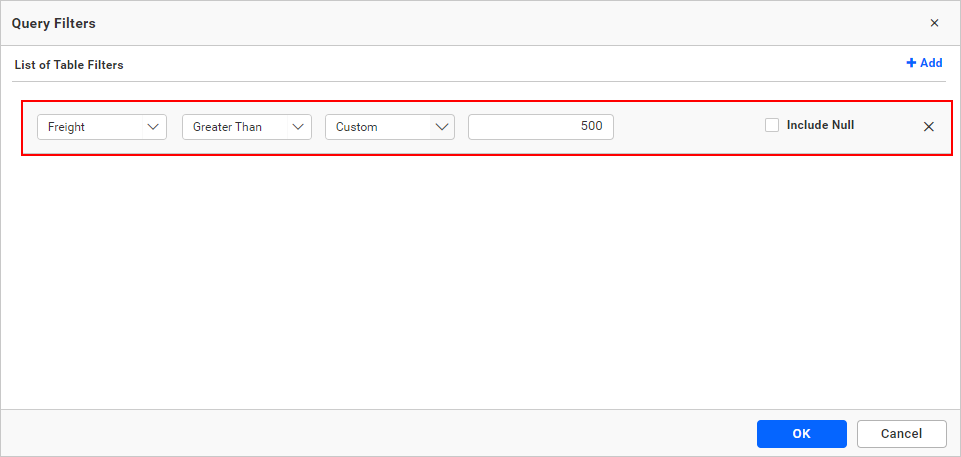
The example below shows data of freight with values greater than 500.
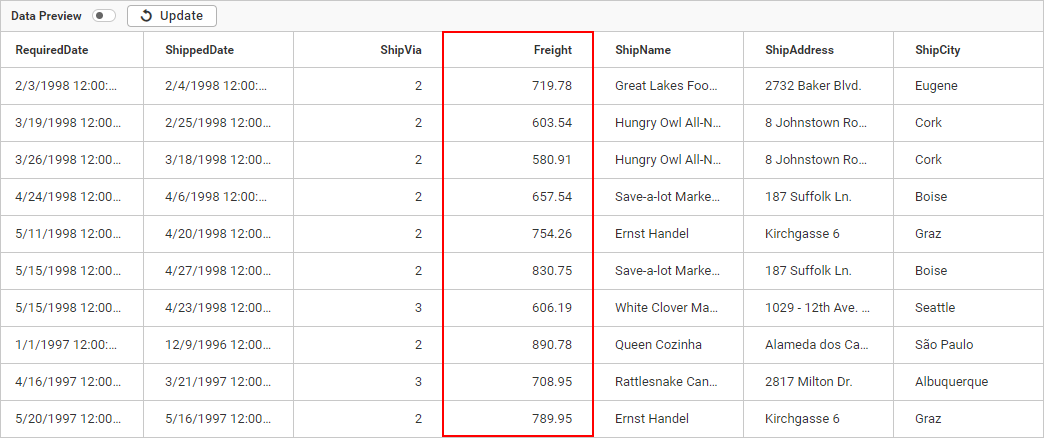
Upon clicking OK in the dialog above, the Data Preview grid will appear as shown below.
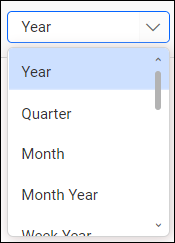
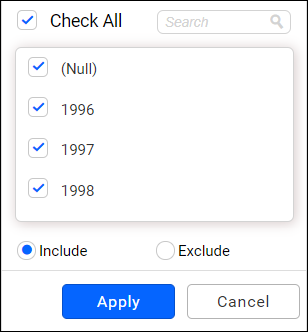
For date and time columns, the parameters will be as follows:

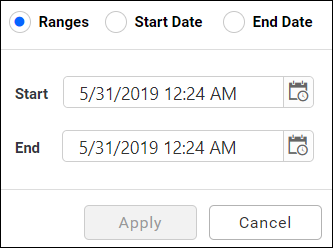
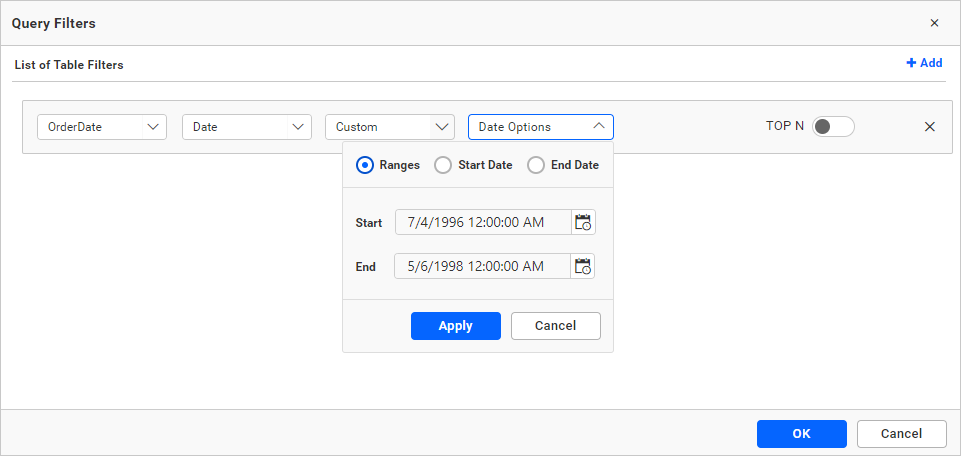
The example below shows data within the specified date range.
To add more than one condition, click the Add Group button.
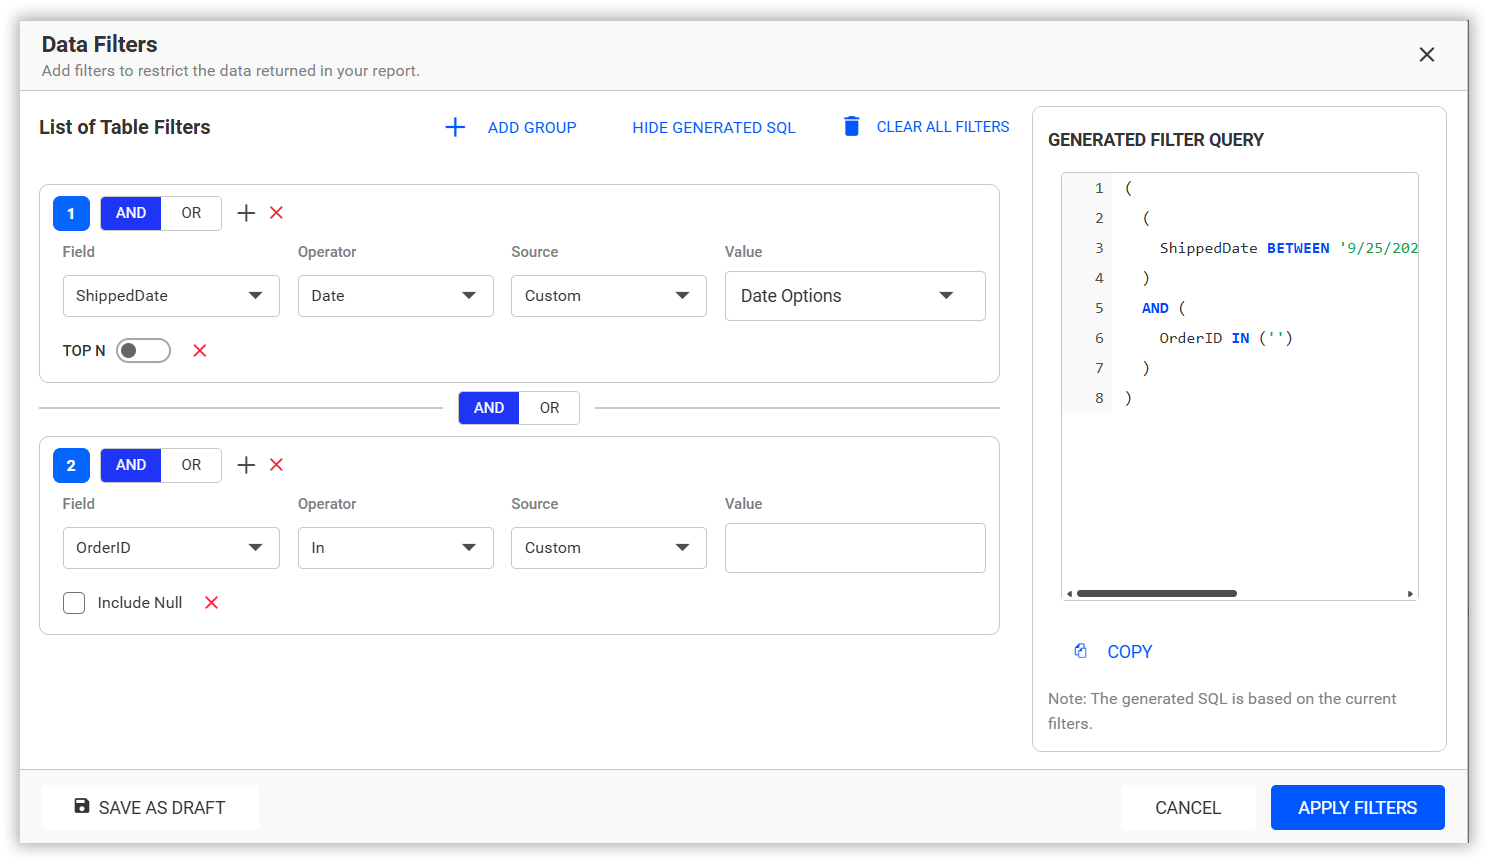
NOTE: By default, the AND operation will be used between two conditions. The operator can be changed to OR if necessary.
Click OK to save the defined data filter conditions.
Click Close or the Close icon at the top right corner of the window to close the Filters window.
Parameters
Filter the records based on the dashboard parameter values. This allows for dynamically changing the parameter values in both view and preview modes.
Click on the Parameters option as shown below.
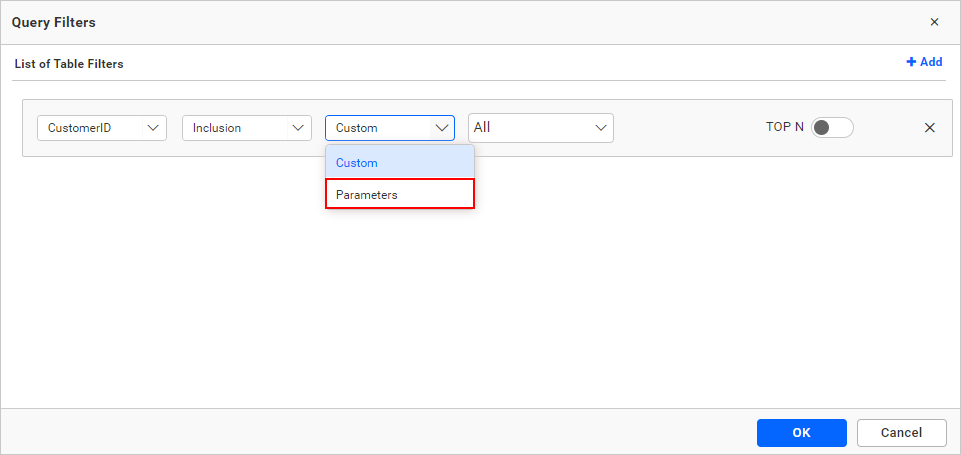
Select the desired parameter lists from the dropdown menu. The first parameter will be selected by default.
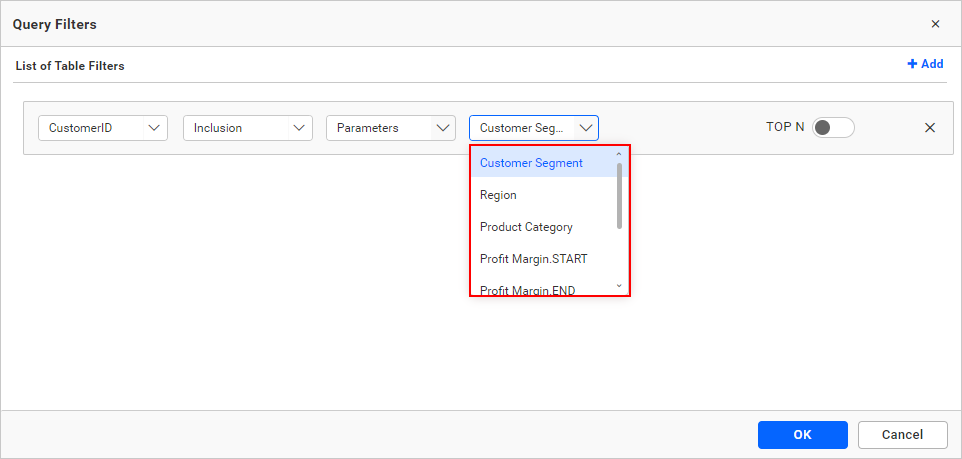
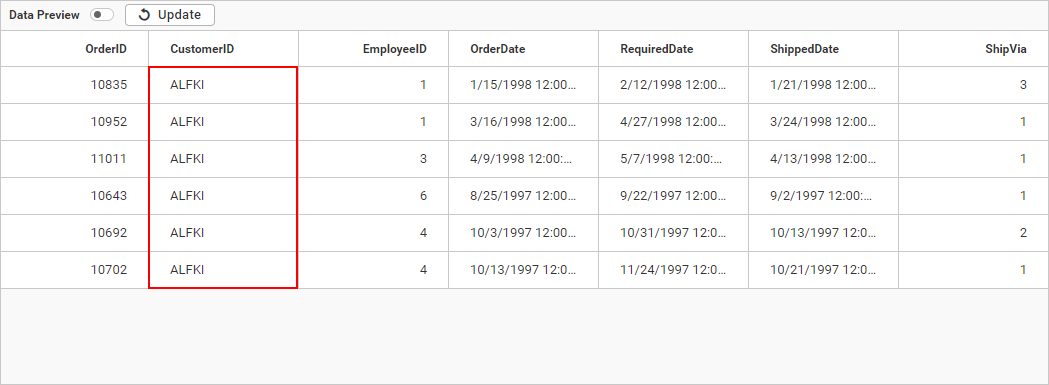
The following example displays data where the selected table column is equal to the chosen dashboard parameter. To create parameters, follow the instructions provided in configuring dashboard parameters
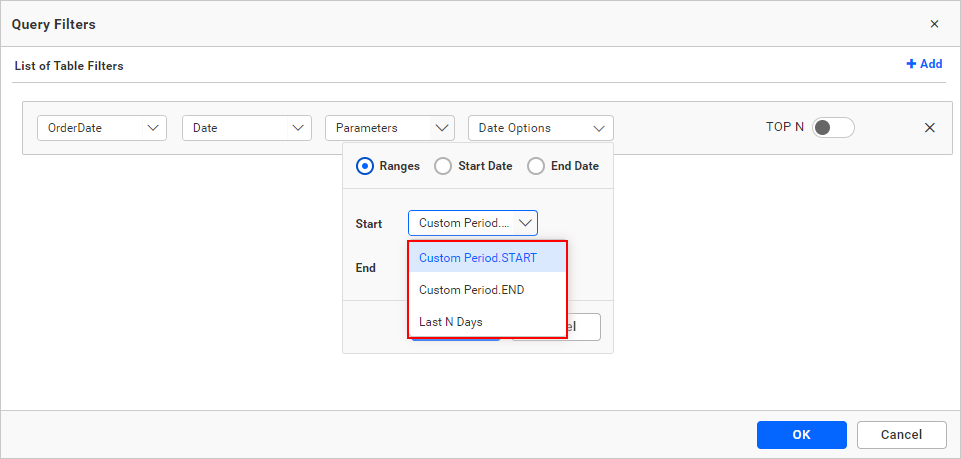
For a date column with a date range type, only date format parameters will be shown.
NOTE: Support is only provided for dimensions, measures, and date columns with date range types.
Deleting a filter condition
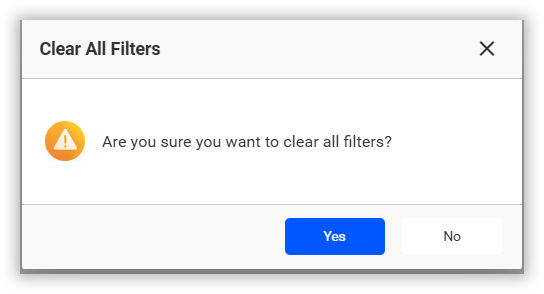
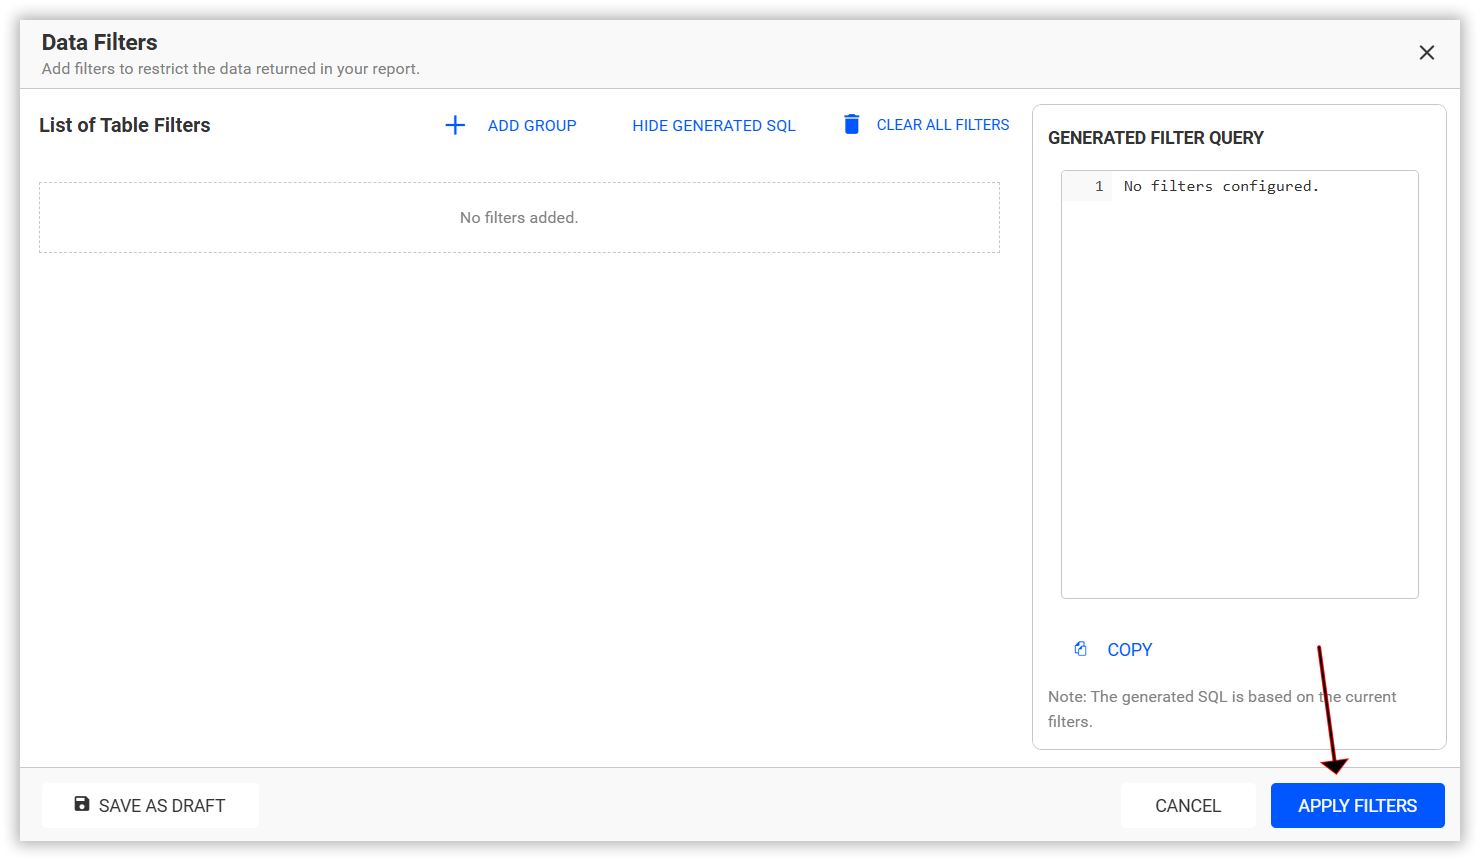
Remove a filter condition by clicking the highlighted icon to its right, and then click Apply Filter to apply the changes.