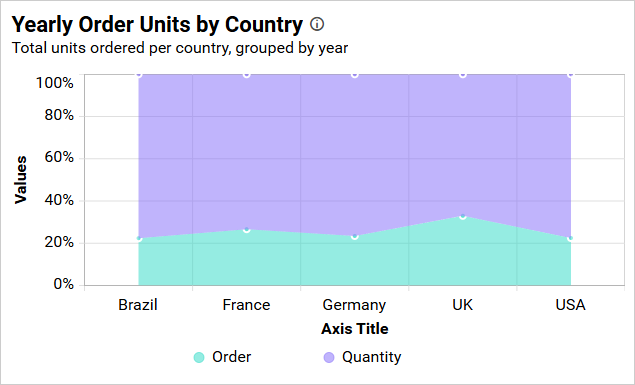
100% Stacked Area Chart
The 100% Stacked Area Chart allows for the comparison of multiple measures through the use of filled curves that are stacked vertically, one after another.
How to configure the table data to 100% stacked area chart?
A 100% Stacked Area Chart requires at least one value element and one column element to display. The measure or expression field that you want to analyze can be placed in the Y Values block. The dimension that you want to categorize the measure by can be placed in the Columns block. If you want to categorize based on a series, you can also place the respective dimension in the Rows block.
To configure the data to a 100% stacked area chart, follow the steps below:
-
Drag and drop the 100% stacked area chart onto the canvas and resize it according to your desired size.
-
Click the
Data Sourcebutton in the configuration panel. -
Click the
CREATE NEWbutton to initiate a new connection from the connection type panel. -
In the connection type panel, click on any one of the listed connection type buttons (Here, the
Microsoft ExcelConnection type is selected for demonstration). -
In the
NEW DATA SOURCEconfiguration panel, fill out the connection type and related details. Click theConnectbutton. -
Drag your preferred table or view from the left pane in the data design view, then click the
Savebutton. -
Click the
Propertiesbutton in the configuration panel, and the property pane will open. Now, switch to theASSIGN DATAtab. -
The
ASSIGN DATAtab will be opened, displaying the available measures and dimensions from the connected data source. -
You can add the necessary data from the
MeasuresandDimensionsinto the designated field.
Adding Value(s)
You can add more than one Measures into the Value(s) field by dragging and dropping the required measure.
Click on the Settings option to change the required summary type from the available summary types shown in the Settings section.
Filtering data
You can filter the data that is displayed in a chart by using the filter option. For more details, refer to the filter.
Adding Columns
You can add more than one value to the Columns field.
You can change the settings.
Renaming fields
The field names that have been configured can be edited by using the Rename option provided in the settings menu.
Sorting data
You can sort the dimension data using the Sort option under the Settings menu list. To apply sorting to the data, refer to the Sort.
Filtering data
You can apply filters by selecting the filters option in the settings. For more details, please refer to the filter.
To view all the records, click on Show All Records.
Similarly, you can add the Measures and Expression Columns into column field.
Multi-level drill down
- When more than one value is configured in Columns, drill down is enabled. Click a category to drill into the next level in the Columns hierarchy.
Drill up
Use the breadcrumb at the top of the widget to navigate back to the previous level after drilling down.
Adding Rows
You can drag and drop the Measure or Dimension into the Rows field.
You can apply a filter and sort option for the rows field, if required.
This will render the chart in a series.
How to format 100% stacked area chart?
You can format the 100% stacked area chart for better illustration of the view you need using the settings available in the Properties pane.
To configure data into 100% stacked area chart follow the steps
-
Please drag and drop the 100% stacked area chart onto the canvas and resize it to the size you need.
-
Configure the data into a 100% stacked area chart.
-
Please focus on the 100% stacked area chart and click on the widget settings.
The property window will be opened.
You can view the list of properties that are available for the widget with the default value.
Name
This feature allows you to modify the title for the 100% stacked area chart widget.
Subtitle
This widget allows you to provide the subtitle for the spline area chart.
Description
This spline area chart widget allows you to provide the description.
Show Value in Tooltip
As it is a percentage type, the values will be shown with percentages when you hover over the chart. If you enable this option, the value will be shown in the tooltip.
Enable Animation
It animates the measure values when you toggle the Enable Animation.
Show Value Labels
This feature allows you to switch the visibility of value labels.
If you disable the Show Value Labels properties, the dependent properties, which are color, value label position, value label rotation and value label suffix, will be hidden.
Value Label Color
This allows you to customize the color of the value label.
Value Label Position
This option allows you to customize the position of the value label in a chart. By default, it is set to Auto, so the label position for the percent stacked area chart will be set as middle.
Value Label Rotation
This allows you to define the rotation angle for displaying the value labels.
Page Size
This option allows you to set the number of records that need to be fetched on initial load.
Tooltip Settings
The Tooltip Settings section allows you to customize the appearance and behavior of tooltips in widget visualizations.
Show Tooltip
This option allows you to toggle the visibility of the tooltip in a chart.
Customize Tooltip
This option allows you to customize which columns are visible in the chart’s tooltip.
Enable RTL
This option allows you to display fields and their data from right to left.
Apply Legend Color
This option allows you to display tooltip text and value colors that correspond with the legend colors.
Legend Settings
Show Legend
A legend is a text used to describe the plotted data. This allows you to toggle the visibility of the legend in the chart and also change the position of the legend text by selecting through the combo box.
Enabling the option of Custom Legend Text will allow you to define a custom text, using the text area, to display for each legend series in the chart (selected through the combo box).
Legend Interactivity
The chart’s legend interactivity option allows you to control the behavior of the chart legends. This option provides the ability to make chart legends non-clickable, which can be particularly useful in situations where you do not want users to hide or show series data by clicking on the legend. This feature might also be beneficial when displaying crucial data that should always be present for accuracy and context.
Disabling the Interactivity feature in the Legend Settings category prevents you from clicking on the legends.
Enabling the Interactivity feature in the Legend Settings category allows you to click on the legends.
Legend Label Color
This feature enables you to modify the title and label colors of the chart legend.
Legend Position
A Legend is a text used to describe the data plotted. This option allows you to place the legend at the position of Left, Right, Top, and Bottom.
Legend Alignment
Legend Alignment enables you to control how the legend is positioned within its allocated space. For detailed guidance, refer to the Legend Alignment section.
Legend Shape
This allows you to change the shape of the legend.
Circle
This option enables you to modify the shape of the legend to a Circle.
Series Type
This option allows you to change the shape of the legend in a Series.
Legend Title
This allows you to add the legend title for the chart. It will reflect with the Show Legend.
Text Overflow
This option enables you to customize the legend text based on the value of the Text Width property.
None
This option enables you to display the legend items without any wrapping or trimming.
Trim
This option allows you to trim the legend items if their legend exceeds the value of Text Width.
Wrap
This option allows you to wrap the legend items based on the value of Text Width.
Text Width
This option allows you to set the maximum width for the legend items, and it is applicable only if text-overflow is set as Trim or Wrap.
If you uncheck the Show Legend property in the property panel, the dependent properties, which are the legend color, legend position, customization button and legend title, are also hidden.
NOTE: For a single series, the legend won’t be visible.
Axis Settings
This section allows you to customize the axis settings in the chart.
Title color
This feature allows you to customize the color of the axis title.
Label color
This feature allows you to customize the color of the axis labels.
Show Primary Value Axis
This allows you to enable the Primary Value Axis for the chart.
If you disable Show Primary Axis option, dependencies properties Axis title, Axis title text and Axis type, Axis Format properties will be hidden.
Show Primary Value Axis Title
This allows you to enable the visibility of the Primary Value Axis title of the chart.
Primary Value Axis Title
This allows you to edit the title of the Primary Value Axis, which will be reflected as the name of the y-axis on a chart.
Inverse Axis
By default, the chart axis shows positive values at the top and negative values at the bottom. However, there are times when we need to invert the axis and display the negative values at the top and positive values at the bottom. For example, when we bind temperature data to the chart and want to display the negative values at the top, we can utilize this property.
When this property is enabled, the chart will display negative values on the top and positive values on the bottom.
Axis Range Settings
This allows you to manually set the minimum, maximum, and interval values of the primary value axis through the Axis Range Settings dialog.
It will be reflected in the primary value axis of the chart.
Parameter Support in Axis range:
This allows you to dynamically set the minimum, maximum, and interval values of the primary value axis through the Axis Range Settings dialog by using the dashboard parameter values. Only number-type dashboard parameter values are allowed in the axis range properties. You can create multiple types of dashboard parameters.
- Single parameter value.
- Range parameter value.
- Data source field based parameter values.
For more details about dashboard parameter, refer to the Dashboard parameter documentation.
Single Parameter Value:
A single value is stored in this type of parameter.
- Please create a dashboard parameter in the number type as shown below.
Click the axis range settings dialog and enter @ in any textbox (minimum, maximum, and interval). Select the parameter value (Number type parameter values are the only ones allowed).
Now, the parameter value is reflected on the chart axis.
Range Parameter Value:
If you want to establish identical ranges in multiple instances, create a parameter value for the range type. This parameter type includes the starting and ending values.
-
Create a parameter in range type.
-
Click the axis range settings dialog and enter
@in any textbox (minimum, maximum, and interval). The range parameter is split into start and end parameters. The value in the first textbox is stored in the start parameter, and the value in the second textbox is stored in the end parameter. Select the parameter value (only Number type parameter values allowed). -
The value of the parameter is reflected on the chart axis.
Data Source Field Based Parameter Value:
-
Create a parameter in the data source type, choosing any field. The value should be based on the selected field value.
-
Click on the axis range settings dialog and enter
@in any textbox (minimum, maximum, and interval). Then, select the parameter value. -
The value of the parameter is reflected on the chart axis.
Grid Line
Primary value Axis
This feature allows you to enable gridlines for the Primary Value Axis in the 100% stacked area chart.
Category Axis
This allows you to enable the gridlines for the Category axis in the 100% stacked area chart.
Font settings
This section allows you to customize the font size of chart elements.
Auto font Size and font size
By default, the Auto Font Size property is enabled. The auto font size property is used to set the font size based on the resolution of the machine on which the dashboard is being viewed. If the user wants to customize or set a fixed font size, they need to disable the auto font size and manually set the desired font size.
Filter
This section allows you to handle the filter action for the 100% stacked area chart widget.
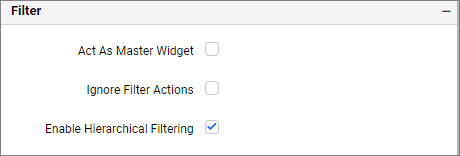
Act as master widget
This allows you to define this 100% stacked area chart widget as a master widget such that its filter action can be made to listen by other widgets in the dashboard.
Ignore filter actions
This allows you to define this 100% stacked area chart widget to ignore responding to the filter actions applied on other widgets in dashboard.
Hierarchical filter
Using this option, you can enable or disable the hierarchical top N filtering. While applying the Top N filter with multiple dimension columns, the data returned can be customized based on whether the filtering need to be done as flat or based on the hierarchy of dimension columns added.
When the Hierarchical Filter option is enabled, the Top N will be applied for each individual column separately based on the number set for each column.
Container Appearance
This section allows you to customize the Container Appearance for the 100% stacked area chart widget.
Title Alignment
This allows you to handle the alignment of the widget title to either left, center, or right.
Title Color
This allows you to apply the text color to the widget title.
Title Auto Font Size
When Auto Font Size is enabled, the font size of the title will be adjusted automatically based on the screen resolution.
Font Size
This allows you to apply the specified size of the font to the widget title if the Title Auto Font Size is disabled. Value can be between 10 and 44.
Subtitle Auto Font Size
On enabling Auto Font Size, the font size of the subtitle will be adjusted automatically based on the screen resolution.
Font Size
This allows you to apply the specified size of the font to the widget title if the Subtitle Auto Font Size is disabled. Value can be between 10 and 32.
Auto Padding
On enabling Auto Padding, the padding of the widget container will be adjusted automatically if the size of the widget varies.
Padding
This allows you to customize the padding of the widget container if the Auto Padding is disabled. Value can be between 0 and 25.
Show Border
This allows you to toggle the visibility of the border surrounding the widget.
Corner Radius
This allows you to apply the specified radius to the widget corners if the Show Border is enabled. Value can be between 0 and 10.
Show Background Image
This allow you to set the background image for the 100% stacked area chart widget.
Background Color
This allows you to set the background color to the 100% stacked area chart widget.
Transparency
This property allows you to specify the transparency for the background color.
Show Shadow
This allows you to toggle the visibility of the shadow surrounding the widget.
Exporting
This section allows you to export the widget in different formats.
Allow Maximize View
This allows you to enable or disable the maximized mode of the 100% stacked area chart widget. The visibility of the maximize icon in the widget header will be defined based on the setting in the viewer.
Allow CSV Export
This allows you to enable or disable the CSV export option for the 100% stacked area chart widget. Enabling this allows you to export the summarized data of the widget view to CSV format in the viewer.
Allow Excel Export
This allows you to enable or disable the Excel export option for the 100% stacked area chart widget. Enabling this allows you to export the summarized data of the widget view to (.xlsx or .xls) format in the viewer.
Allow Image Export
This allows you to enable or disable the Image export option for the 100% stacked area chart widget. Enabling this allows you to export the view of the widget to image format (.jpg), (.png), or (.bmp) in the viewer.
Allow PDF Export
This allows you to enable or disable the PDF export option for the 100% stacked area chart widget. Enabling this allows you to export the view of the widget to pdf format in the viewer.
Enable Comments
This allows you to enable or disable comment for the dashboard widget. For more details, refer to the Commenting Widget.
Allow View Underlying Data
This allows you to visualize the raw data associated with a widget at runtime.
To learn more about viewing the underlying widget data, refer to the view data documentation.
Pin Widget
This allows you to pin the widget.
Responsive Behavior
We hide the widget elements based on the widget’s size for better readability.
When the chart has been placed with less than 7 columns chart Y-axis labels, Y-axis titles will be hidden.
When the chart has fewer than 6 rows, the X-axis labels, X-axis titles, and gridlines will be hidden.
- Name
- Subtitle
- Description
- Show Value in Tooltip
- Enable Animation
- Show Value Labels
- Value Label Color
- Value Label Position
- Value Label Rotation
- Page Size
- Tooltip Settings
- Legend Alignment
- Axis Settings
- Inverse Axis
- Parameter Support in Axis range
- Single Parameter Value
- Range Parameter Value
- Data Source Field Based Parameter Value
- Font settings
- Filter
- Container Appearance
- Title Alignment
- Title Color
- Title Auto Font Size
- Subtitle Auto Font Size
- Auto Padding
- Show Border
- Corner Radius
- Show Background Image
- Background Color
- Transparency
- Show Shadow
Having trouble getting help?
Contact Support- Name
- Subtitle
- Description
- Show Value in Tooltip
- Enable Animation
- Show Value Labels
- Value Label Color
- Value Label Position
- Value Label Rotation
- Page Size
- Tooltip Settings
- Legend Alignment
- Axis Settings
- Inverse Axis
- Parameter Support in Axis range
- Single Parameter Value
- Range Parameter Value
- Data Source Field Based Parameter Value
- Font settings
- Filter
- Container Appearance
- Title Alignment
- Title Color
- Title Auto Font Size
- Subtitle Auto Font Size
- Auto Padding
- Show Border
- Corner Radius
- Show Background Image
- Background Color
- Transparency
- Show Shadow
Having trouble getting help?
Contact Support