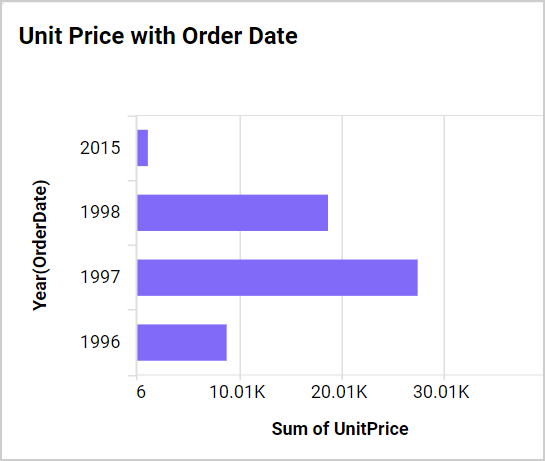
Axis Range Settings
Axis range settings let you override the automatically calculated minimum, maximum, and interval values on the primary value axis. Use these settings when you need the Y-axis to start at a specific baseline, to zoom into a specific value range, or to align scales across multiple widgets on the same dashboard.
| Unsupported widgets |
|---|
| Grid, Pivot Grid, Radial Gauge, KPI Card, Number Card, Pie Chart, Doughnut Chart, Pyramid Chart, Funnel Chart, Tree Map, Heat Map, Map, Azure Maps, Image, Text, Line Widget, Button, Tab Widget, Q&A Widget, Combo Box, Text Filter, Date Picker, Period Over Period, Range Navigator |
Static Range Values
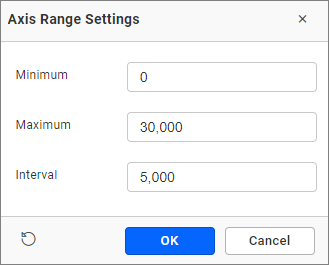
Open the Axis Range Settings dialog and enter numeric values directly for Minimum, Maximum, and Interval.
- Minimum — Sets the lowest value shown on the primary value axis. If left empty, Bold BI uses the minimum value in the dataset.
- Maximum — Sets the highest value shown on the primary value axis. If left empty, Bold BI uses the maximum value in the dataset.
- Interval — Sets the step size between tick marks on the axis. If left empty, Bold BI calculates a suitable interval automatically.
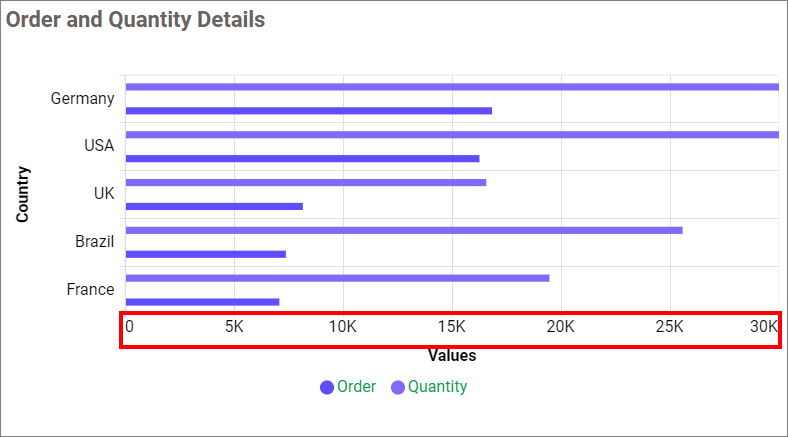
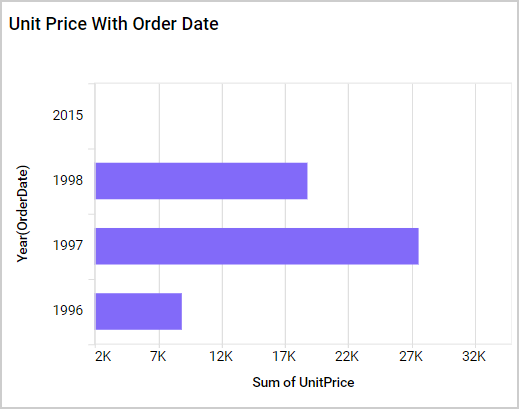
After applying, the chart axis reflects the updated range.
Dashboard Parameter Support
You can drive axis range values dynamically using dashboard parameters. This allows a single chart to adjust its scale in response to filter selections or user inputs without rebuilding the widget.
Only number-type dashboard parameter values are accepted in axis range fields.
To reference a parameter, type @ in the Minimum, Maximum, or Interval text box and select the parameter from the dropdown.
Three types of parameters are supported:
Single Parameter
Stores a single numeric value. Use to set an absolute axis boundary.
-
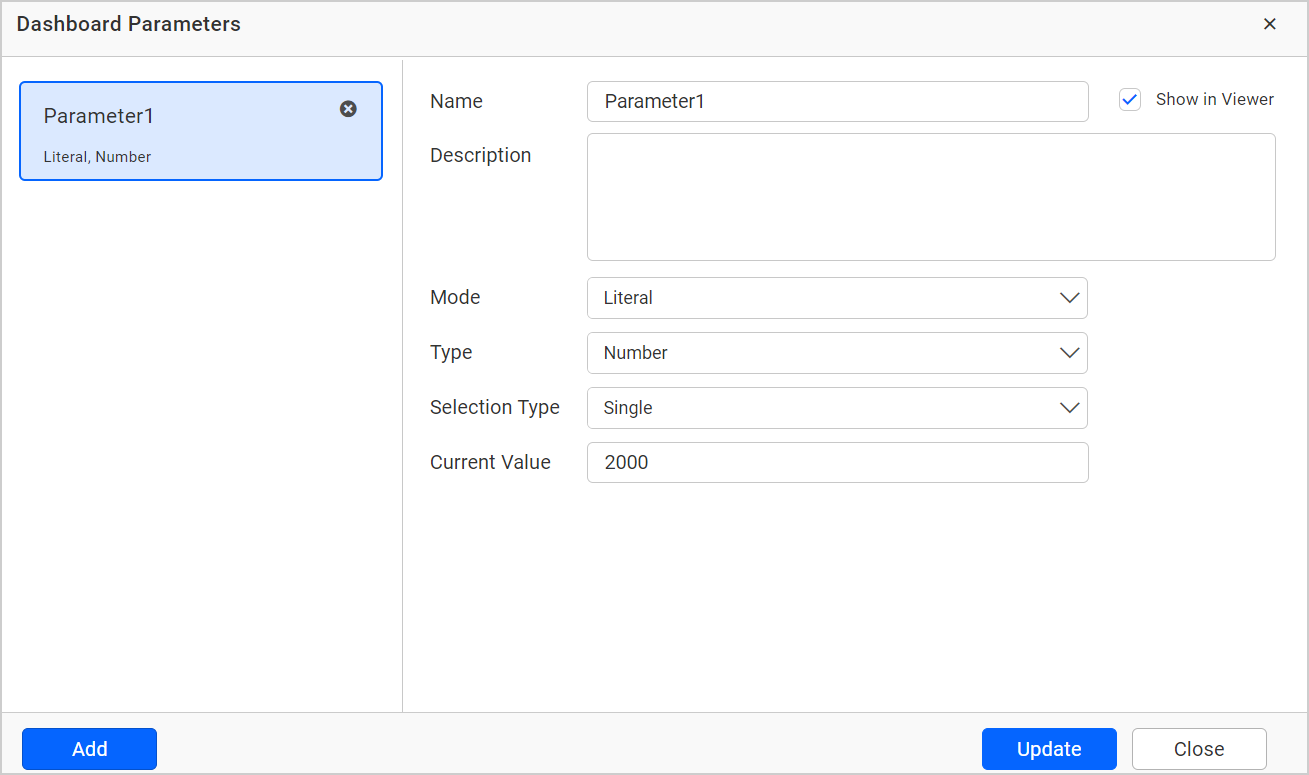
Create a number-type dashboard parameter.
-
In the Axis Range Settings dialog, type
@and select the parameter.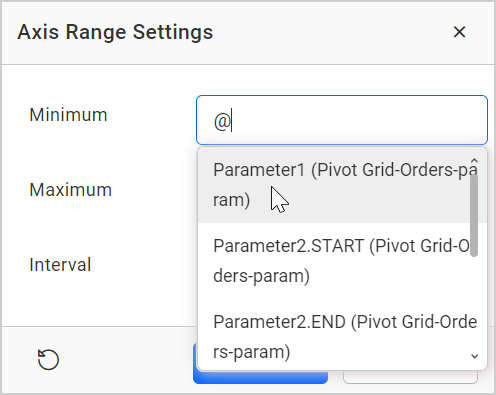
-
The axis updates to reflect the parameter value.
Range Parameter
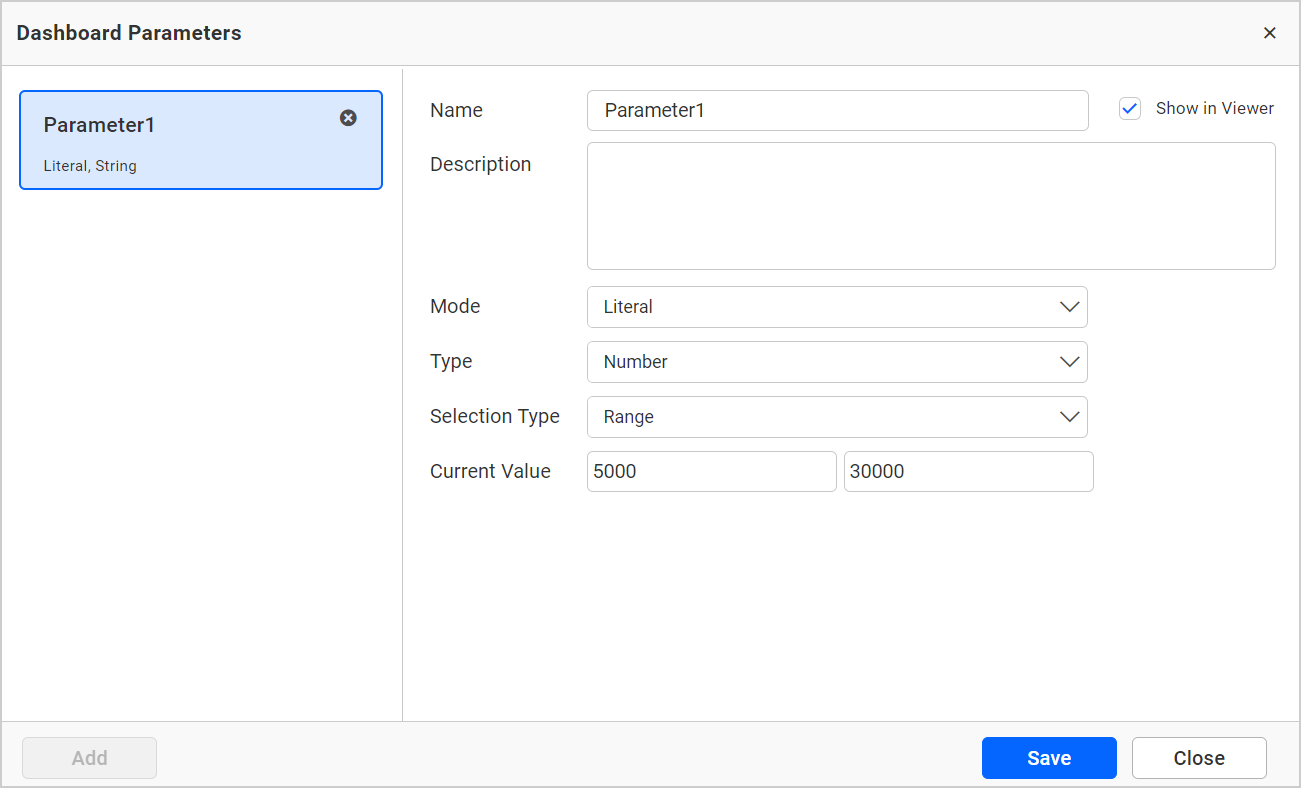
Stores a start value and an end value. Use to control both the minimum and maximum in a single parameter.
-
Create a range-type dashboard parameter.
-
In the Axis Range Settings dialog, type
@in any textbox. The range parameter is split into a start value (applied to the first textbox) and an end value (applied to the second textbox).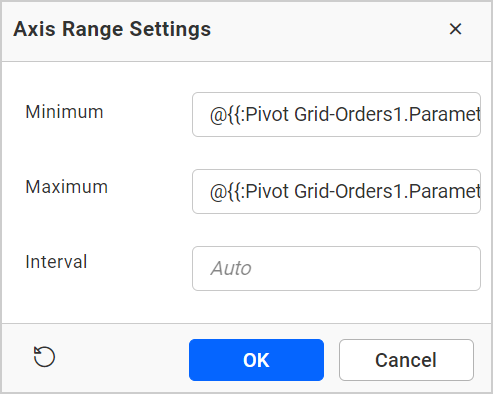
-
The axis updates to reflect the start—end range.
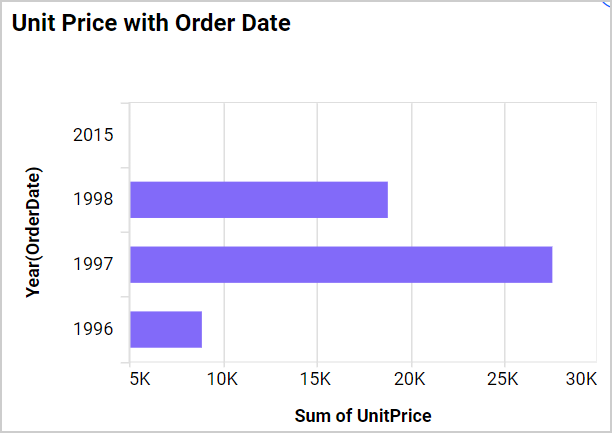
Data Source Field Parameter
Binds the axis range to a value derived from a data source field. Use when the desired axis boundary comes from a data-driven threshold such as a target, budget, or limit stored in a database table.
-
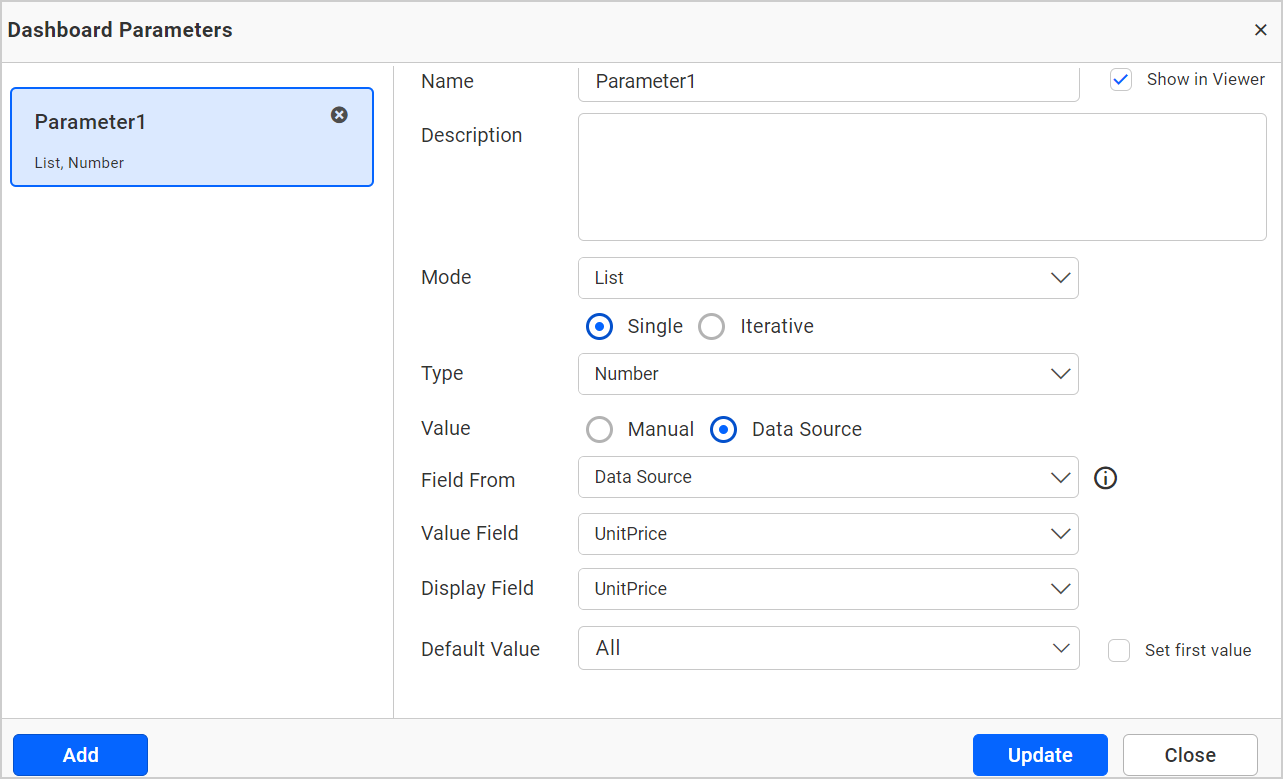
Create a data source—type dashboard parameter and map it to a field.
-
In the Axis Range Settings dialog, type
@and select the data source parameter.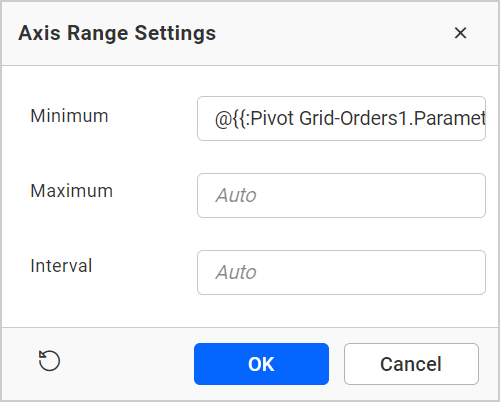
-
The axis updates to reflect the field-based value.