
Forecast Settings
| Unsupported widgets |
|---|
| All widgets except Modern Line, Spline, and eligible Line or Spline series in a Combo Chart |
Forecasting extends an existing time series with predicted values and an optional confidence band. Use it to estimate future values when the chart contains one measure, one supported date-time dimension, and no Row field.
Availability: Forecast settings appear only for a Line or Spline series with one value, one forecast-compatible category field, and no Row field. They are unavailable while the chart is acting as a Period Over Period slave widget.
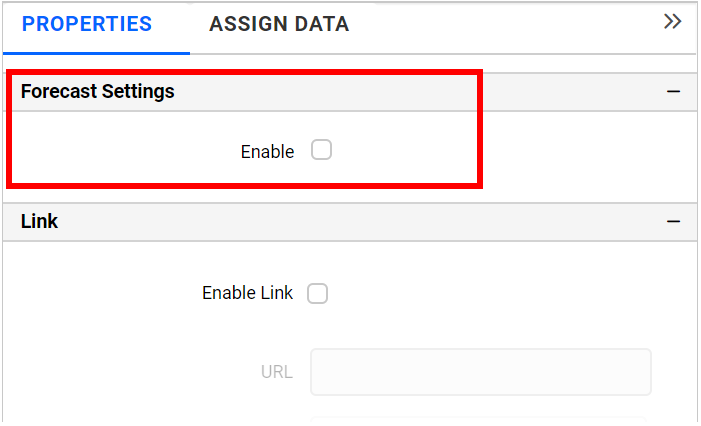
Properties
Enable Forecast
Enables forecast calculation for the configured series.
Forecast Length
Sets the number of future points included in the forecast.
Confidence Interval
Sets the confidence percentage used to calculate the forecast band.
Legend Text
Sets the label used for the forecast series in the legend.
Seasonality
Controls the repeating interval used by the forecast model.
Show Forecast
Shows or hides the predicted series after the forecast has been calculated.
Show Confidence
Shows or hides the confidence band around the predicted series.
Confidence Band Style
Displays the confidence band as Fill, Line, or Dot.
Click the forecast submission button after changing the calculation settings to update the result.