Gridlines
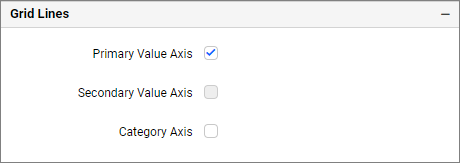
Gridlines are horizontal or vertical lines drawn across the chart plot area at regular axis intervals. They help viewers estimate data point values without needing to trace lines back to the axis ticks. Bold BI lets you toggle gridlines independently for each axis.
| Unsupported widgets |
|---|
| Grid, Pivot Grid, Radial Gauge, KPI Card, Number Card, Pie Chart, Doughnut Chart, Pyramid Chart, Funnel Chart, Tree Map, Heat Map, Map, Azure Maps, Image, Text, Line Widget, Button, Tab Widget, Q&A Widget, Combo Box, Text Filter, Date Picker, Period Over Period, Range Navigator |
Properties
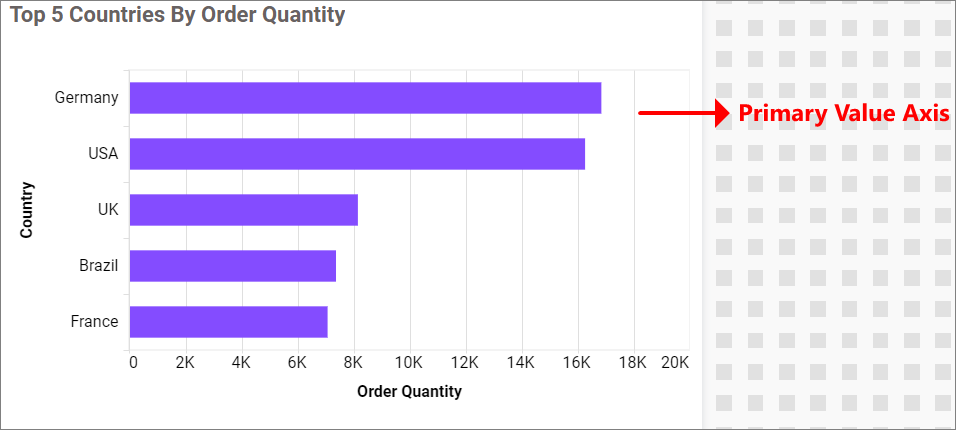
Primary Value Axis
Toggles horizontal gridlines aligned with the primary value axis (Y-axis in column charts, X-axis in bar charts).
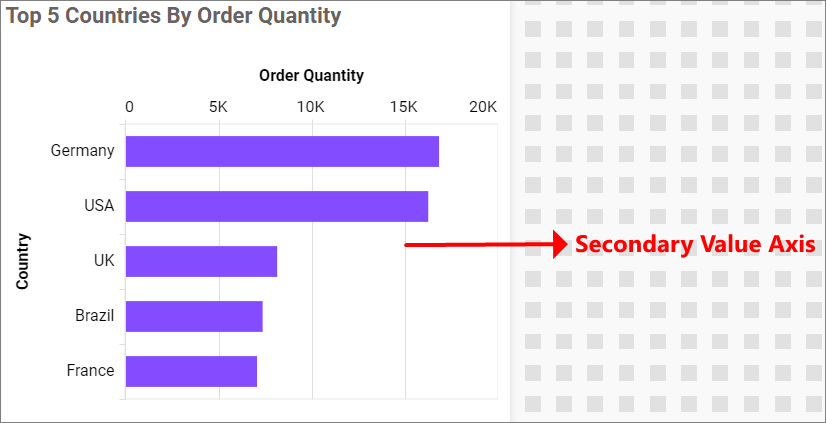
Secondary Value Axis
Toggles gridlines aligned with the secondary value axis, if a secondary axis is configured on the chart.
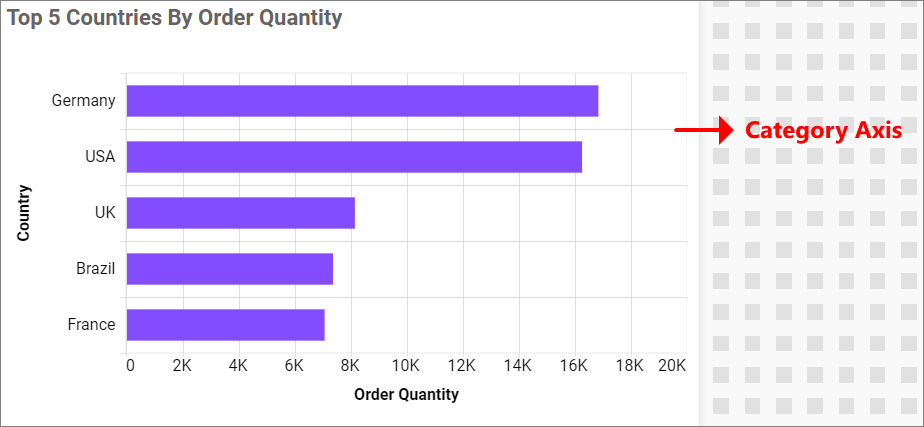
Category Axis
Toggles vertical gridlines aligned with the category axis (X-axis in column charts, Y-axis in bar charts).