
Trendline Settings
| Unsupported widgets |
|---|
| Stacked and 100% stacked charts, proportion charts, maps, tables, cards, gauges, filters, and content widgets |
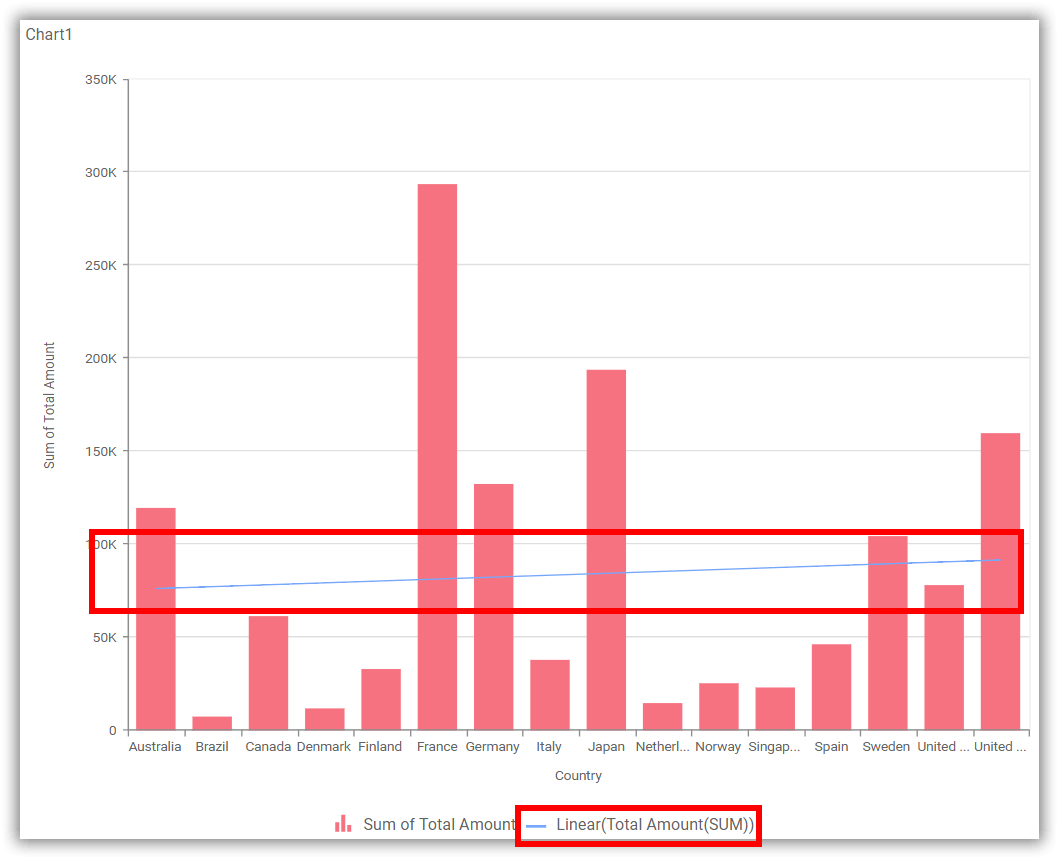
A trendline summarizes the direction or pattern in a chart series. Use it to make growth, decline, or correlation easier to identify without changing the underlying data.
Availability: The Trendline section appears for a supported non-stacked Cartesian chart when the chart has at least one value, exactly one Column field, and no Row field.
Managing Trendlines
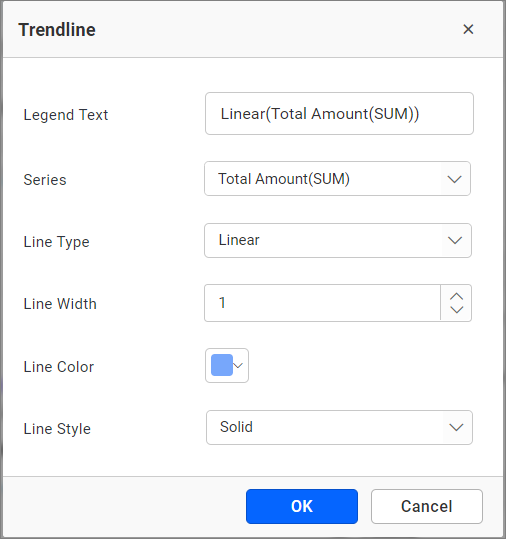
Use the add action to open the Trendline dialog. After creating a trendline, select it in the property grid to edit or delete it.
Properties
Series
Selects the chart series used to calculate the trendline.
Type
Sets the trendline calculation type available for the selected series.
Color
Sets the trendline color.
Additional settings in the dialog control the line presentation and legend text when supported by the selected trendline type.