Debugging the Custom widget through designer
- Create a new Custom widget
- Add debugger in the source file
- Publish the Custom widget
- Debug the custom widget
create a custom widget
Follow the steps outlined in the link to create a new custom widget.
Add debugger in the source file
Place the debugger in the src/sourcefile.js of the custom widget.
Publish the custom widget
Follow the steps in the link to publish the custom widget.
Debug the custom widget
Navigate to the Bold BI Designer.
Right-click on the browser and select Inspect.
Now, drag and drop the custom widget into the designer to debug the code, as shown in the image below.
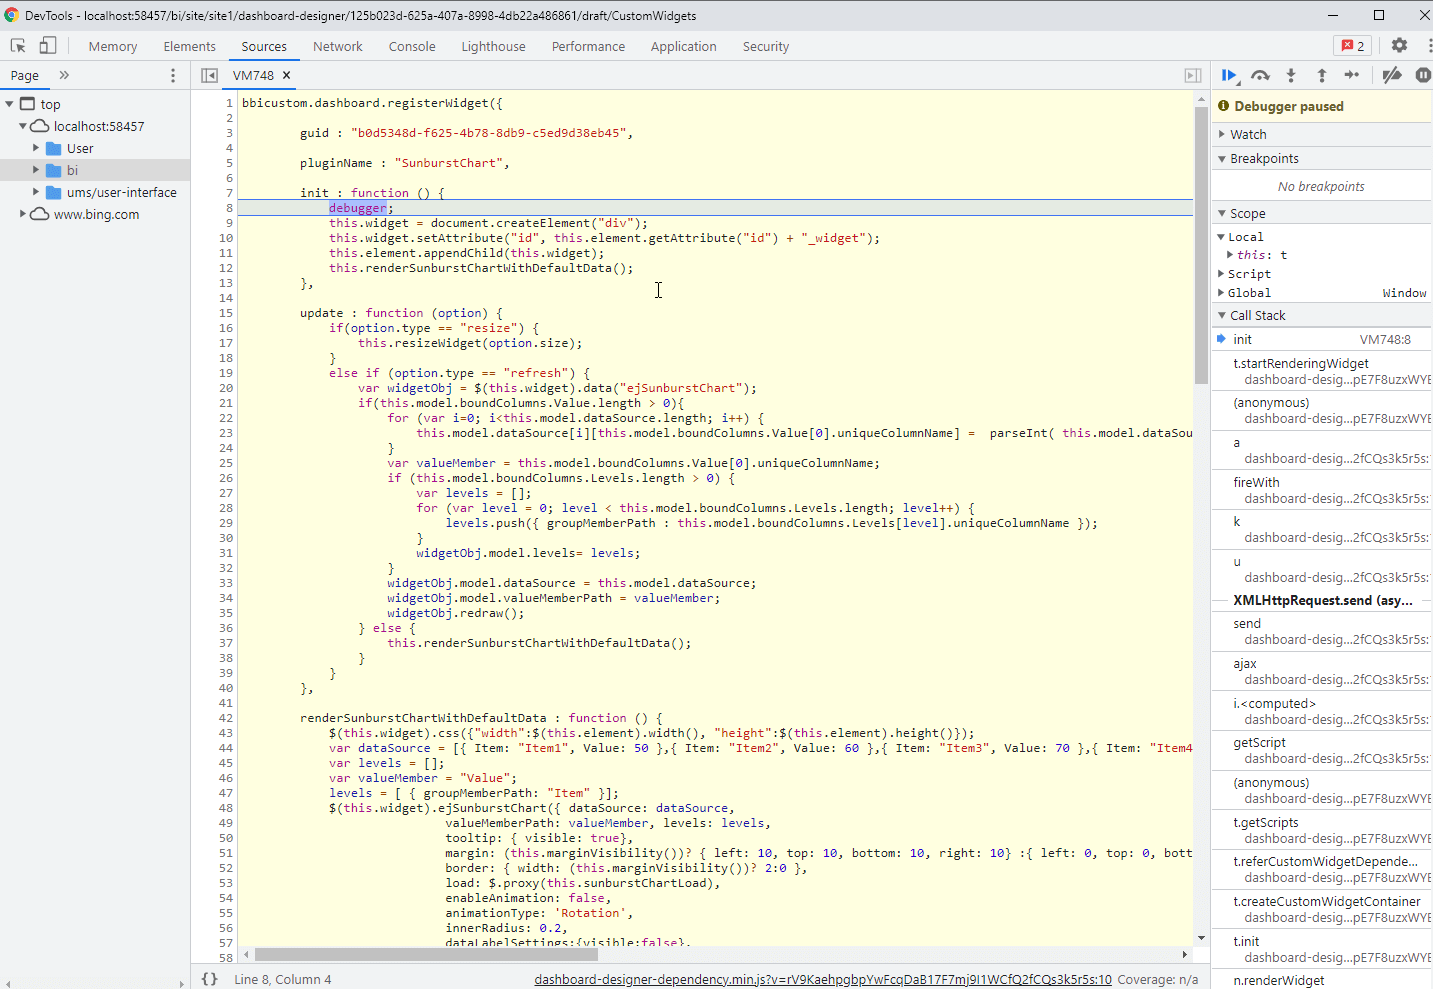
Now, we can debug the init and update methods in the custom widget.
NOTE: This feature is available in On-Premises Deployment but not in Syncfusion Managed Cloud Server.