Q&A Widget
The BoldBI Q&A feature is an advanced AI-powered tool that simplifies the process of converting data into visual charts by using natural language commands. It employs sophisticated AI algorithms to comprehend your queries and crafts relevant charts and graphs, streamlining the process of data investigation and dashboard creation.
Note: The Q&A feature, driven by OpenAI technology, requires the submission of your data structure alongside the question for natural language processing evaluation. We place the highest importance on the confidentiality and protection of your data, in strict compliance with our privacy policies.
Guide on Utilizing the Q&A Widget
The Q&A widget utilizes its artificial intelligence to intelligently select the appropriate widget and automatically allocate the data in response to user requests made in simple language.
Using Q&A widget in On-Premise BoldBI
For users to leverage the advanced capabilities of the Q&A widget within Embedded BoldBI, configuring either the AI key and model for OpenAI or the AI key, resource name, and deployment for AzureAI is essential. The Q&A widget operates on the finely tuned GPT 3.5 model specifically optimized for BoldBI.
To ensure optimal performance within the BoldBI environment, the GPT 3.5 model is tailored to meet BoldBI’s unique requirements using the Fine-tuning utility. This process customizes the model’s functionalities, allowing for a seamless integration and enhanced AI-driven insights within the Q&A widget.
For detailed instructions on configuring either the AI key and model for OpenAI or the AI key, resource name, and deployment for AzureAI within BoldBI, please refer to the following link: Fine Tuning Utility and proceed with the following instructions.
How to add Q&A widget
Drag the Q&A widget from the dashboard’s item panel, present under the Miscellaneous group.
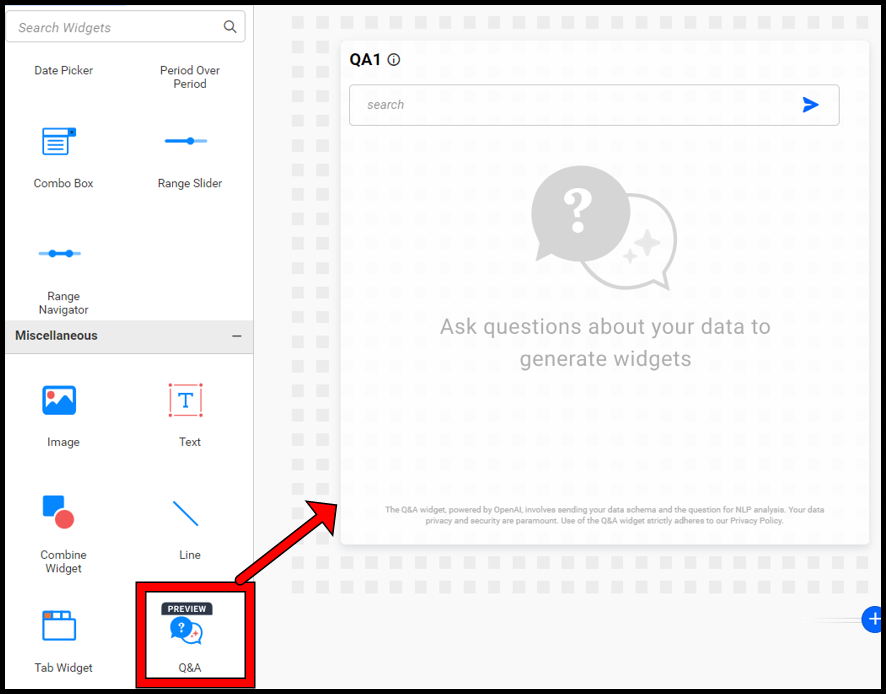
Now, resize the container as required to drag multiple widgets in it.
Questioning the Q&A widget
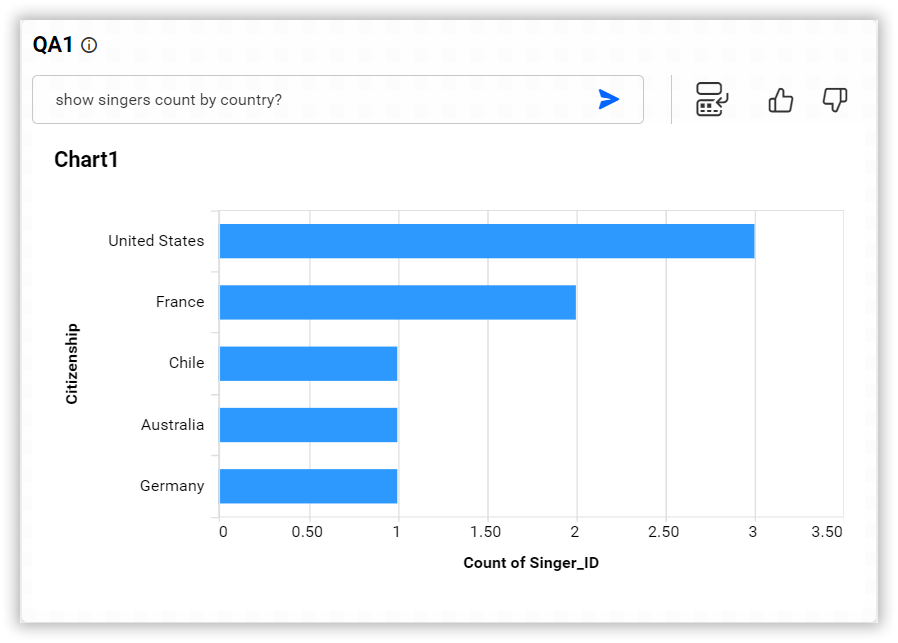
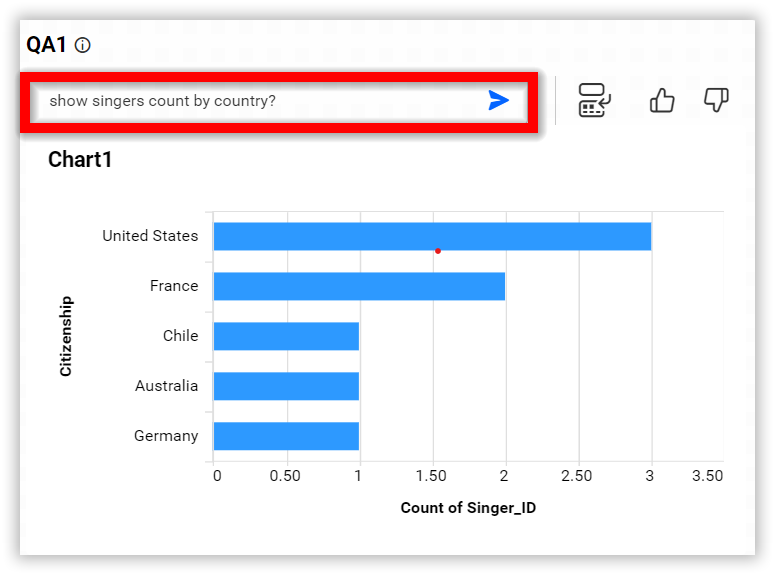
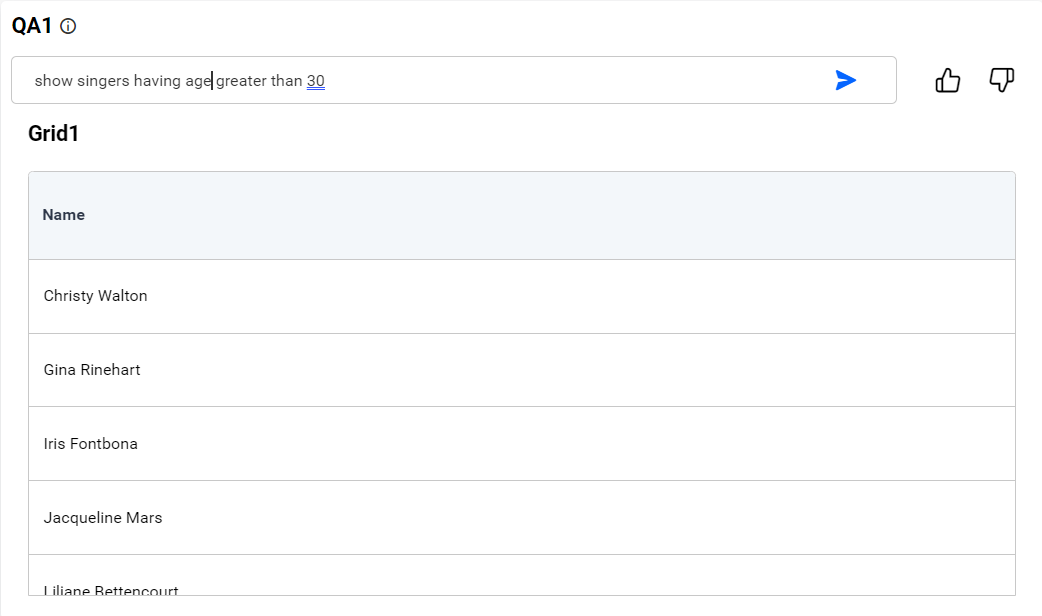
The Q&A widget features a search bar where users can enter their queries. Begin by stating the desired information in conversational language. For instance, you might input, Show sales by region.
Our AI system will understand your question phrased in everyday language, determine the relevant data, and select the appropriate chart format. The Q&A widget takes into account previous questions when responding to the current query, providing tailored responses to meet user preferences.
Afterward, the Q&A tool will create the visual representation of the data you requested, drawing from the dataset you have provided.
Provide feedback to the generated chart
Review the generated chart and provide feedback by clicking like or dislike.
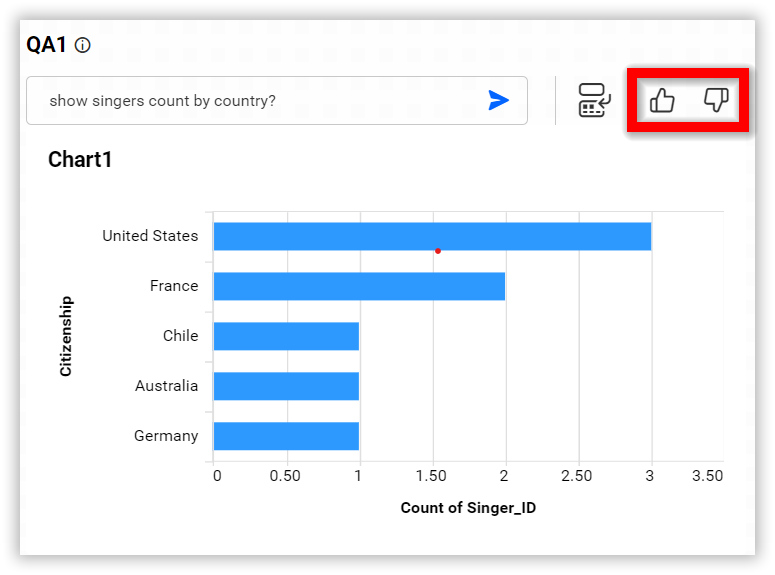
When you select the dislike option, a prompt will appear, allowing you to inform the BoldBI team about your reasons for disliking. This action will generate an email to the BoldBI team that includes the question, the data source’s column names relevant to the widget in question, and any error logs. Your feedback will be used to enhance the AI model.
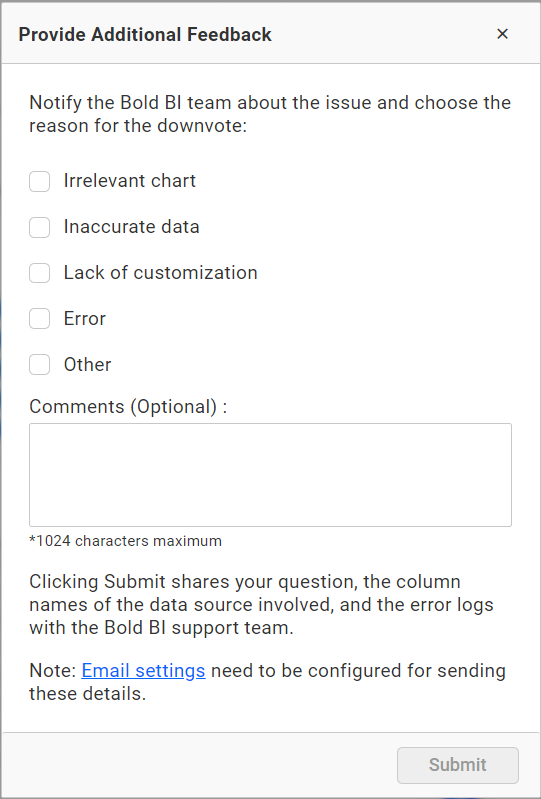
The email will be sent from the email configured in the Email settings.
Transforming the Q&A Widget into a Regular Widget
You have the option to transform the widget generated from the Q&A into a regular widget, which provides additional customization features to tailor the chart according to your preferences.
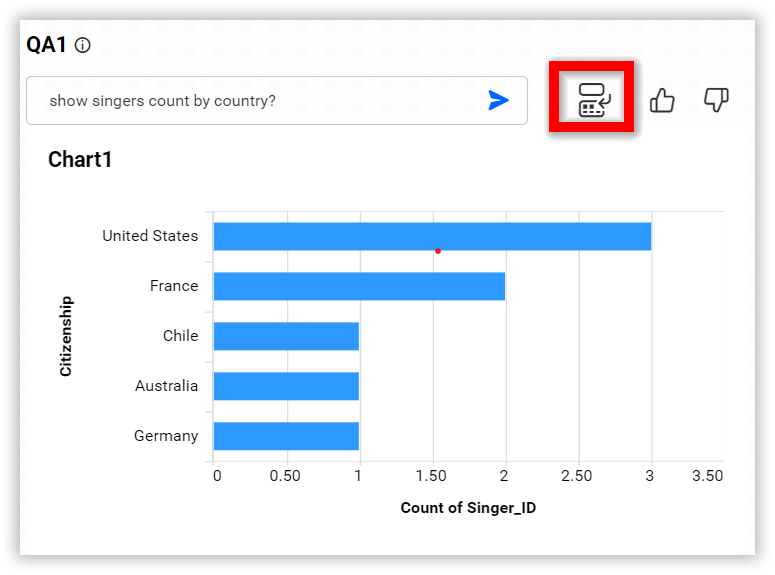
To initiate the transformation, select the Convert to standard widget icon. This action will change the current Q&A widget into a regular widget, maintaining the same dimensions. After conversion, it will function just like any other standard widget, ready for further customization.
Note: Once converted, it is not possible to revert to the Q&A widget. Should you require modifications to the question, please proceed by incorporating a fresh Q&A widget within the designer.
View Mode for Questions and Answers Feature
The Questions and Answers feature can be deployed on the dashboard, enabling end users to pose questions to the linked data sources within the dashboard and view the resulting charts.
Limitations
-
Currently, the Q&A widget does not support the following chart types: Scatter chart, Radar polar, all charts in the Relationship widget category except for grid chart, KPI card, and charts in the Deviation, Filters, Composition, and Miscellaneous categories.
-
An active internet connection is required for fine-tuning the model as the process utilizes the OpenAI GPT 3.5 model which relies on OpenAI’s cloud services.
-
Currently, only questions in the English language are supported.
-
The Master-Slave widget filters cannot be applied to the Q&A widget, rendering it unable to function as either a Master or Slave widget.
-
Dashboard parameters or custom attributes cannot be utilized with the Q&A widget.
-
Customization and formatting of charts through natural language are not supported in the Q&A widget.
Best Practices for Use
Improvements to the AI model will be implemented progressively, informed by user input. Should an error arise when posing a question, consider revising it with these guidelines:
-
Enclose string or date values within quotation marks. For instance, use “Show the orders on date
07/06/2023.” -
Ensure column names match those in the data sources exactly.