Previewing Dashboard
You can preview the currently opened dashboard by clicking the Preview button in the top right corner of the tools pane.
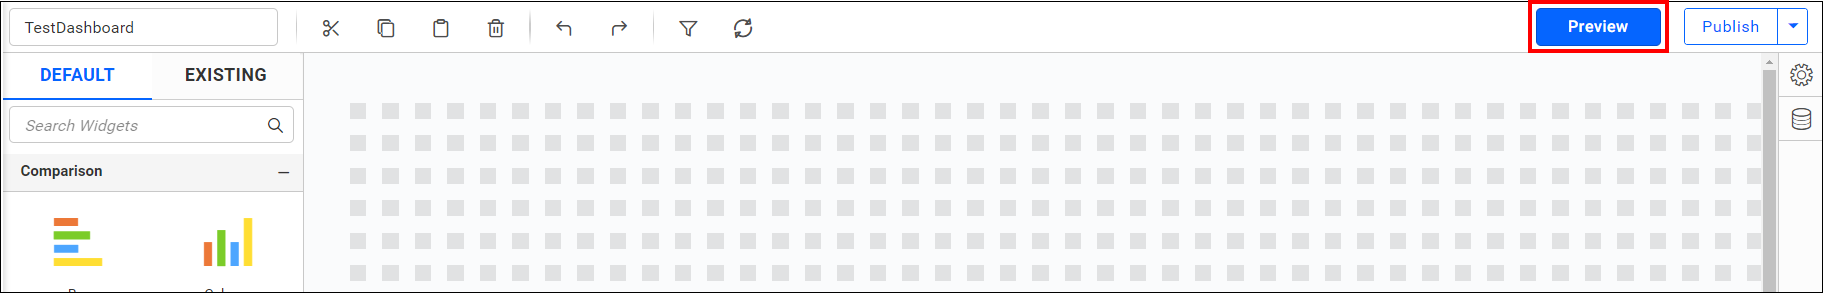
The preview button is visible across all window tab views in the Dashboard Designer, allowing you to preview the dashboard from anywhere within the application.
Previewing dashboard using dashboard viewer
The dashboard can be previewed using the built-in dashboard viewer, which opens in the default web browser.
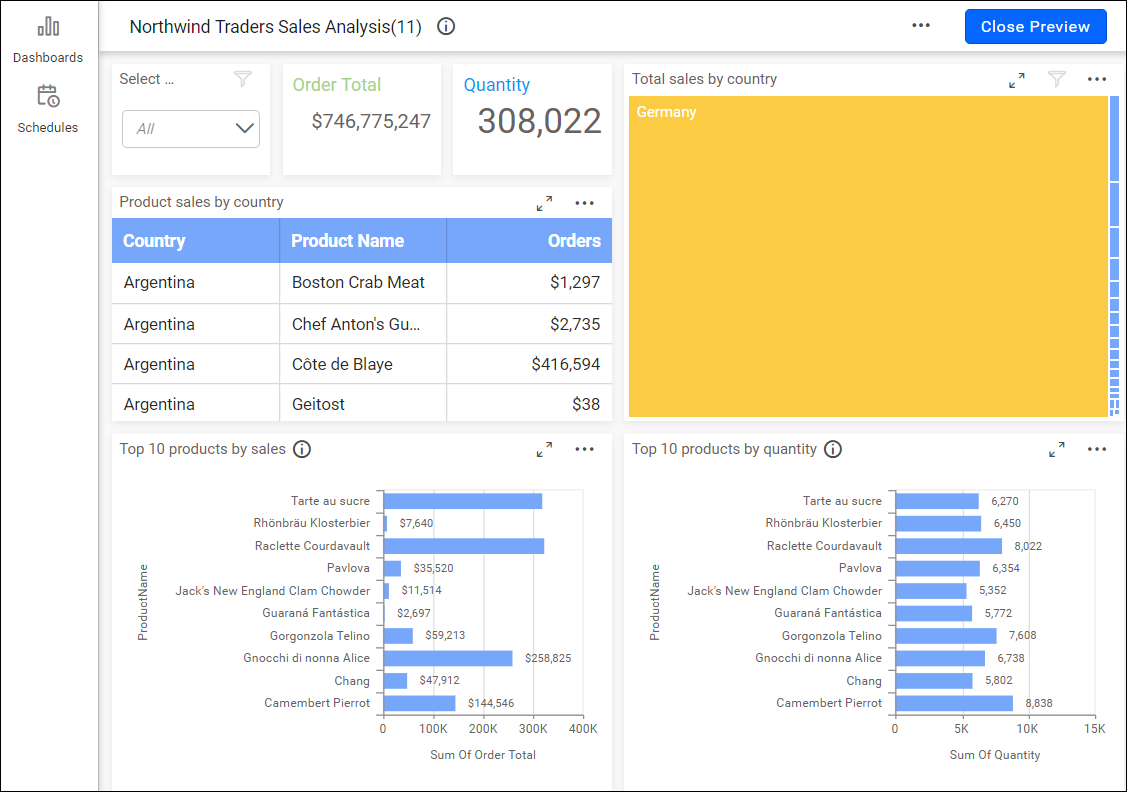
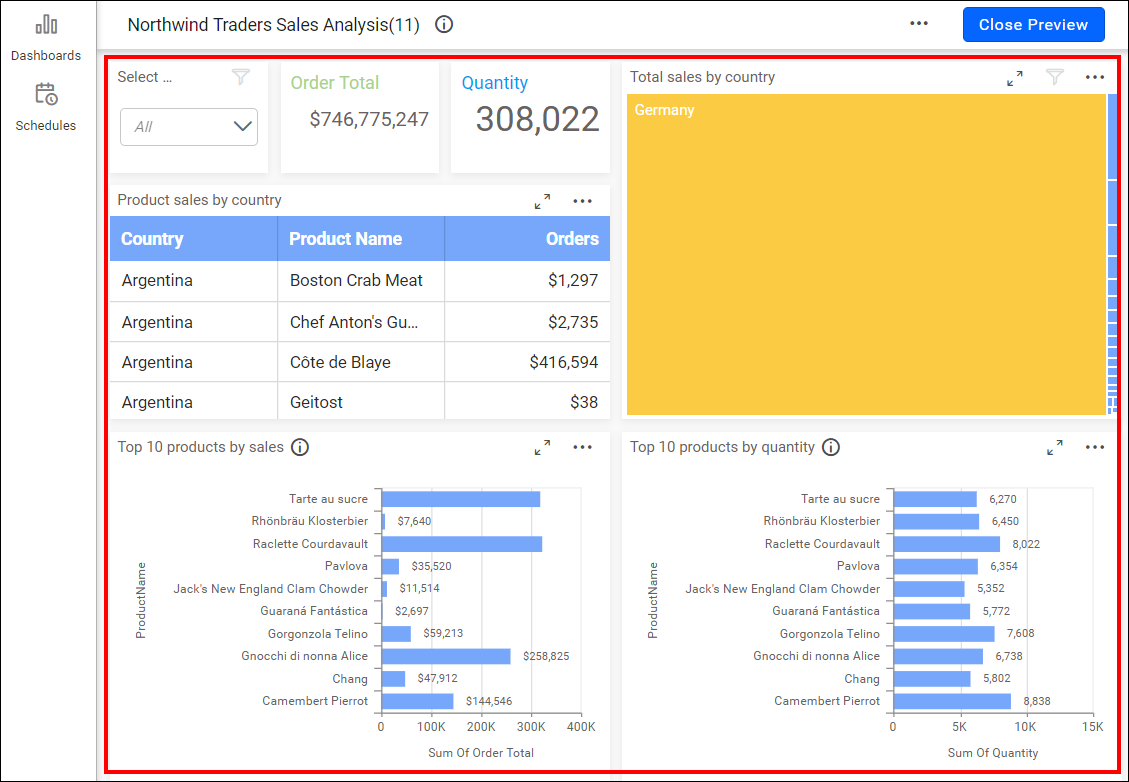
The dashboard viewer can be split into two sections: Title and Content, as shown in the following screenshot.
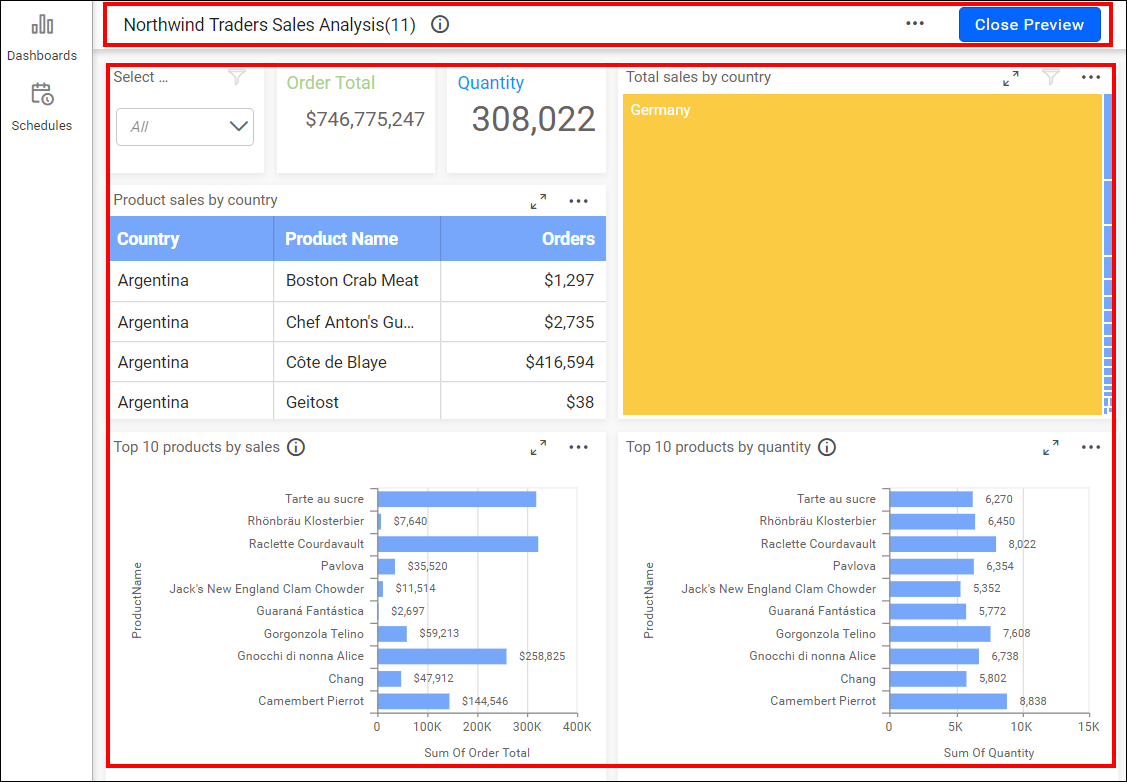
The Title section contains the dashboard title and description (viewed by clicking the i icon next to the title) that were set in the Dashboard Designer before publishing.
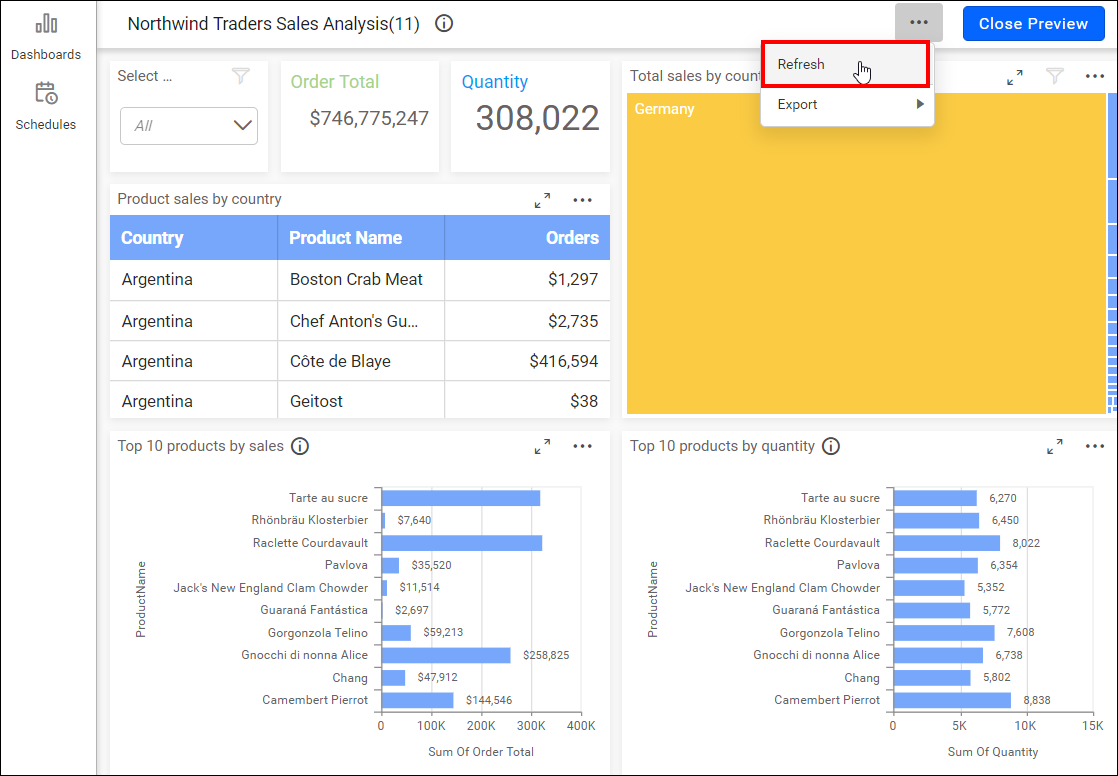
The update and export operations of the dashboard can be handled at runtime by using the highlighted icon below.
The Content section contains the complete content of the dashboard design area in Dashboard Designer.
You can interact with dashboard widgets in the viewer and apply filters on top of other widgets based on the dashboard filters configuration made in the dashboard through Dashboard Designer.
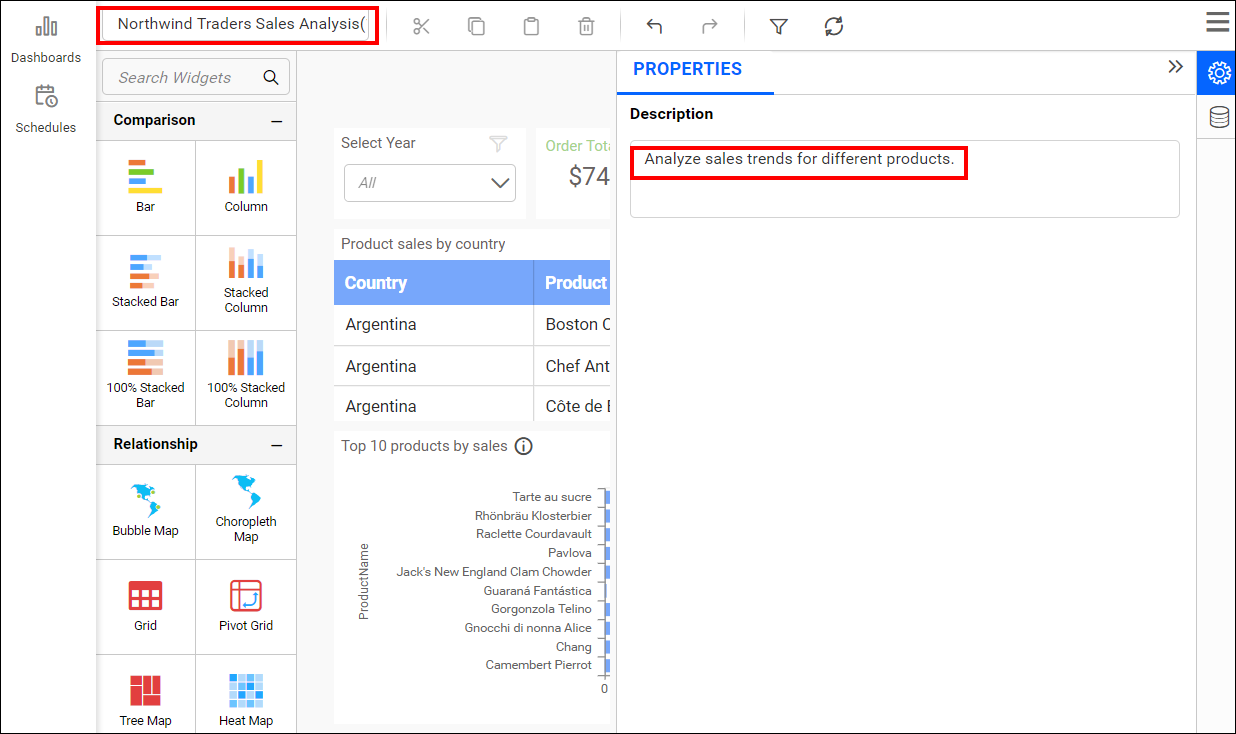
Each widget in the dashboard viewer is split into two sections: Title and Content.
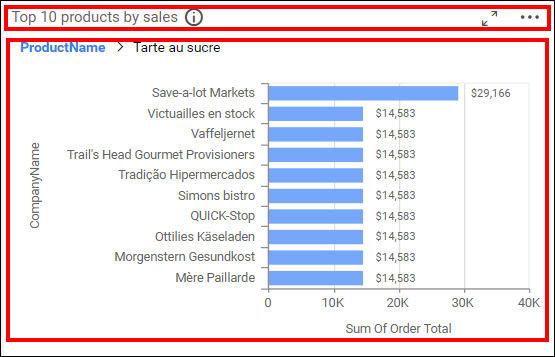
You can edit the title of the widget before previewing it.
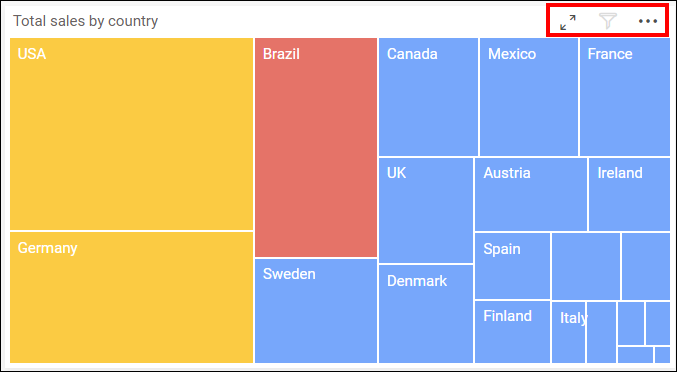
It also includes options such as maximize, drop-down menu, and filter status at the right end.
Learn how to save your designed dashboard
Post your message
If you are still unable to find the information you are looking for in the self-help resources mentioned above, please contact us and send us your requirements.