
Configuring Data Relationship
In data modeling, relationships between tables are essential for organizing and analyzing data effectively. A Data Relationship defines how data in one table connects to data in another, enabling seamless integration and accurate reporting. By configuring relationships such as One-to-Many, Many-to-One, and Many-to-Many, users can build more dynamic and scalable dashboards. These relationships eliminate the need for complex joins and improve query performance, making it easier to visualize and interpret data across multiple sources
Data Relationships
In addition to traditional joins, Bold BI Embedded now supports One-to-Many, Many-to-One relationships between tables.
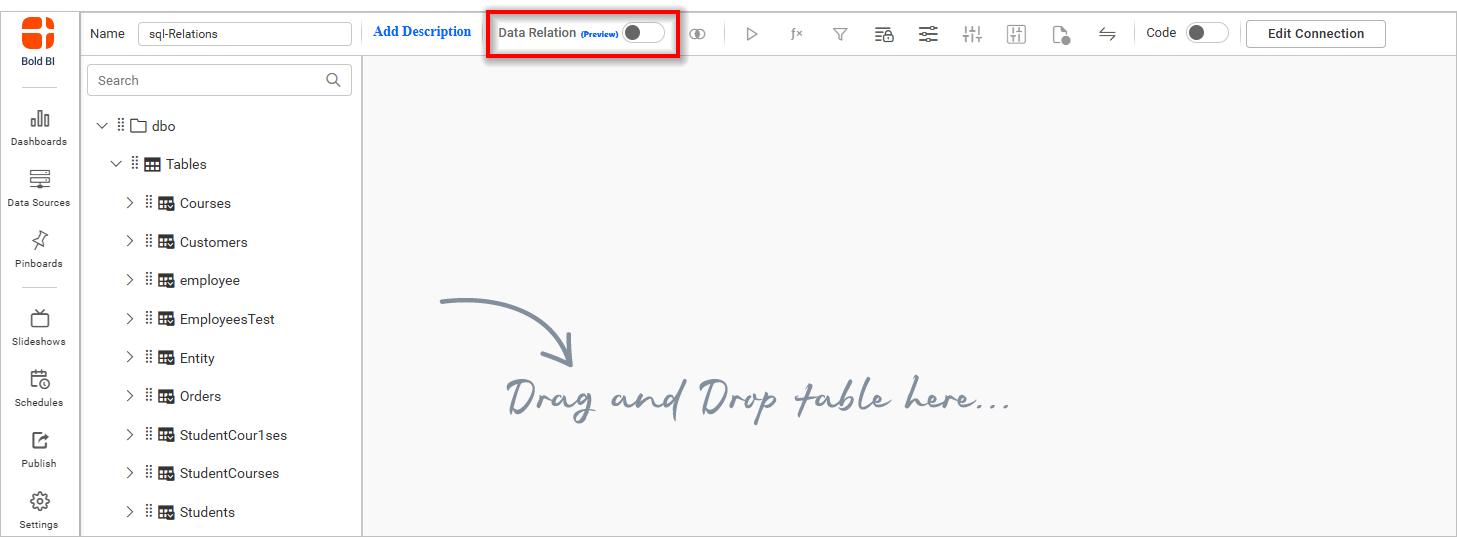
If the Relation toggle is enabled and two tables are dragged and dropped, the Join icon will act as a Relation icon.
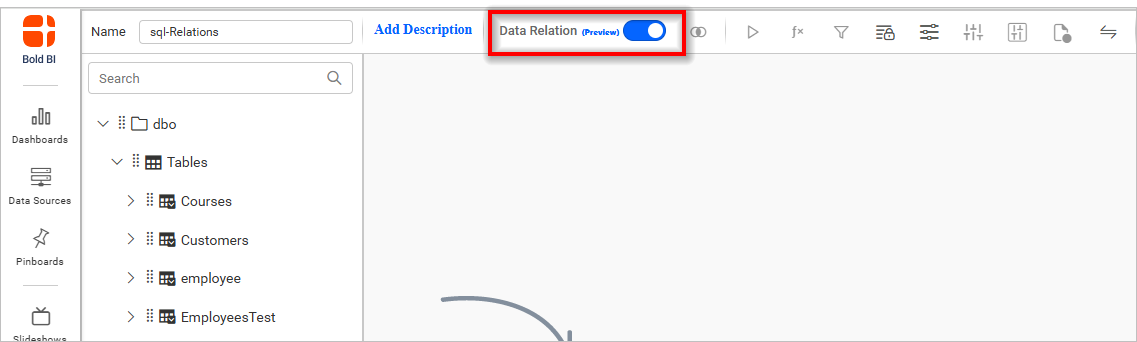
In the Data Design View, the Join icon in the tools pane will be disabled if only one table is present in the Table Design View.
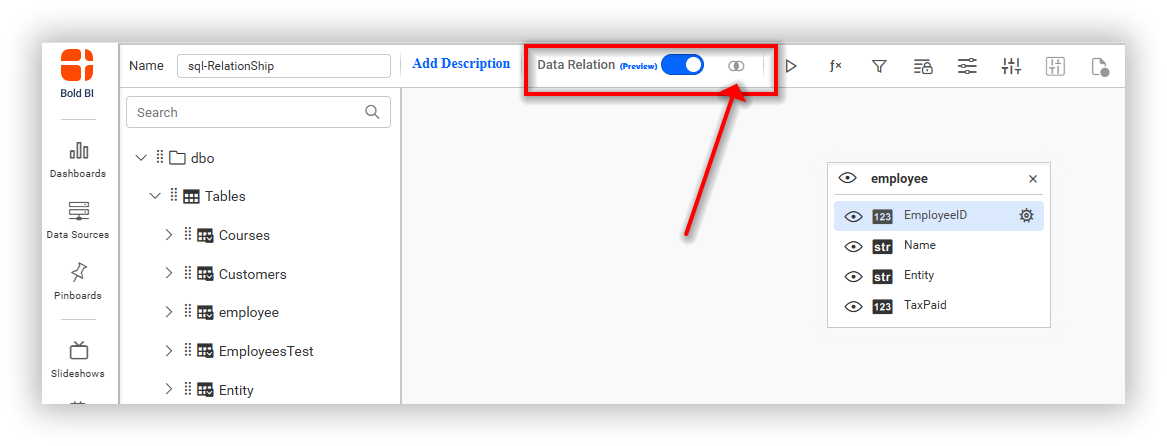
Once a second table is added (dragged and dropped), the Join icon becomes enabled and functions as a Relation icon.
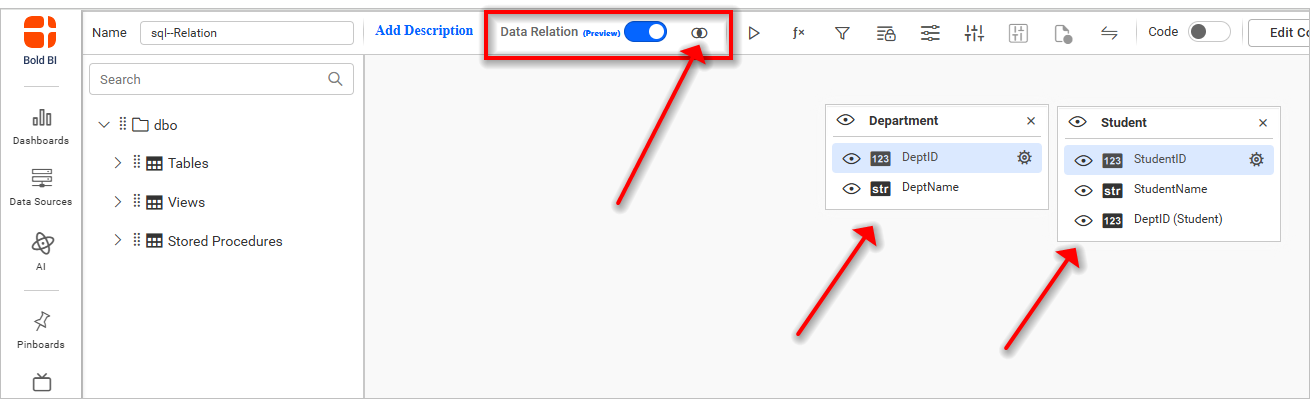
Attempting to add the same table again in the Query Designer displays an alert message because self-referencing relationships are not supported in Bold BI.
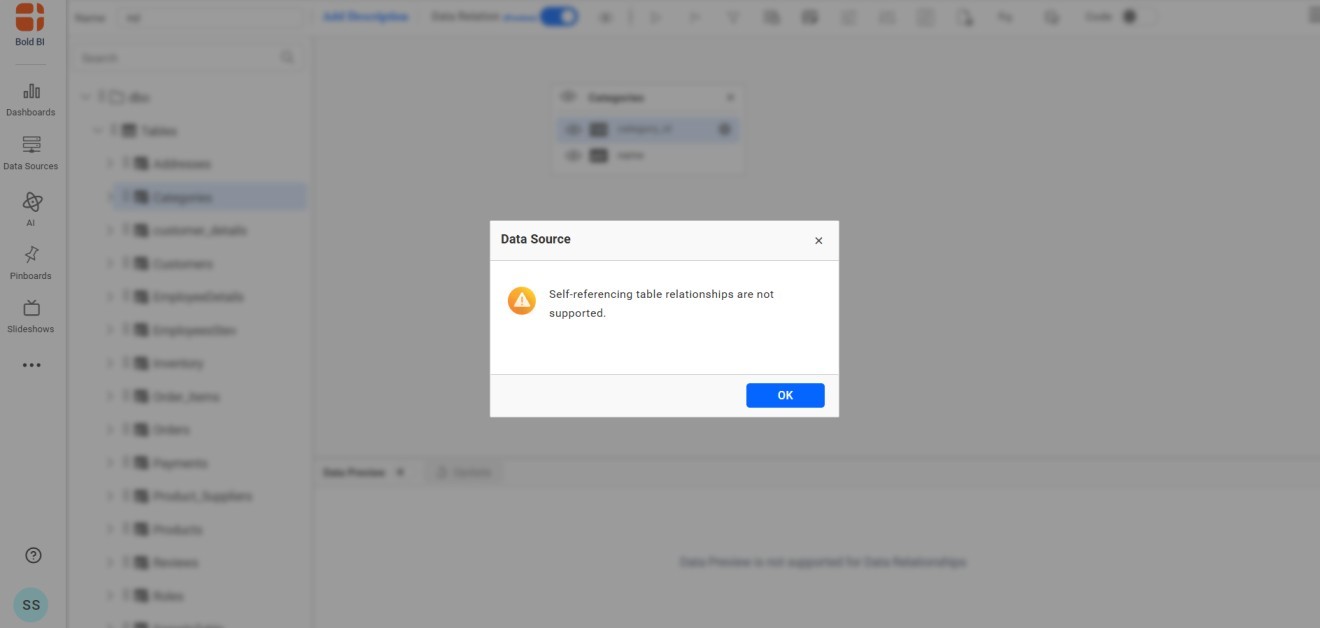
NOTE: If the Relation toggle is disabled, dragging and dropping two tables will allow the Join icon to function as a Join tool, not a Relation tool.
Why Use Relationships in Tables?
Relationships help:
- Avoid data duplication
- Maintain data integrity
- Enable complex queries (e.g., join tables)
- Organize data logically (e.g., students in departments)
Currently Bold BI supports Relationship
- One-to-Many Relationship
- Many-to-One Relationship
One-to-Many Relationship
In a One-to-Many relationship:
One record in Table A can be related to many records in Table B, But each record in Table B is related to only one record in Table A
- One Department has many Students
- Each Student belongs to one Department
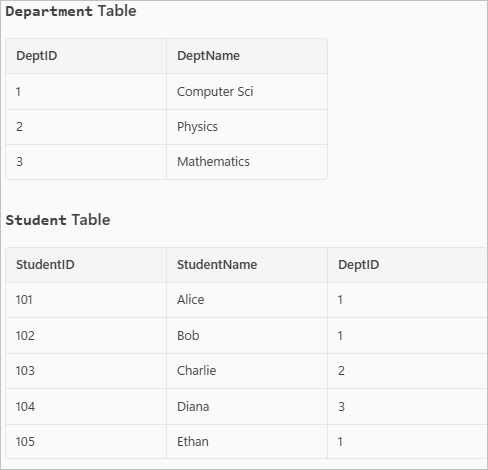
How to configure the One to Many relationship in Bold BI
-
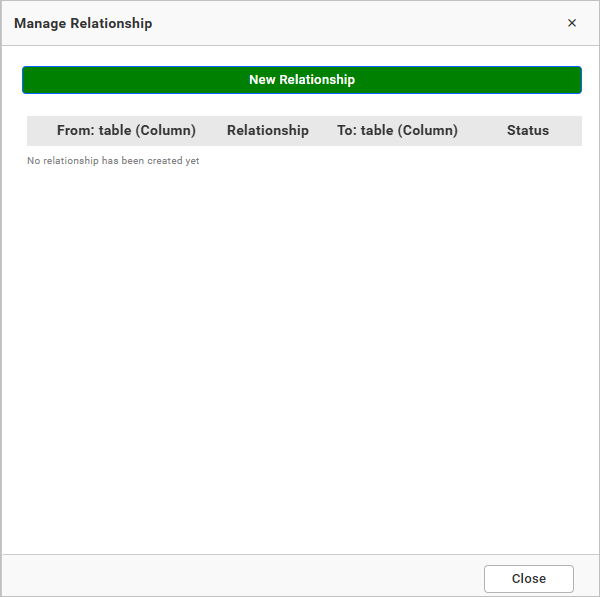
After enabling the Relation icon and dragging and dropping two relationship-supported tables (as discussed above), click on the Join icon. A popup window will appear to manage the relationship.
-
Click on the “New Relationship” button to begin creating a relationship between tables.
-
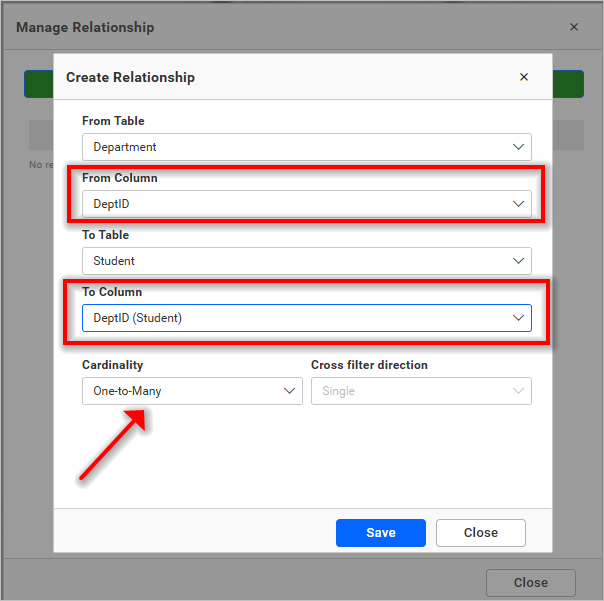
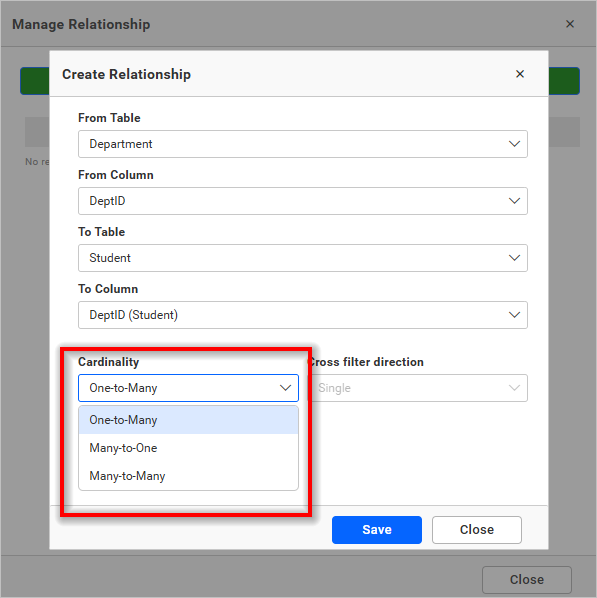
Choose the “From Table” and “To Table” to define the direction of the relationship.
-
Validate the relationship columns by selecting the appropriate key columns from each table that define the connection.
-
Relationship cardinality is automatically determined using the first 1,000 records from the selected tables. You can review and adjust the cardinality manually if required..
-
Click the “Save” button to confirm and create the relationship.
-
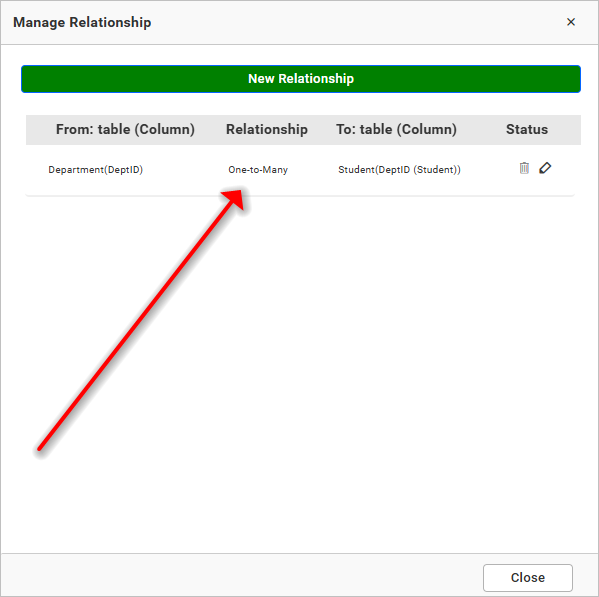
The relationship will then be saved and managed within the Manage Relationships window.
-
From there, you can edit or delete existing relationships, or view their status as needed.
-
Save the data source after configuring relationships.
-
Proceed to design the dashboard using appropriate widgets.
-
Use the related tables to bind data to widgets and visualize meaningful insights.
-
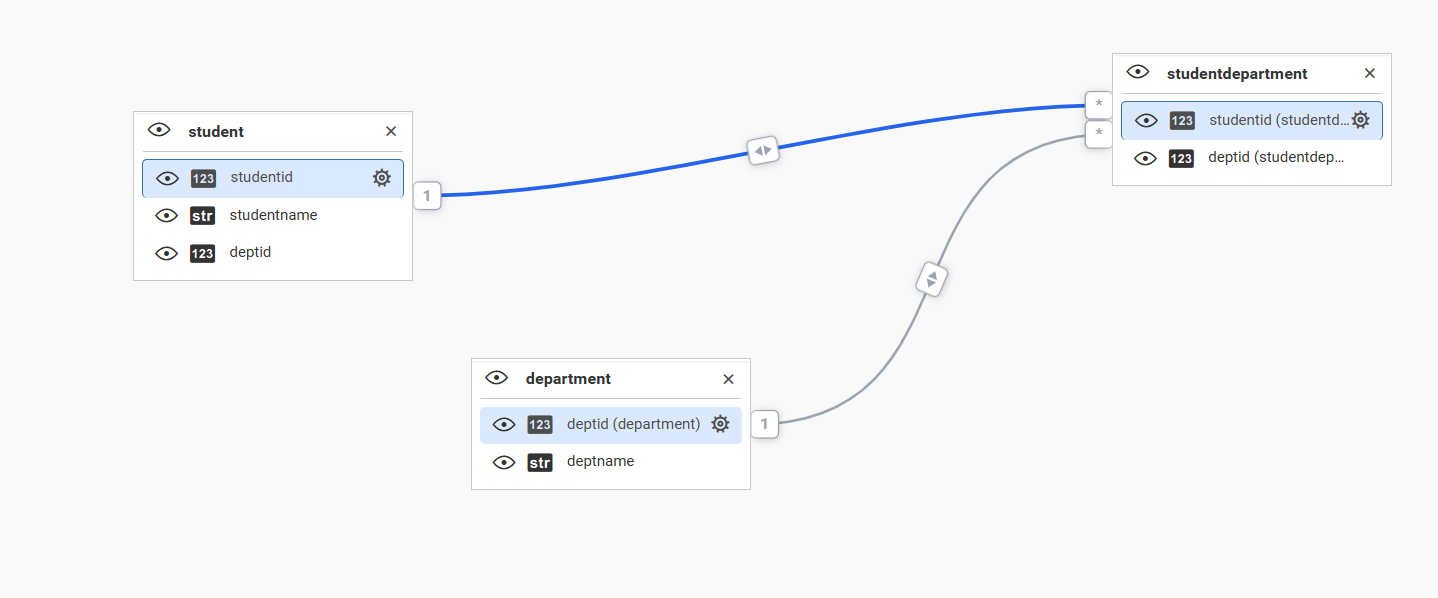
After configuring a relationship, it is represented by a line between the tables. Hover over the line to view the columns used to form the relationship.
Demonstrating Data Differences: Join vs Relationship
-
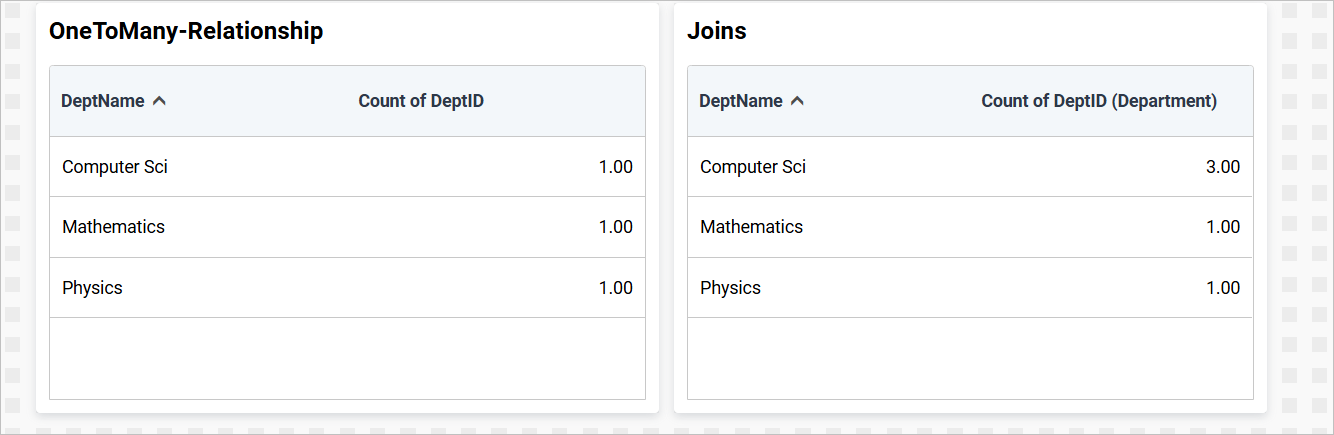
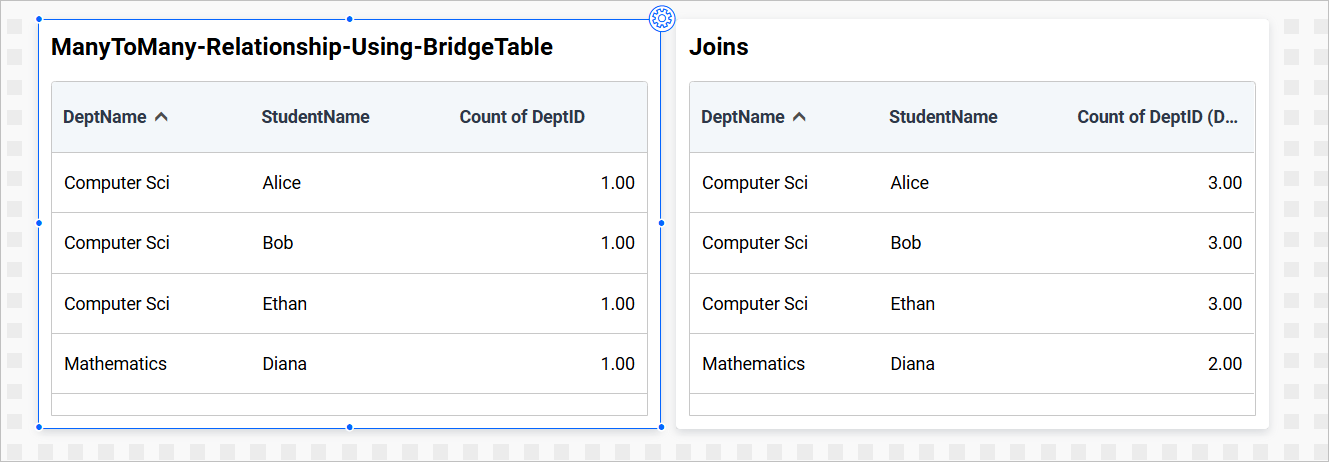
The data differences between Join and Relationship have been demonstrated using the following images.
-
We used the same column from both tables to highlight how:
-
Joins may result in duplicate or mismatched records if not properly configured.
-
Relationships help maintain data integrity and eliminate duplicates through structured linking.
How to configure the Many to One relationship in Bold BI
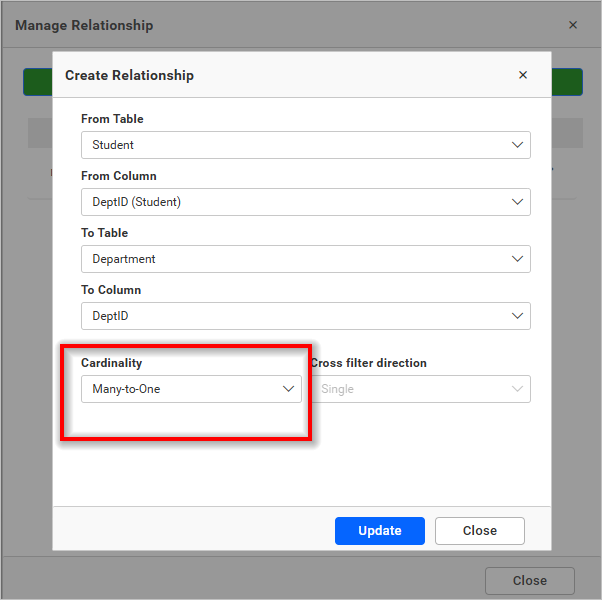
A many-to-one relationship occurs when multiple records in one table are associated with a single record in another table.
- Many records in Table A can be related to one record in Table B
- But saying each record in Table B is related to many records in Table A
From Table A to Table B: Many-to-One (e.g., many students belong to one department)
How to configure the Many to Many relationship in Bold BI using Bridge Table
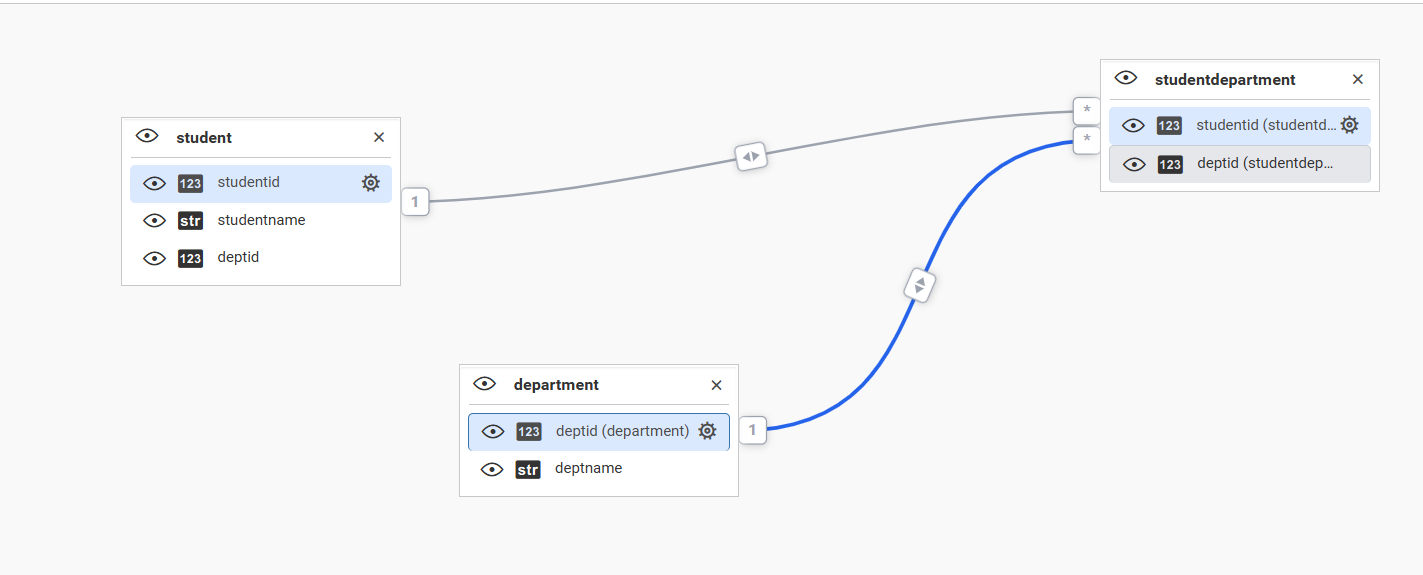
To set up a Many-to-Many relationship in Bold BI using the example of Students, Departments, and a bridge table StudentDepartment, follow these steps:
Tables Involved
- Students
- Departments
- StudentDepartment (Bridge table)
Steps to Set Up in Bold BI
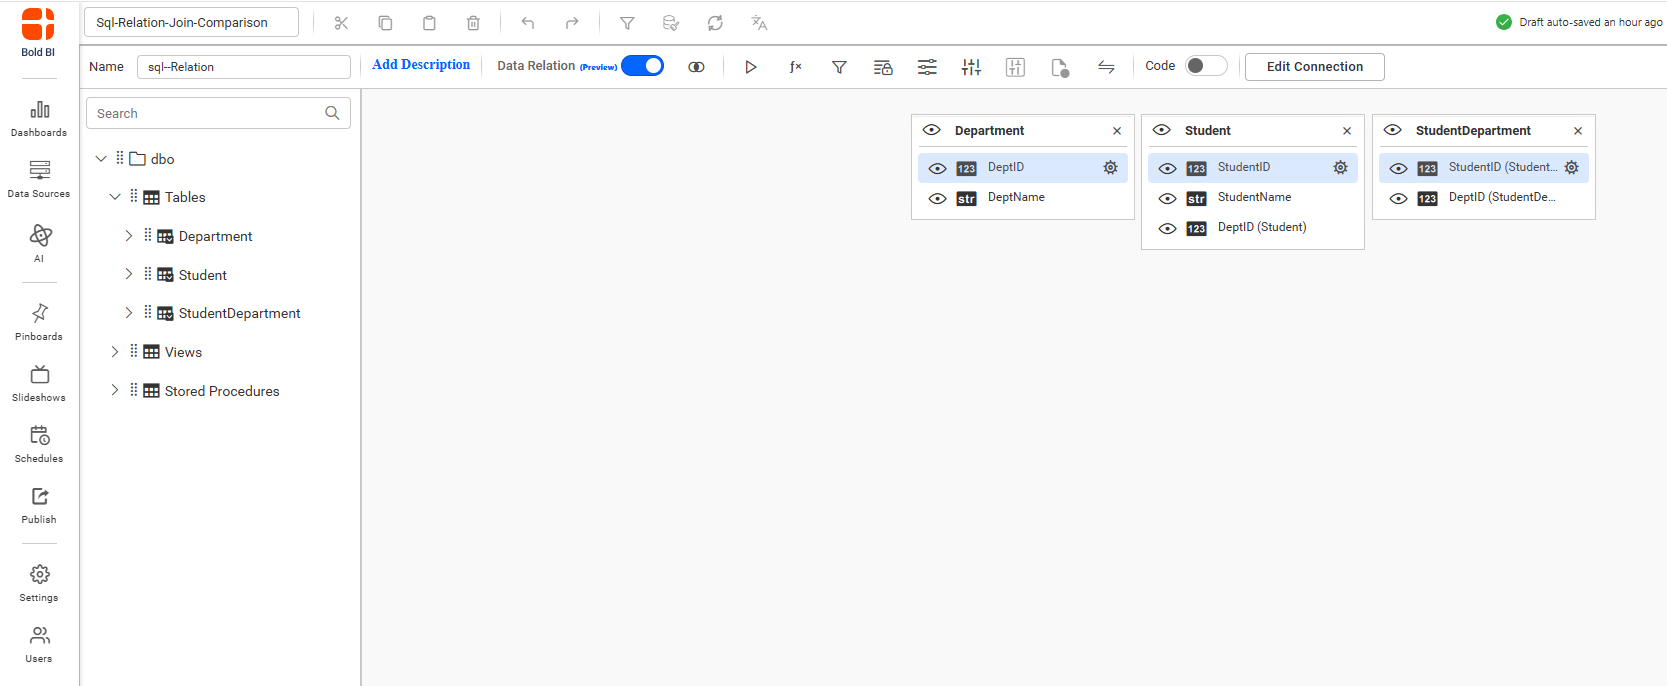
- Load the Tables
Import all three tables (Students, Departments, StudentDepartment) into Bold BI.
- Define Relationships
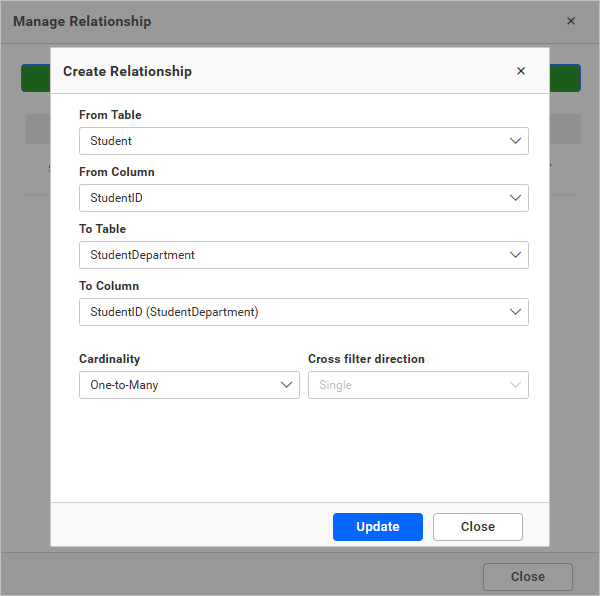
Go to Manage relationship by clicking the join icon in Bold BI BI and create the following relationships:
Column : Students[StudentID] → StudentDepartment[StudentID]
Cardinality: One-to-Many
Column : Departments[DepartmentID] → StudentDepartment[DepartmentID]
Cardinality: One-to-Many
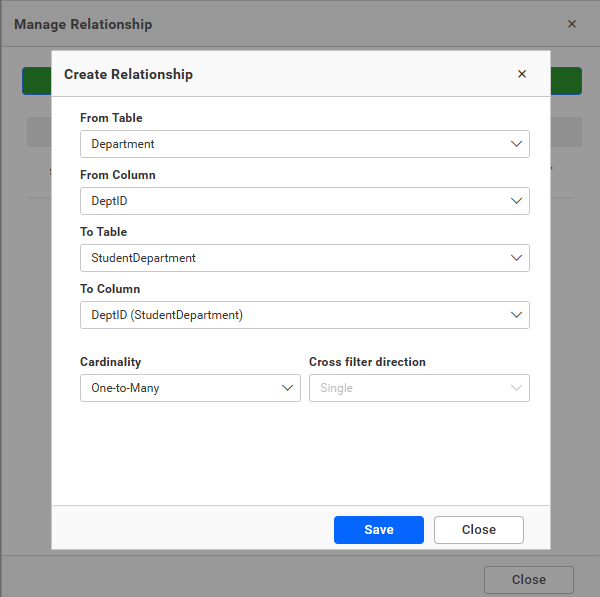
NOTE: This setup creates a Many-to-Many relationship between Students and Departments through the bridge table StudentDepartment.
The data differences between Join and Relationship have been demonstrated using the following images.
How to Edit and Delete Relationships in Bold BI
-
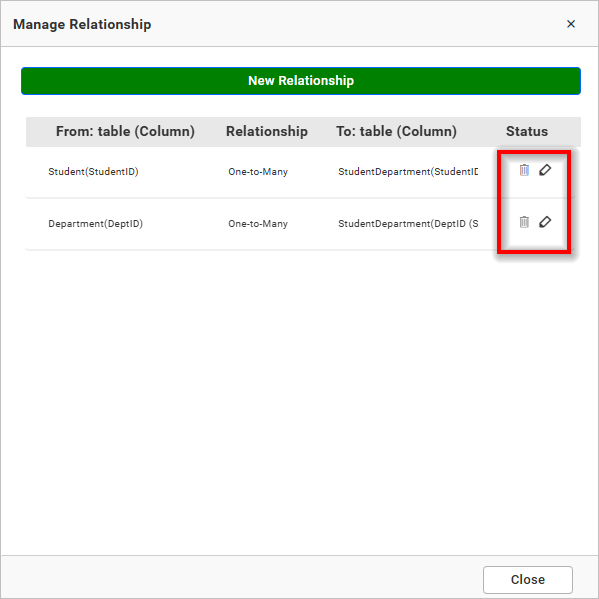
Click on the Join icon to open the Manage Relationships dialog.
-
Select the relationship you want to edit or delete.
-
To edit a relationship, click the Edit icon next to the relationship entry.
-
You can edit the relationship by also double clicking the line between the tables
-
To delete a relationship, click the Delete icon (trash bin) next to the relationship entry.
-
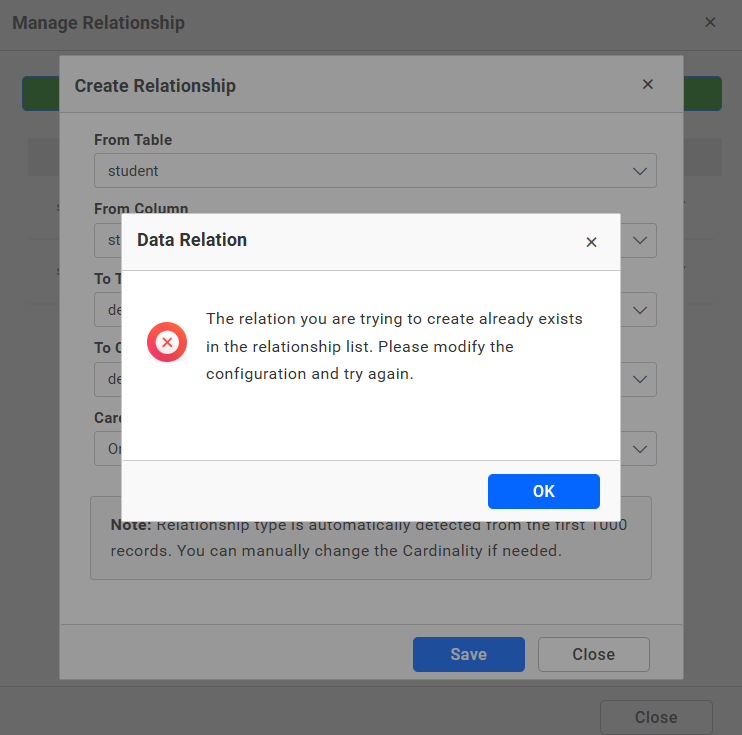
Attempting to add a duplicate relationship in Data Relationships displays an alert message, as duplicate relationships are not supported in Bold BI.
How to Switch the Relationships in Bold BI
During configuration, if you need to exit Relationship Mode, you can either remove the dragged and dropped tables one by one from the design view, or Click the Relation Toggle bar to switch it to the disabled state.
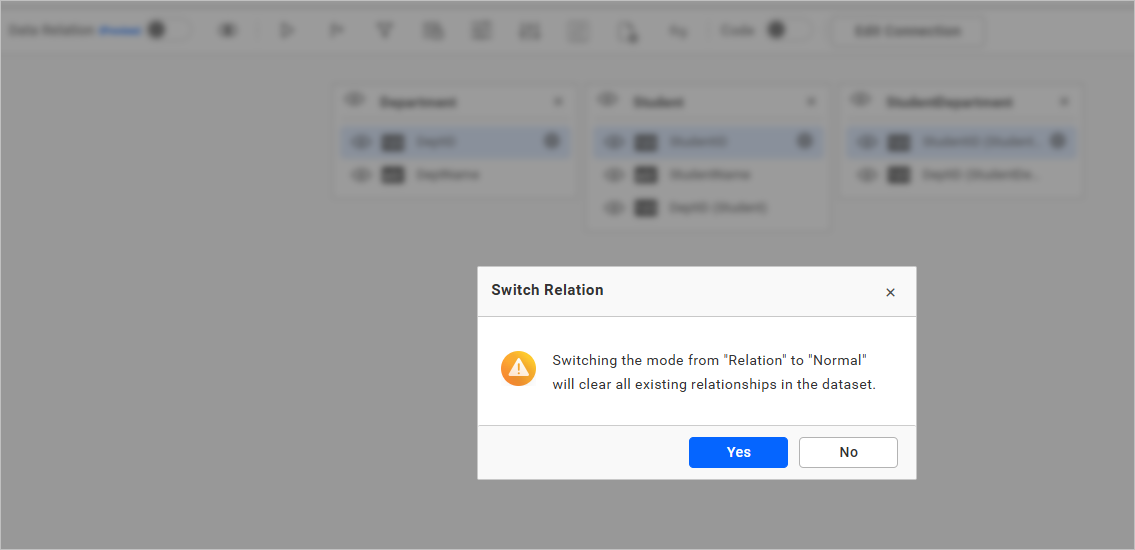
A confirmation popup will appear with two options:
- Yes:
All dragged and dropped tables will be removed. All relationships will be deleted. The view will return to its initial state.
- No:
The popup will be closed. All existing relationships and tables will remain unchanged, preserving the current configuration.
Viewing Table and Column Mapping in Designer
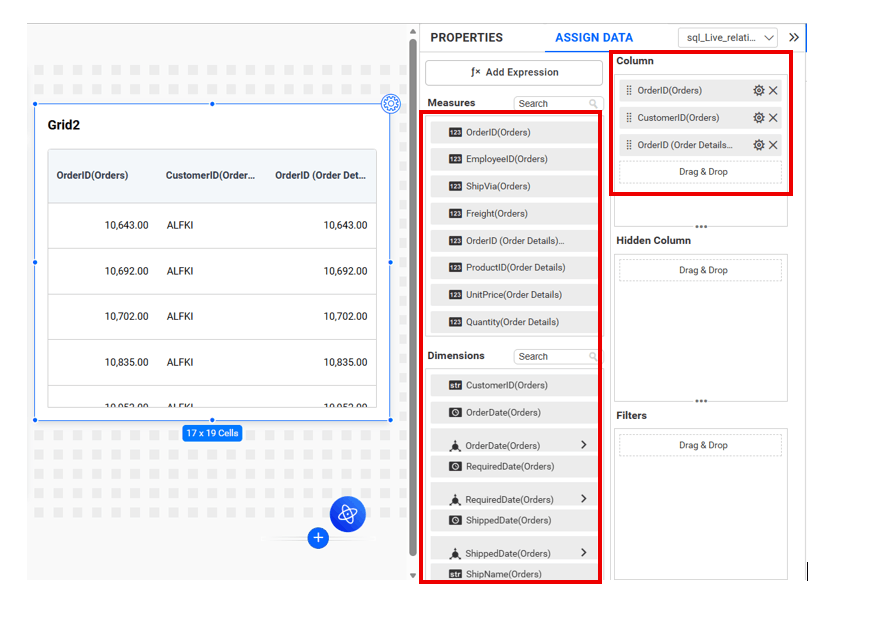
In the Bold BI Dashboard Designer, all fields are displayed along with their corresponding table names across the Measures, Dimensions, and Column sections. This helps users clearly understand how each field is sourced and how it relates to the underlying data model.
Each field is shown in the format:
ColumnName (TableName)
Examples
OrderID (Orders)CustomerID (Orders)OrderID (Order Details)
This representation ensures that even if multiple tables contain columns with the same name, users can easily distinguish between them.
Where This is Visible
Measures Panel
Numeric and aggregated fields display their associated table names, helping users identify the source of calculated values.
Dimensions Panel
Categorical fields also include table names, making it easier to group and filter data accurately.
Column Section (Assign Data Panel)
When dragging and dropping fields into widgets, the table name is retained alongside the column name to avoid ambiguity.
Limitations
-
Bold BI does not support direct many-to-many relationships. However, this can be achieved manually using the Join option in the data design view.
-
Bold BI automatically detects the relationship cardinality based on the first 1,000 records of the related tables. If the detected cardinality does not match the actual data relationship, you can manually modify it to the appropriate type (for example, one-to-many or many-to-one).
-
Relationship has been not supported for the code view mode and data preview.
NOTE: Based on the relationships, data can be fetched from the server. For example, if there are three tables and two relationships among them, and a widget is configured with three aggregation columns from each table, then distinct related columns can be fetched separately, and multiple columns can be retrieved independently. As a result, two or more queries will be executed.