
Azure Maps
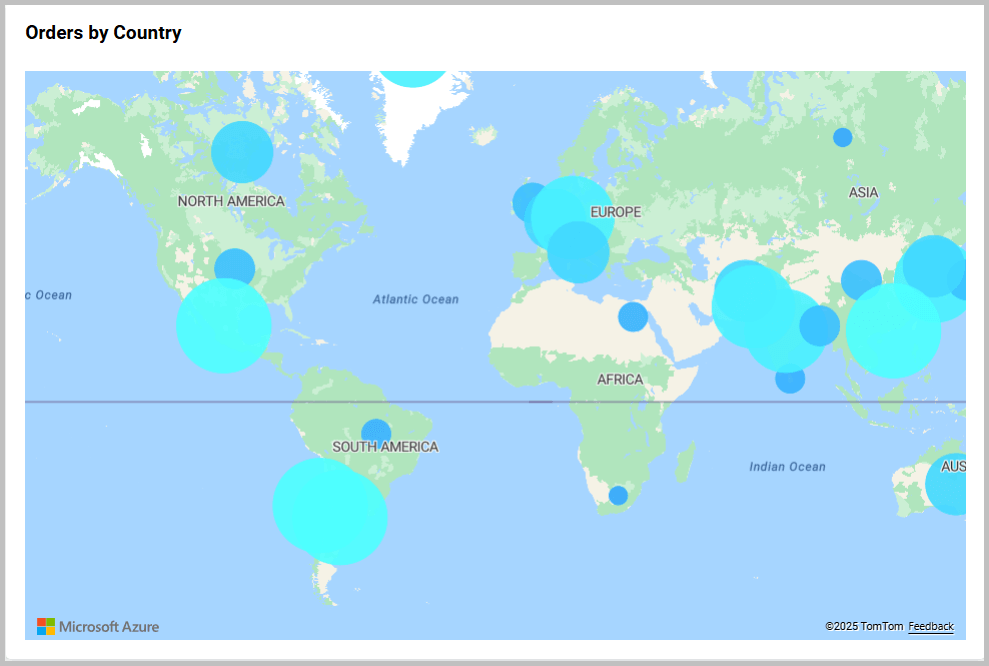
Azure Maps displays geographic data on an interactive Microsoft Azure base map using shape, bubble, or marker layers.
NOTE: Enable Azure Maps and configure a valid Azure Maps key before using the widget. See Azure Maps configuration.
Configuring Data
| Data section | Requirement | Description |
|---|---|---|
| Location Value | Required for a value-based shape layer | Measure used to color shapes. |
| Location Name | Required for a shape layer | Geographic dimension matched to map shapes. |
| Location Tooltip | Optional | Additional shape information shown in the tooltip. |
| Marker Latitude | Required with Marker Longitude for coordinates | Latitude used to position markers. |
| Marker Longitude | Required with Marker Latitude for coordinates | Longitude used to position markers. |
| Marker Address | Alternative marker location | Address used when coordinates are unavailable. |
| Marker Postal Code | Alternative marker location | Postal code used when coordinates are unavailable. |
| Marker Size | Optional | Measure used to size markers. |
| Marker Tooltip | Optional | Additional marker information shown in the tooltip. |
| Marker Image | Optional | Image field used for marker symbols. |
| Hidden Column | Optional | Field used without displaying it. |
| Filters | Optional | Fields used to restrict map data. |
Assigning Data
- Add Azure Maps to the canvas and open ASSIGN DATA.
- Configure Location Value and Location Name for shapes.
- Configure coordinate fields or an address field for markers.
- Optionally add marker details, hidden columns, and filters.
Field Settings
Use a field’s settings menu to configure its supported rename, aggregation, filtering, relative-date, and formatting options. See Configuring Data.
Formatting Azure Maps
General Settings
Refer to General Settings for information about configuring the widget type, unique name, title, subtitle, and description shown for the widget.
Basic Settings
Map Theme
Selects the Azure tile style.
Disable Zooming and Panning
Prevents viewers from changing the visible map area.
Map Shape
Selects a supported Choropleth or Bubble layer when shape fields are configured.
Tooltip Settings
Show Tooltip
Displays information when a viewer points to a shape or marker.
Customize Tooltip
Opens the tooltip editor for arranging the assigned tooltip fields and customizing their display.
Enable RTL
Displays tooltip content from right to left.
Formatting
Formatting
Selects Monochromatic or Advanced color formatting. Monochromatic formatting uses shades of one color; Advanced formatting applies value-based colors and rules through Customize. Refer to Conditional Formatting for the available advanced formatting modes.
Marker Settings
Marker Shape
Selects the marker symbol from the shapes supported by the current map configuration.
Image Source
Selects Local, URL, or Parameterized URL when Marker Shape is Image.
Browse Image
Selects a local marker image. URL loads an image from a web address, while Pattern builds the image URL using dashboard parameters.
Color
Sets the marker color for non-image shapes.
Size
Sets the marker size from 1 through 1500 pixels. It is disabled when a field assigned to Marker Size controls the size from data.
Marker Customize
Opens advanced marker formatting when the current data configuration supports it.
Filter
Refer to Filter Settings for filter behavior.
Link
Refer to Linking for location navigation.
Container Appearance
Refer to Container Appearance for widget-container styling.
Container Actions
Refer to Container Actions for viewer actions.
No Data Appearance
Refer to No Data Appearance for empty-state settings.
Export Settings
Refer to Export Options for export settings.
View Underlying Data
Refer to View Underlying Data for access to map records.