
Heatmap
A Heatmap uses color to compare values across two categorical axes, making high, low, and clustered values easy to identify.
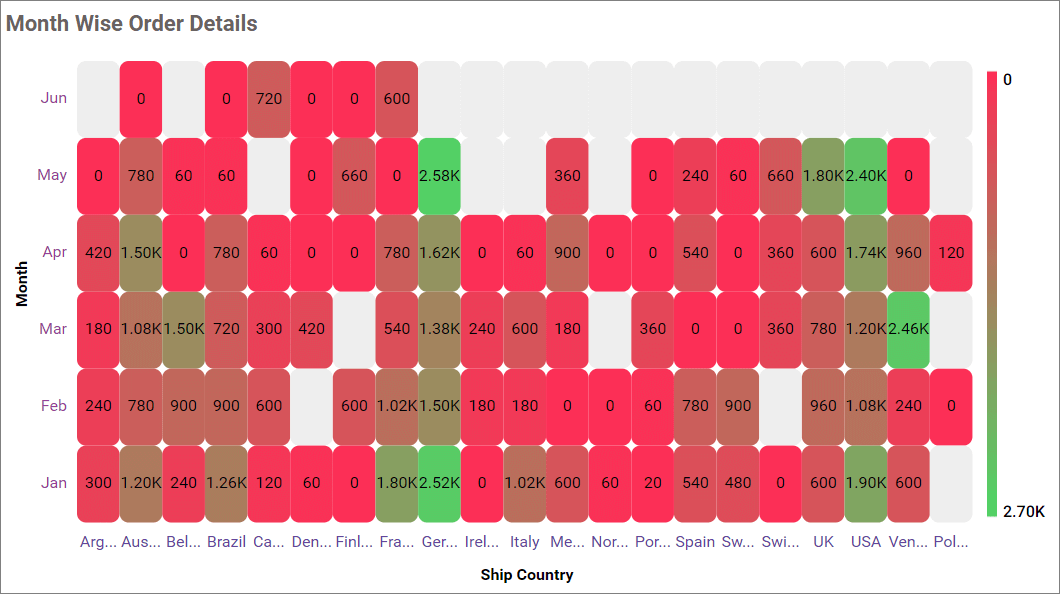
Configuring Data
| Data section | Requirement | Description |
|---|---|---|
| Value | Required | Measure represented by cell color. |
| Size | Optional | Measure used for supported cell-size encoding. |
| X-Axis | Required | Dimension displayed across columns. Multiple fields enable drill down. |
| Y-Axis | Required | Dimension displayed across rows. Multiple fields enable drill down. |
| Hidden Column | Optional | Field used without displaying it. |
| Filters | Optional | Fields used to restrict heatmap data. |
| Tooltip | Optional | Additional fields displayed in the tooltip. |
Assigning Data
- Add the Heatmap to the canvas and open ASSIGN DATA.
- Add a measure to Value and dimensions to X-Axis and Y-Axis.
- Optionally configure Size, Hidden Column, Filters, and Tooltip.
Field Settings
Use a field’s settings menu to configure supported rename, aggregation, sorting, filtering, relative-date, and formatting options. See Configuring Data.
Drill Down
Widgets that support hierarchies enable drill-down when multiple dimension fields are assigned to the hierarchy data section. Select a data point to move to the next level, and use the widget breadcrumb to return to a previous level.
Formatting the Heatmap
General Settings
Refer to General Settings for information about configuring the widget type, unique name, title, subtitle, and description shown for the widget.
Cell Settings
Show Label
Displays the measure value in each cell.
Label Color
Sets the value-label text color and is available when Show Label is enabled.
Cell Radius
Rounds cell corners from 0 through 10 pixels.
Cell Border
Sets cell-border thickness from 0 through 10 pixels.
Tooltip Settings
Show Tooltip
Displays information when a viewer points to a heatmap cell.
Customize Tooltip
Opens the tooltip editor for arranging and formatting the assigned tooltip fields.
Enable RTL
Displays tooltip content from right to left.
Formatting
Formatting
Selects Monochromatic or Advanced color formatting. Monochromatic formatting uses shades of one color; Advanced formatting applies value-based colors and rules through Customize. Refer to Conditional Formatting for the available advanced formatting modes.
Legend Settings
Show Legend
Displays the color-scale legend.
Legend Position
Places the legend at Auto, Bottom, Left, Right, or Top.
X-Axis Settings
Show Axis Label
Displays X-axis category labels, and Color sets their text color.
Show Axis Title
Displays an X-axis title. Axis Title specifies the text, and Title Color sets its color.
Axis Label Rotation
Selects Auto, -90, -45, 0, +45, or +90 degrees.
Axis Label Intersect Action
Selects None or Trim when labels overlap.
Enable Trim
Shortens labels that exceed the available width. Maximum Label Width sets that width from 10 through 500 pixels.
Inversed Axis
Reverses the X-axis order, and Opposed Axis moves the axis to the opposite side.
Sorting
Displays categories in Auto, Ascending, or Descending order.
Y-Axis Settings
Show Axis Label
Displays Y-axis category labels, and Color sets their text color.
Show Axis Title
Displays a Y-axis title. Axis Title specifies the text, and Title Color sets its color.
Enable Trim
Shortens labels that exceed the available width. Maximum Label Width sets that width from 10 through 500 pixels.
Inversed Axis
Reverses the Y-axis order, and Opposed Axis moves the axis to the opposite side.
Sorting
Displays categories in Auto, Ascending, or Descending order.
Font Settings
Refer to Font Settings for heatmap fonts.
Link
Refer to Linking for cell navigation.
Filter
Refer to Filter Settings for filter behavior.
Container Appearance
Refer to Container Appearance for widget-container styling.
Container Actions
Refer to Container Actions for viewer actions.
No Data Appearance
Refer to No Data Appearance for empty-state settings.
Export Settings
Refer to Export Options for export settings.
View Underlying Data
Refer to View Underlying Data for access to heatmap records.