Connecting Bold BI to ChartMogul data source
The REST API is used by the Bold BI dashboard designer to connect to the ChartMogul web services.
Choose ChartMogul data source
To configure the ChartMogul data source, follow these steps:
-
Click the Data Sources button in the configuration panel to add a new data connection.

-
Click CREATE NEW to launch a new connection from the connection panel.
-
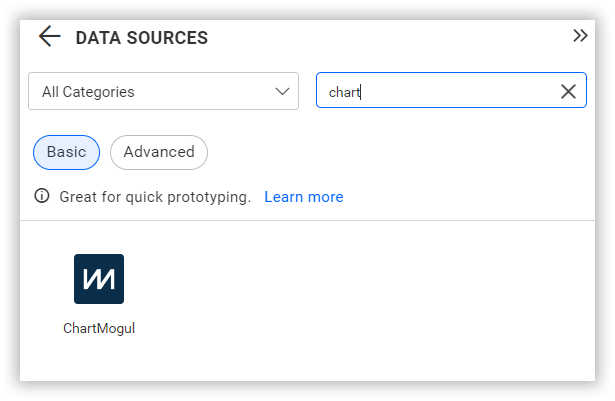
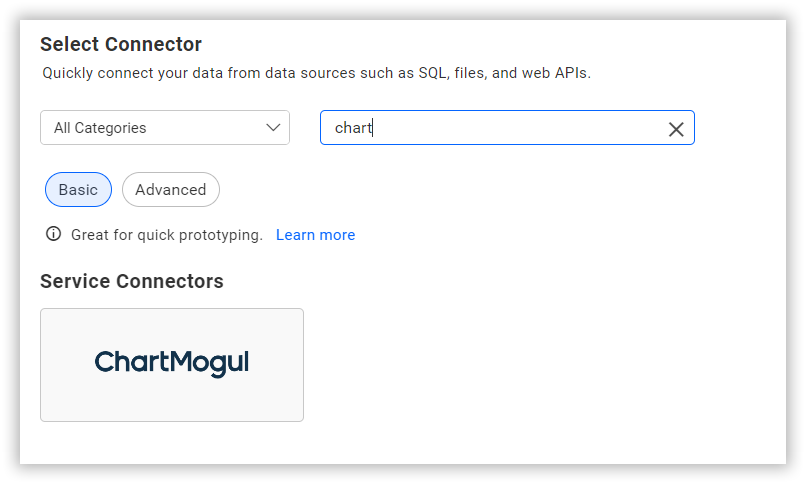
Select the ChartMogul connection in the connection panel.
NOTE: From the home page, you can also create a data source by selecting the Data Sources menu from the left menu panel and then selecting Create Data Source from the data sources page.
Create ChartMogul data source
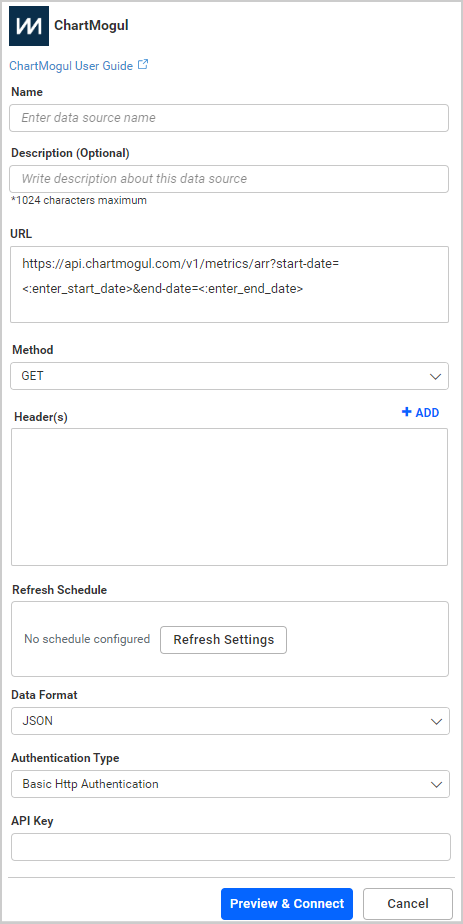
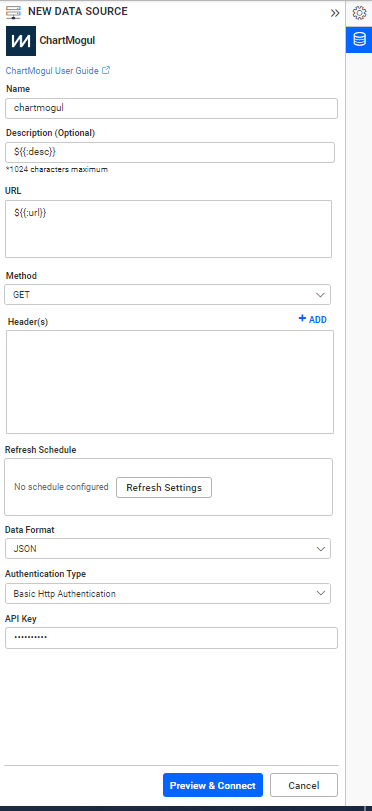
The NEW DATA SOURCE setup screen appears when you click the ChartMogul data source. To build a ChartMogul data source, follow the instructions below.
-
Enter the name and description (optional) for the data source.
-
Enter an API URL in the URL text box, which must be a valid REST API. Refer to the Chart Mogul API documentation for more details.
Example:
https://api.chartmogul.com/v1/metrics/arr?start-date=<:enter_start_date>&end-date=<:enter_end_date> -
Select GET method for the REST API in the Method combo box.
-
Choose a time interval for Refresh Settings using the combo box to trigger the REST API request periodically to keep the data in sync with our dashboard.
-
Enter a valid API Key to access the endpoint in your account. To obtain an API key in ChartMogul, refer to more details on how to Generate ChartMogul API Key
To edit the connection information set, use the Edit Connection option.
How to get APIKEY from ChartMogul
-
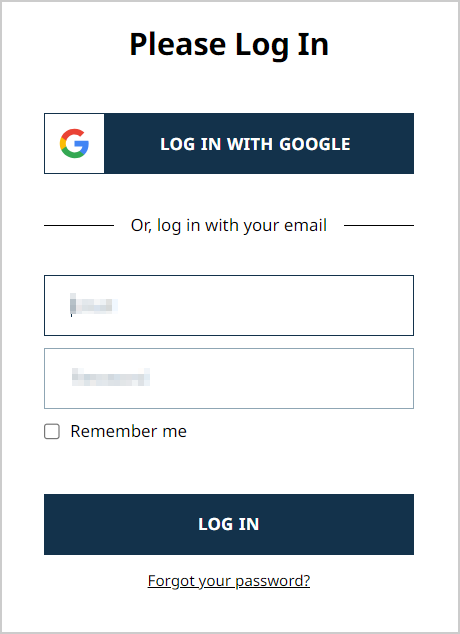
Log in to your ChartMogul account on chartmogul.com.
-
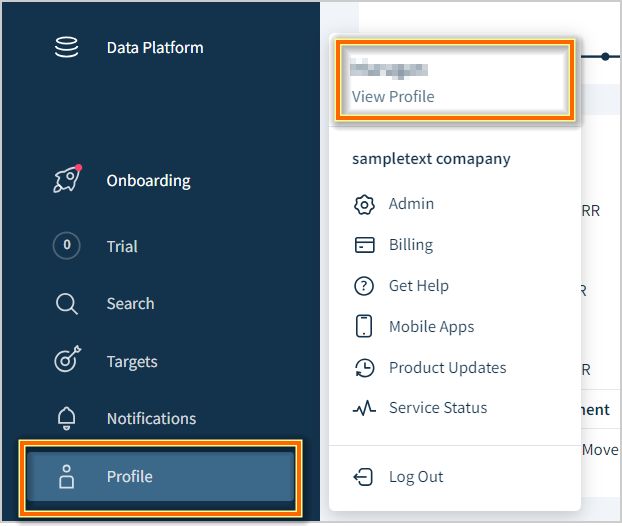
Navigate to Profile to View Profile.
-
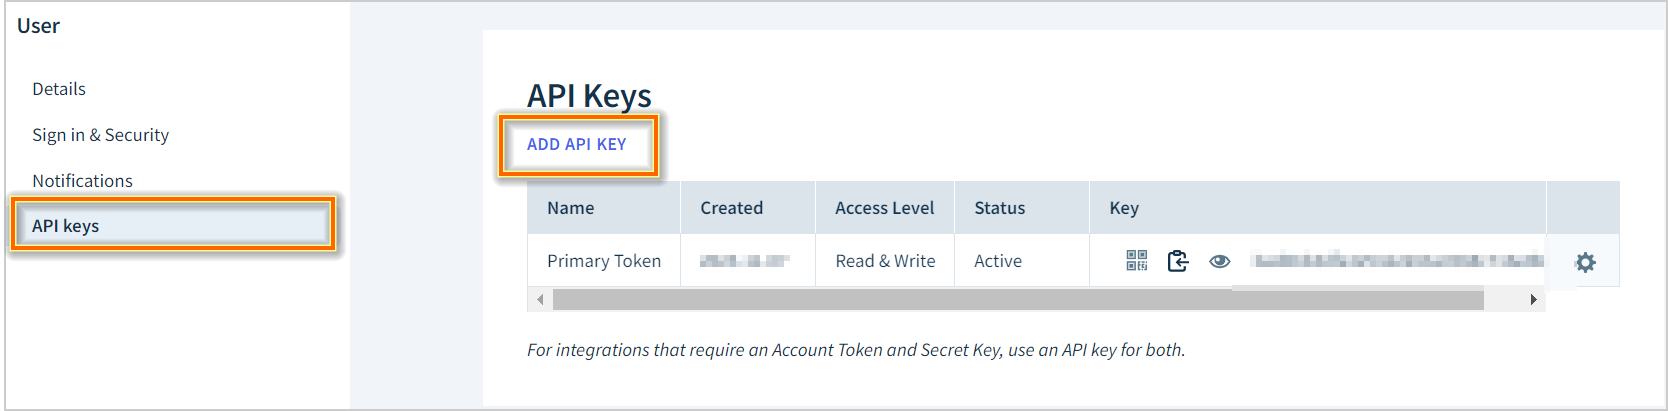
Go to API keys and then click on Add API key.
-
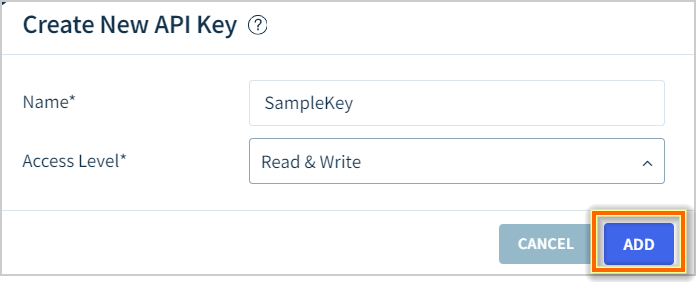
Enter a unique name for the key in the Name field and set the Access Level to either Read-only or Read & Write.
-
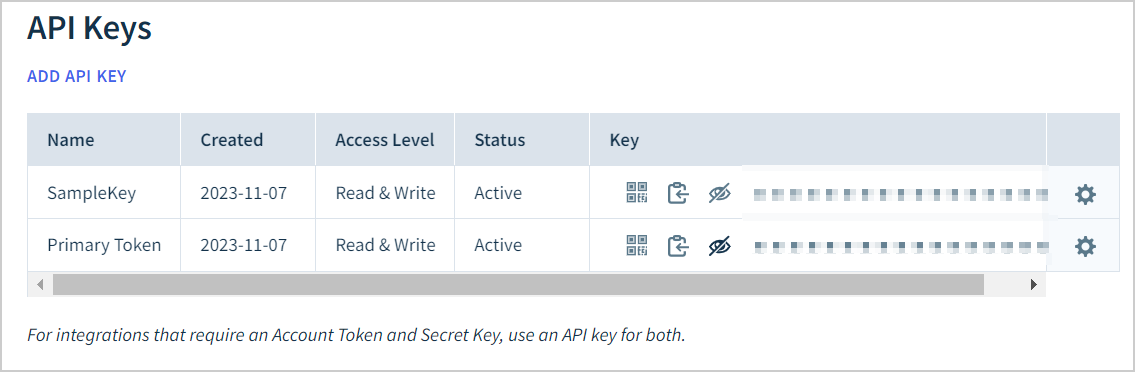
Click ADD to create the key. Once the API key is added, you can see it under the API Keys section.
Additional Information
| Max Rows | Most REST APIs return only fewer data on a single API request. To pull the amount of data you need, set a value in this field. Pagination is handled internally and will fetch the amount of data you need. |
| Refresh Settings | The period before the next refresh call is triggered. It will automatically initiate a call for the API configured in the data source to keep the data up to datelick. The DataSources button in the configuration panel to add a new data connection. |
Preview and Data Import
-
Click the Preview & Connect button to connect with the configurations that have been set.
-
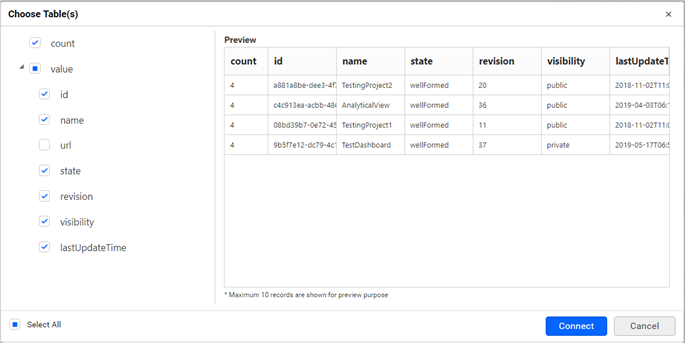
The Choose Table(s) dialog will open. The schema represents the key fields of JSON data retrieved from the Alma Rest API request. This dialog displays a list of the schemas in the tree view and their corresponding values in the grid for preview. Select the required schemas from the tree view for the designer and click Connect.
-
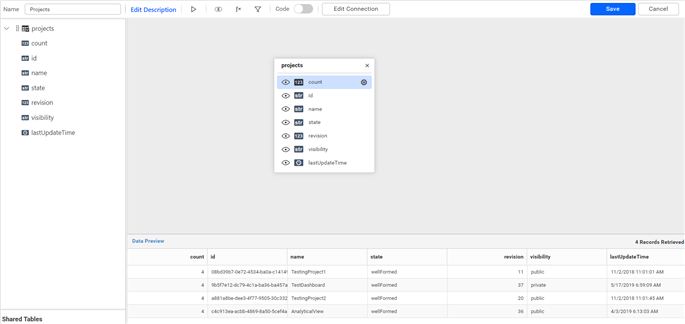
Now, the data design view page with the selected table schema will open. Drag the table from the tree view in the left pane and drop it onto the Query Designer page.
-
Click Save to save the data source with a relevant name.
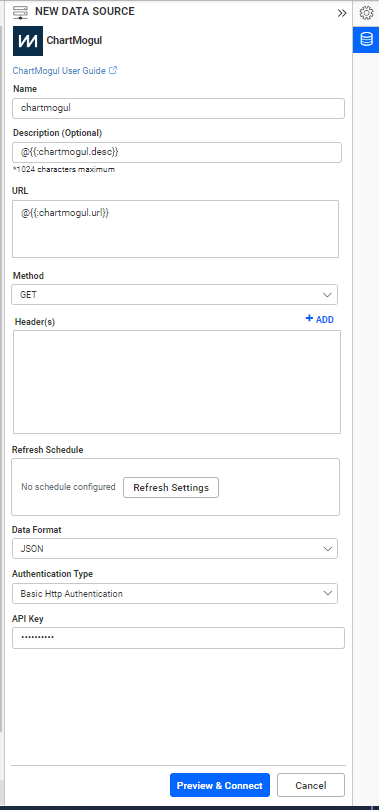
Connect using custom attribute and dashboard parameter
We have added support for connecting to the data source using custom attributes and dashboard parameters. You can connect to the data source using custom attributes or dashboard parameters.
Custom Attribute
Dashboard Parameter
Note: Please refer to the Dashboard Parameter Documentation and Custom Attributes Documentation for more details.