Connecting Bold BI to the Prometheus data source
The Bold BI dashboard designer supports connecting to Prometheus web services using the REST API.
Choose Prometheus data source
To configure the Prometheus data source, follow these steps:
-
Click on the Data Sources button in the configuration panel to add a new data connection.

-
Click CREATE NEW to launch a new connection from the connection panel.
-
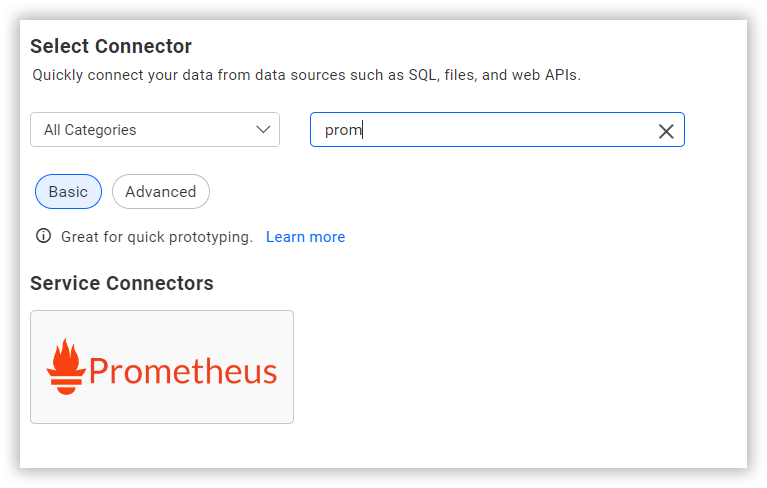
Select the Prometheus connection in the connection panel.
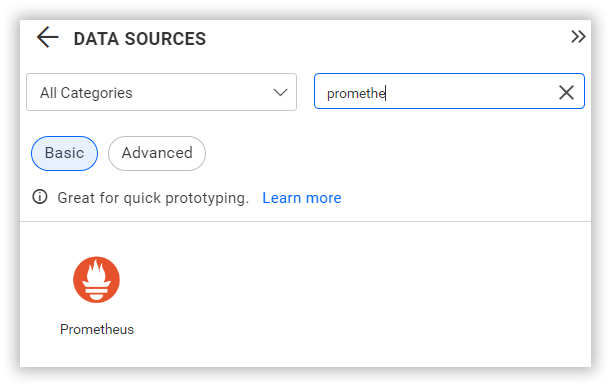
NOTE: You can also create a data source from the home page by clicking the Data Sources menu on the left menu panel and selecting Create Data Source from the data sources page.
Create a Prometheus data source
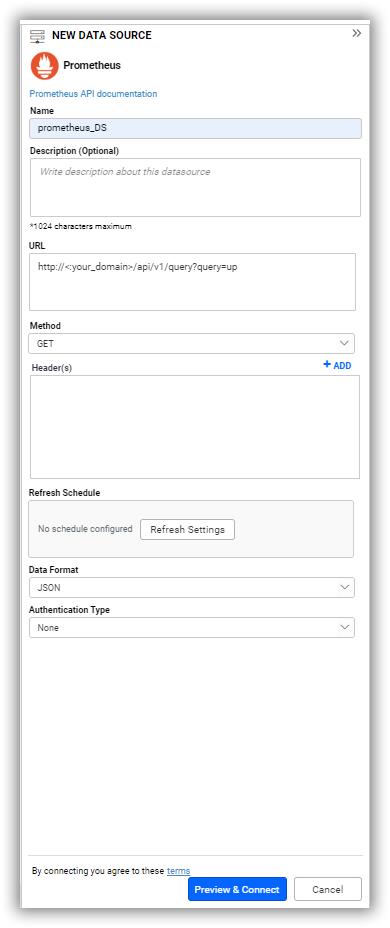
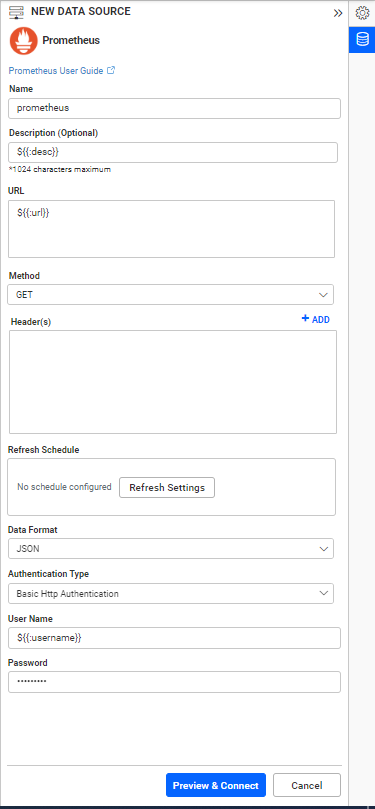
Once you click on the data source, the NEW DATA SOURCE configuration panel will open. Follow these steps to create a Prometheus data source.
-
Enter a name and description (optional) for the data source.
-
Enter a valid Prometheus REST API endpoint in the URL textbox. Refer to the Prometheus API documentation for more details.
Example:
http://<:your_domain>/api/v1/query?query=up -
Select the GET method for the REST API in the Method combo box.
-
Choose a time interval for the Refresh Settings using the combo box, to periodically trigger the REST API request and keep the data in sync with our dashboard.
-
Select JSON data type in Data Format combo box.
-
Replace <:your_domain> at the URL with a valid API account domain.
-
Choose None under Authentication Type as authentication is done using the header.
You can also edit the connection information set using the Edit Connection option.
Additional information
| Refresh Settings | The period of time before the next refresh call is triggered. This will automatically trigger a call for the API configured in the data source to keep the data up to date. If you do not want to sync your new data, choose 'Never'. |
Sample queries
Sample Scraped
http://<:your_domain>/api/v1/query?query=scrape_samples_scraped
Preview and data import
-
Click Preview & Connect to connect with the configurations that have been set.
-
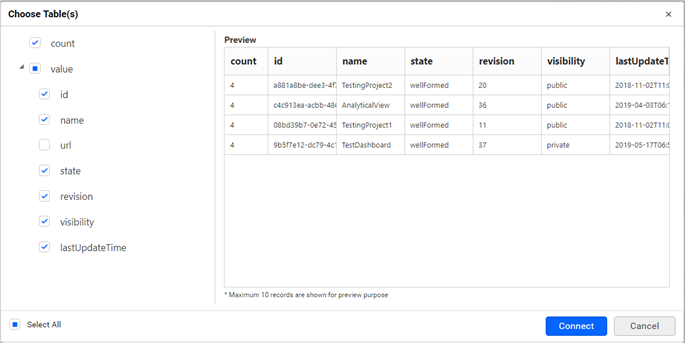
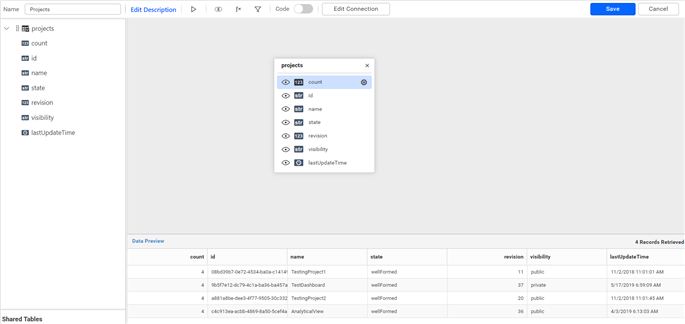
The Choose Schema(s) dialog opens. The schema represents the key fields of JSON data retrieved from the Prometheus Rest API request. This dialog displays a list of schemas in treeview and its corresponding values in the grid for preview. Select required schema(s) from treeview to use in designer and click Connect.
-
Now, the data design view page with the selected table schema opens. Drag the table from the tree view on the left pane and drop it onto the Query designer page.
-
Click Save to save the data source with a relevant name.
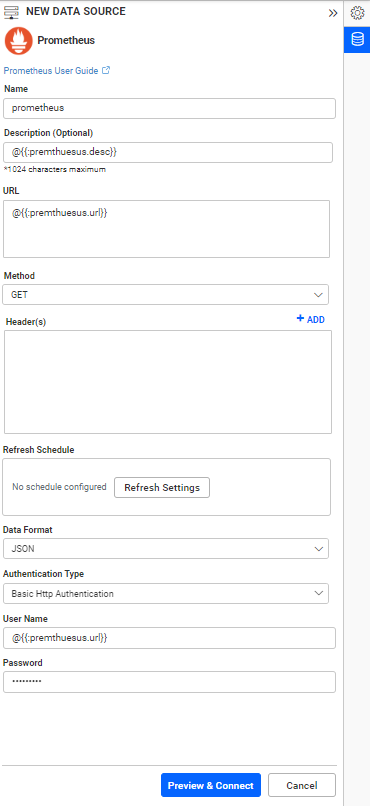
Connect using custom attribute and dashboard parameter
We have added support for custom attributes and dashboard parameters in the data source connection. You can now connect to the data source using custom attributes or dashboard parameters.
Custom Attribute
Dashboard Parameter
Note: Refer to the Dashboard Parameter Documentation and Custom Attributes Documentation for more details.