Connecting Bold BI to Web data source
The Bold BI dashboard designer supports connecting to nearly all web services that have a REST API interface. A live connection in Bold BI is more powerful than an extract connection because it does not store data in the data process. However, it is different from Direct Query since it fetches the data from your server rather than connecting directly to it.
What is Live Connection?
A live connection feature is available for WEB API data sources. Live web API connections do not store data in the data process. The fetched data will be cleared from the data process once all widgets have been visualized in the dashboard.
Advantages
- Dashboard can automatically update with live data.
- Data will no longer be stored on the data process, making it more secure.
- There is no need to configure refresh settings for data refresh.
- Shared and Joined more than one live data sources.
- The Dashboard parameter is supported in Live connection, allowing for a global placeholder value such as a number, string, or date.
- Pick up a selected column from the Web API schema.
Limitations
Some of the limitations associated with the Bold BI Web API LIVE Connection are as follows:
- For optimum performance in live mode Web API, records are restricted to 5000 by default. Use the Extract mode for more than 5000 records. Change the limit from the Max Rows option to fetch more records.
- It is a bit slower than the extract mode connection because the data will be fetched from your server for every action.
Workflow of live connections in Bold BI
- In the beginning, the Live Web API can fetch data from a connected server and transfer it to a connected data processing unit.
- Widgets on the dashboard are displayed based on the fetched data.
- The data will be cleared from the data processing unit once the dashboard data has been displayed.
Choose web data source
To configure the web data source, follow the below steps:
-
Click the Data Sources button in the configuration panel to add a new data connection.

-
Click CREATE NEW to launch a new connection from the connection panel.
-
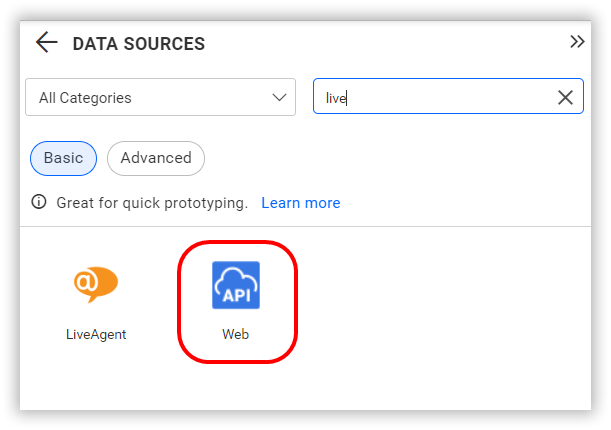
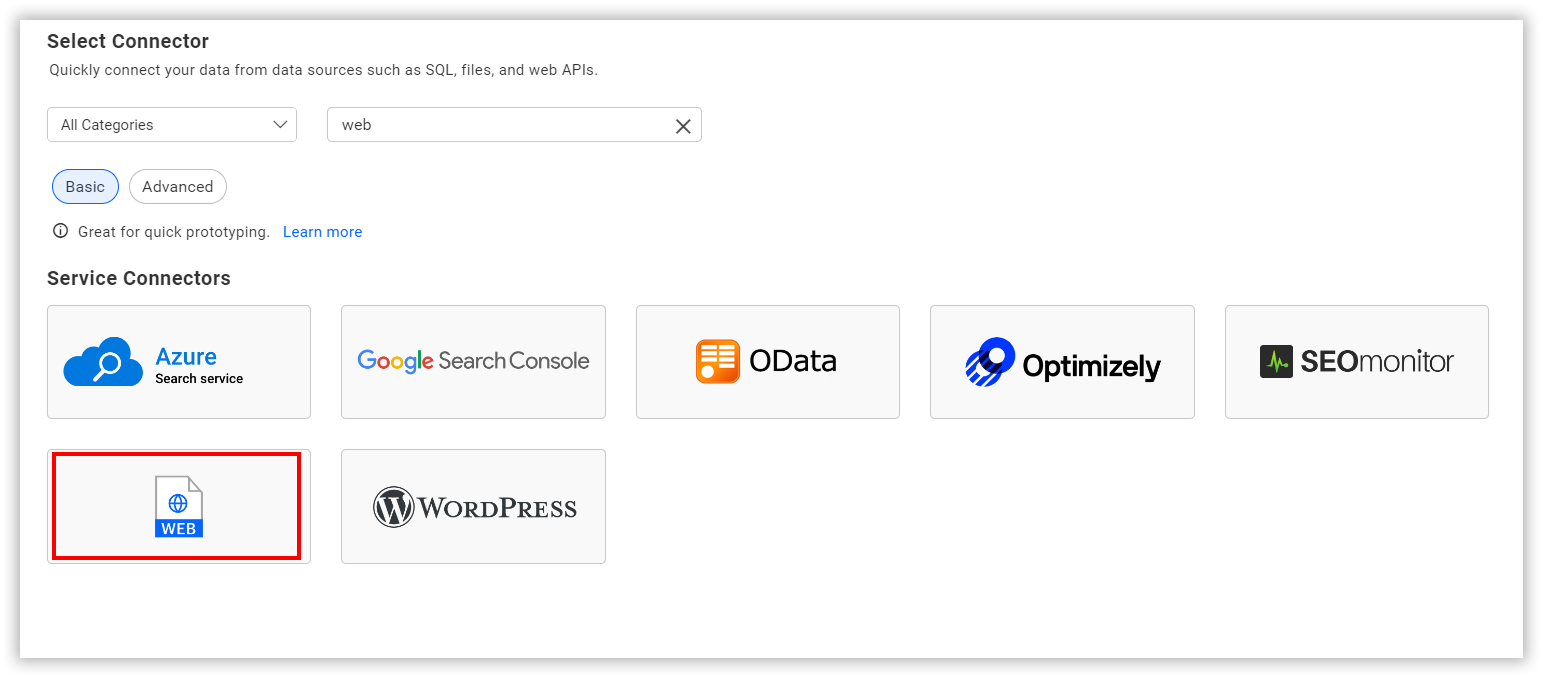
Select the Web connection in the connection panel.
NOTE: You can also create a data source from the home page by clicking on the Data Sources menu on the left menu panel and selecting Create Data Source from the data sources page.
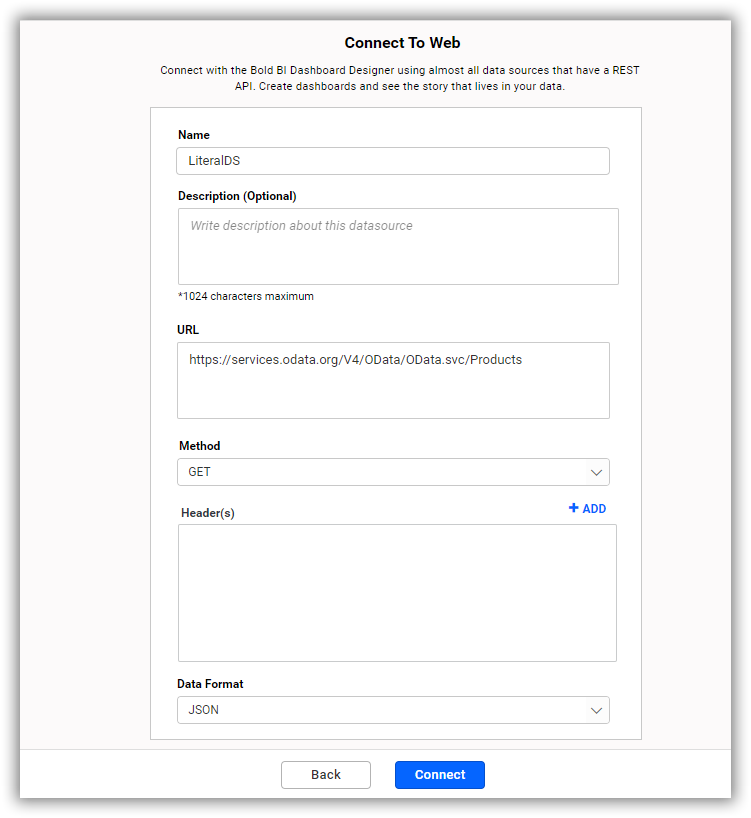
Create web data source
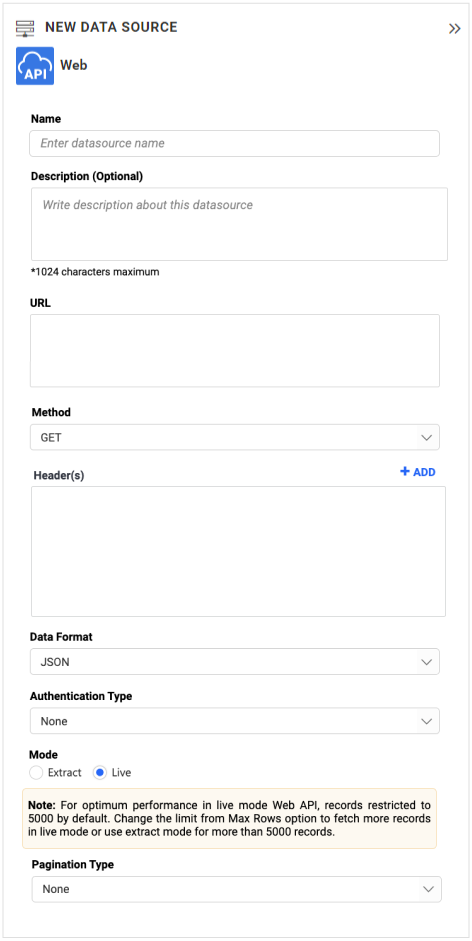
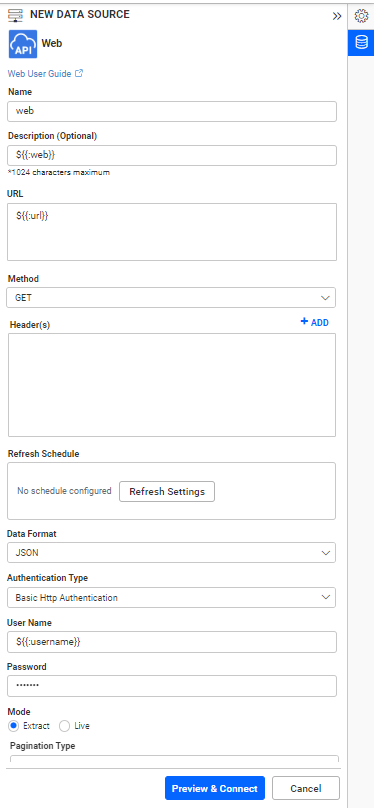
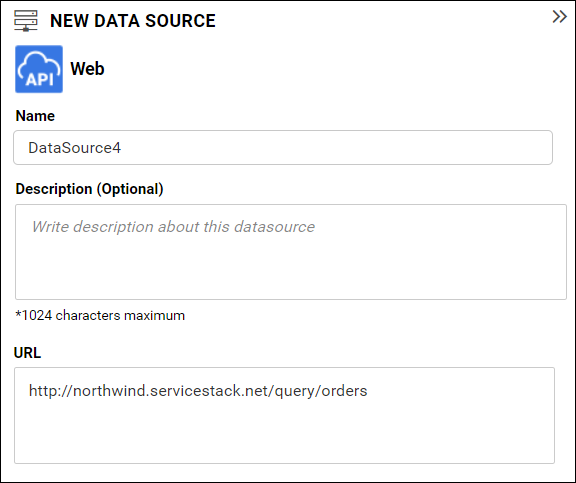
After clicking on the data source, the NEW DATA SOURCE configuration panel will open. Follow the below steps to create web data source:
-
Enter a name and description (optional) for the data source.
-
Enter a valid REST API endpoint in the URL text box.
-
Choose one of the Method Type from the combo box for the provided REST API. The options are GET and POST.
-
If required by the REST API, provide key value pairs in Headers. For details about headers, refer to Query Parameters.
-
Choose a time interval for Refresh Settings using the combo box to trigger the Rest API request periodically to keep the data in sync with our dashboard.
-
Choose a Data Format from the combo box based on the response of your provided REST API. The options are JSON, CSV, and XML.
-
Choose an Authentication Type supported by the data source. The options are Basic http authentication and None. Learn more about Authentication Types.
-
Choose a Pagination Type supported by the data source from the combo box.
You can also edit the connection information set here using the Edit Connection option.
Preview and Data Import
-
Click Preview & Connect to connect with the configurations that have been set.
-
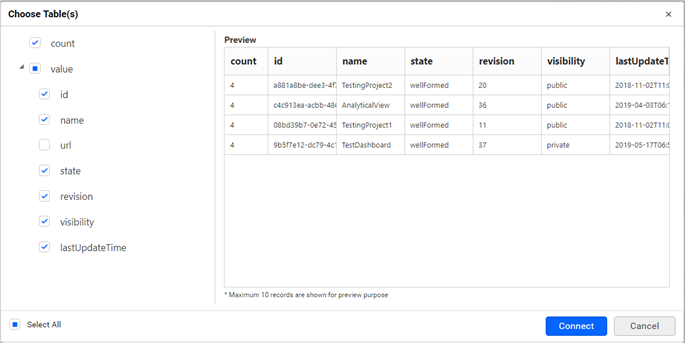
The Choose Table(s) dialog opens. The schema represents the key data fields retrieved from the Web Rest API request. This dialog displays a list of schemas in treeview and their corresponding values in the grid for preview. Select the required schema(s) from the treeview to use in the designer and click Connect.
-
Now, the data design view page with the selected table schema opens. Drag and drop the table.
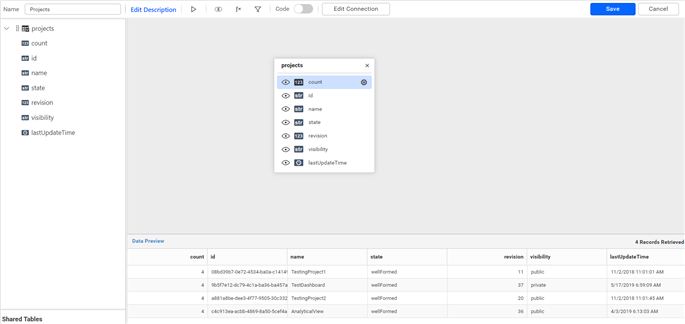
-
Click Save to save the data source with a relevant name.
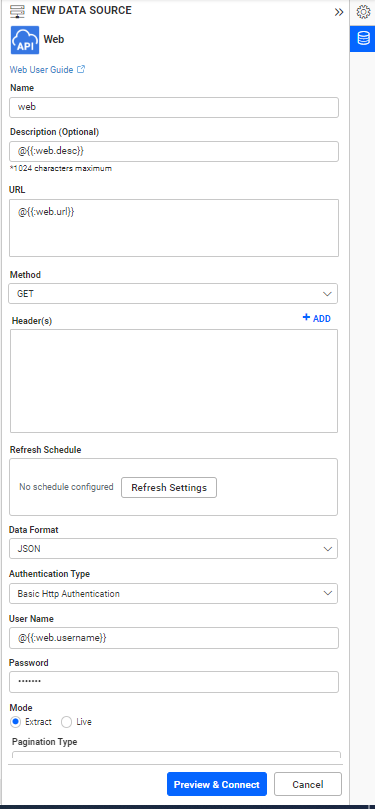
Connect using custom attribute and dashboard parameter
We have added support for custom attributes and dashboard parameters in the data source connection. You can now connect to the data source using custom attributes or dashboard parameters.
Custom Attribute
Dashboard Parameter
Connecting to DataSource using REST API with Custom Attributes
For example, we configure a Web-Live DataSource using a REST API.
Configuring a Web-Live DataSource connection using custom attributes via an API involves setting up:
Configure the following properties:
- URL.
- Header(s).
- Parameter(s).
- Raw.
- Username.
- Password.
- Servername.
- Database.
- APItokenbearer.
- Apikey.
- Hostname.
- Authtoken.
- Accesstoken.
- Authsecret.
- Authid.
- Accountid.
- AppId.
- Authentication.
- Sitetoken.
- Chainid.
- Cloudtoken.
Creating the Connection
To create a connection, use the following JSON structure:
{
  "Name": "${{:DB_Name}}",
  "Type": "Web",
  "Description": "DS Description_WODS_20250203161109",
  "Connection": {
    "Url": "${{:DB_URL}}",
    "Method": "Post",
    "DataFormat": "Json",
    "Headers": [
      {
        "key": "Authorization",
        "value": "${{:DB_Authorization_Value}}"
      }
    ],
    "Parameters": [
      {
        "key": "cliente",
        "value": "${{:DB_Parameter_Value}}"
      }
    ],
    "Provider": "WEB",
    "ProviderType": "Web",
    "SecurityType": "None"
  }
}
To know more about Connecting Bold BI to WEB Live Data Source via REST API
Note: Refer to the Dashboard Parameter Documentation and Custom Attributes Documentation for more details.
Pagination Types
Options are None, Offset, Next Page, Next Token, and Next URL.
Note: According to the pagination type, the response data must align with the provided JSON format.
None
It can be used when the REST API does not need to be paginated. This will return only the first set of records.
Offset
The number of records that should be skipped before beginning pagination.
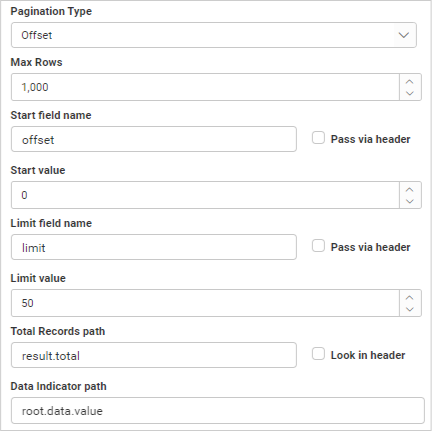
For example, connect the OData REST API in the web data source with the pagination parameters as shown below:
| Field Name | Values | Description |
|---|---|---|
| URL | https://services.odata.org/V4/Northwind/Northwind.svc/Order_Details | Rest endpoint URL |
| Method Type | GET | Request Type of the provided endpoint |
| Data Format | JSON | Data format of the response for the provided Rest API |
| Authentication Type | None | To connect the provided endpoint, provide proper authorization credentials |
| Pagination Type | Offset | Number of records to be skipped before start paginating |
| Max Rows | 7 | Number of records to be fetched |
| Start field name | $skip | Indicates the name of the parameter to skip the records |
| Start field value | 2 | Value for the parameter *Start field name* |
| Count field name | $top | Indicates the name of the parameter to fetch the number of records from the index provided |
| Count field value | 3 | Value for the parameter *Count field name* |
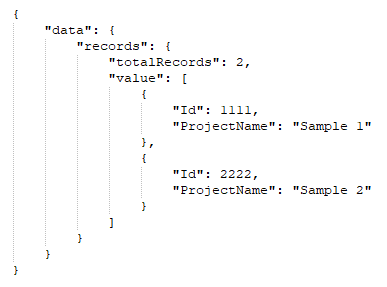
| Total Records Path | (leave as blank) | To find the total records count from the obtained response. Use '.' to specify the nested key as like `data.records.totalRecords`. Refer Sample for Total Records. |
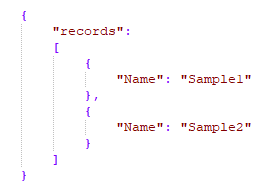
| Data indicator path | value | Number of records fetched will be identified from the data. Refer to the sample for Data Indicator Path. |
Sample for total records
Sample for data indicator path
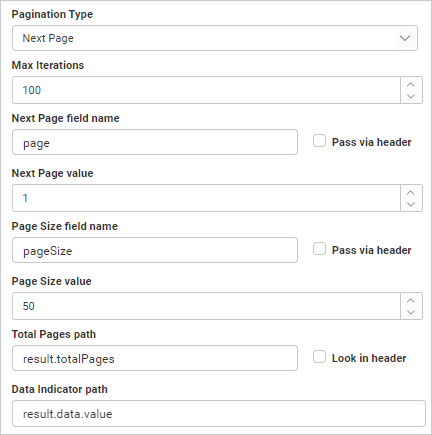
Next Page
The number of pages that need to be fetched with the specific number of records per page.
For example, connect the Smartsheet REST API in the web data source with the pagination parameters as follows:
| Field Name | Values | Description |
|---|---|---|
| URL | https://api.smartsheet.com/2.0/workspaces | Rest endpoint URL |
| Method Type | GET | Request Type of the provided endpoint |
| Header | Authorization : Bearer {:access_token} | Authorization Headers for the endpoint |
| Data Format | JSON | Data format of the response for the provided Rest API |
| Authentication Type | None | To connect the provided endpoint, provide proper authorization credentials |
| Pagination Type | Next Page | Pagination pairs like page/per_page, page/pageSize, etc... will be supported under this category |
| Max Iterations | 2 | Number of Iterations to paginate. |
| Next page field name | page | Name of the parameter to fetch the specific page |
| Next page field value | 1 | Value for the parameter *Next page field name* |
| Page size field name | pageSize | Name of the parameter to denote the number of records per page. |
| Page size field value | 2 | Value for the parameter *Page size field name* |
| Total Pages | data.records.totalPages | Specify the path where the response has the information for `total number of pages`. Refer to the sample for Total Pages. |
| Data indicator path | records | Number of records fetched will be identified from this path. |
Sample for total pages
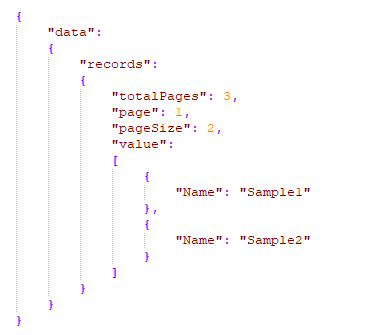
Sample for data indicator path
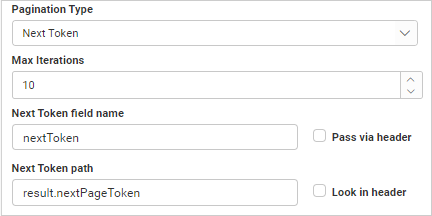
Next Token
Iterate the next set of records using a token.
For example, let’s connect the Google AdSense REST API in the web data source with the pagination parameters as follows:
| Field Name | Values | Description |
|---|---|---|
| URL | https://www.googleapis.com/adsense/v1.4/accounts/{:accountId}/adclients?maxResults=2 | Rest endpoint URL |
| Method Type | GET | Request Type of the provided endpoint |
| Header | Authorization : Bearer {:access_token} | Authorization Headers for the endpoint |
| Data Format | JSON | Data format of the response for the provided Rest API |
| Authentication Type | None | To connect the provided endpoint, provide proper authorization credentials |
| Pagination Type | Next Token | To get the next set of records, make use of token from the response |
| Max Iterations | 2 | Number of Iterations to paginate |
| Next token field name | pageToken | Name of the parameter used to carry the token in the request like http://sample.com/samples?pageToken=1234. To fetch nested key, refer to the sample response |
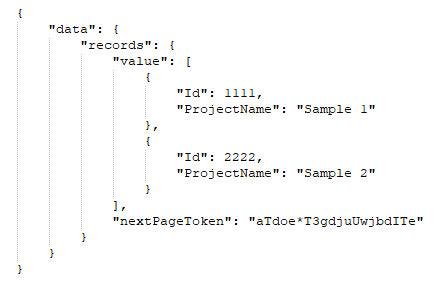
| Data indicator path | nextPageToken | Specify the path of the token to fetch the next set of records |
Sample response
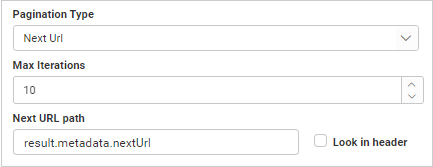
Next URL
Iterate the next set of records using url obtained from the response.
For example, let’s connect the GitHub REST API in the web data source with the pagination parameters as follows:
| Field Name | Values | Description |
|---|---|---|
| URL | https://api.github.com/events?page=1&per_page=2 | Rest endpoint URL |
| Method Type | GET | Request Type of the provided endpoint |
| Header | User-Agent : Syncfusion Dashboards | Authorization Headers for the endpoint |
| Data Format | JSON | Data format of the response for the provided Rest API |
| Authentication Type | None | To connect the provided endpoint, provide proper authorization credentials |
| Pagination Type | Next URL | To get the next set of records, make use of URL from the response |
| Max Iterations | 2 | Number of Iterations to paginate |
| Next URL path | link | Specify the path to get the next url. |
| Look in Header | Enable checkbox | Whether to find the provided URL path in response header or not. |
NOTE: To implement pagination, you must provide either the
Total Records Pathor theData Indicator Path. If both values are provided, theTotal Records Pathwill take precedence.
Query Parameters
- If the Rest API requires it, pass the necessary values as key-value pairs in the Headers.
- For the POST method, if necessary, pass the required values as key-value pairs in the Parameters.
- Use either Parameter(s) or Raw for a POST request.
Authentication Types
- If your data source supports authentication directly through the REST API URL, choose None under Authentication Type.
- If your data source supports API Key/API Token authentication, pass these values under Header(s) by clicking +Add. Choose None under Authentication Type.
- If your data source has Basic HTTP authentication, choose Basic http Authentication under Authentication Type and input the username and password.
Connecting Web API data source with API Key Authentication
An API key is one of the most commonly used authentication types for REST APIs. The API key will be assigned to a user by the provider at the time of user creation or when enabling API key authentication to access data via the REST API.
API keys can be used in the following places, which are listed below.
- Authorization/Custom Header (Basic or Bearer).
- Query String.
- Body Data.
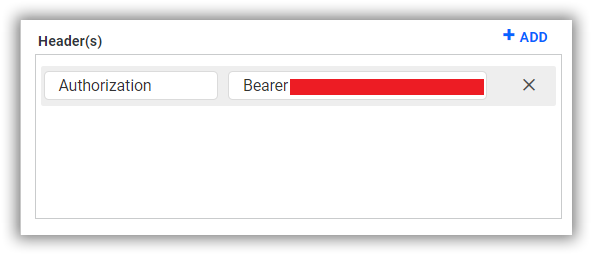
Adding Authorization/Custom header for API Key
To connect a REST API for adding an API Key in the header, you can follow the steps below to connect the API in Bold BI.
-
Add header in Web API data source as below.
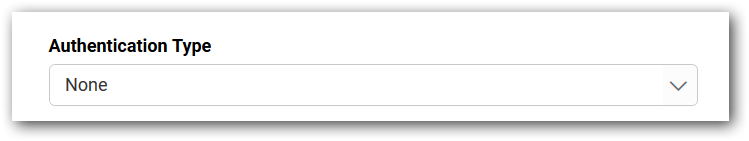
-
You need to select the Authentication Type as None.

-
The header value can be either basic or bearer, depending on the application to which you are connecting.
-
Most API Key authentication methods connect using the Authorization header. You can also change the name of the header key as needed.

Adding API Key in Query String Parameter
A query string parameter will be added to the URL, allowing you to access the REST API without the need to add any headers or bodies.
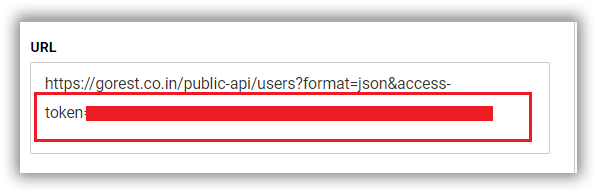
-
No additional steps may be required for connecting to the API using Query String type of API Key authentication.
-
You need to select the Authentication Type as None, since the API Key is added in the Query String parameter.
Adding API Key in the Body Data for Post method REST APIs
Body data is typically added for POST method API calls. If the application is designed to send the API Key over the body data of the REST API, you can follow the steps below.
-
Please select the POST method in the Web API data source to include Body Data and then add the API Key as shown below, using the appropriate property names.
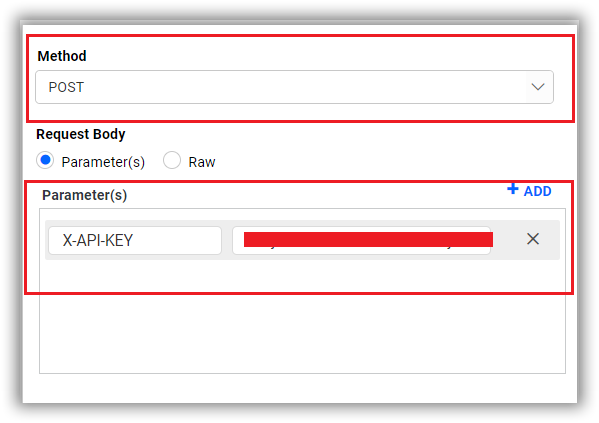
-
You need to select the Authentication Type as None since its API Key is added as Body Data.

Connecting Bold BI to WEB Live Data Source via REST API
Prerequisites
Type while creating the data source needs to be Web.
Modes
Only the Live mode WEB data source can be created through the REST API.
Parameters for creating Data Source
| Parameters | Details |
|---|---|
| Name required | string
Name of the data source |
| Type required | string
This is used to specify the Type of the data source. |
| URL required | string
Rest endpoint URL |
| MethodType optional | string
Request Type of the provided endpoint. |
| DataFormat optional | string
Data format of the response for the provided Rest API |
| Headers optional | array
Authorization Headers for the endpoint ,default as [] |
| Parameters optional | array
Parameters for the endpoint and support for Post MethodType |
| RawData optional | json
Raw body of the endpoint and support for Post MethodType |
| Authentication Type optional | string
To connect to the provided endpoint, use either None or BasicHttpAuthentication for proper authentication |
| Username optional | string
To connect to the provided endpoint, provide the username for BasicHttpAuthentication |
| Password optional | string
To connect to the provided endpoint, provide the password for BasicHttpAuthentication |
| RefreshInterval optional | string
No schedule for live data source. By default, it is set to Never |
| Provider optional | string
Type of the data source |
| ProviderType optional | string
Enter a DataProvider as Web |
| Rows optional | string
This is used to specify the data count. |
| Mode optional | string
Mode of the data source is Live |
| DataProvider optional | string
Enter a DataProvider as WEB |
For creating connection:
{
 "Name": "string",
 "Type": "Web",
 "Connection": {
   "Url": "string",
   "MethodType": "string",
   "DataFormat": "string",
   "Headers":[],
   "AuthenticationType": "string",
   "RefreshInterval": "string",
   "Provider": "WEB",
   "ProviderType": "Web",
   "Rows": "string",
   "Mode": "Live",
   "DataProvider": "WEB"
 }
}
For creating a connection with Headers, Parameters, Raw Body, and Authentication:
{
 "Name": "string",
 "Type": "Web",
 "Connection": {
   "Url": "string",
   "MethodType": "string",
   "DataFormat": "string",
   "Headers": [
     {
       "key": "string",
       "value": "string"
     }
   ],
   "Parameters": [
     {
       "key": "string",
       "value": "string"
     }
   ],
   "RawData": "",
   "AuthenticationType": "string",
   "Username": "string",
   "Password": "string",
   "RefreshInterval": "Never",
   "Provider": "WEB",
   "ProviderType": "Web",
   "Rows": "string",
   "Mode": "Live",
   "DataProvider": "WEB"
 }
}
Dashboard Parameter
Utilize dashboard parameters in conjunction with a Live Web API connection. Connecting to the Web API live connection, along with using dashboard parameters, will assist in achieving various use cases. Below are some examples of using dashboard parameters with Live web connections.
Dashboard parameters can be used in the Web API connection’s URL, Headers, and Parameters.
Example 1: Filtering the dashboards based on Literal Mode.
Follow these steps to use the feature.
- Connect the REST API to the live web data source.
https://services.odata.org/V4/OData/OData.svc/Products
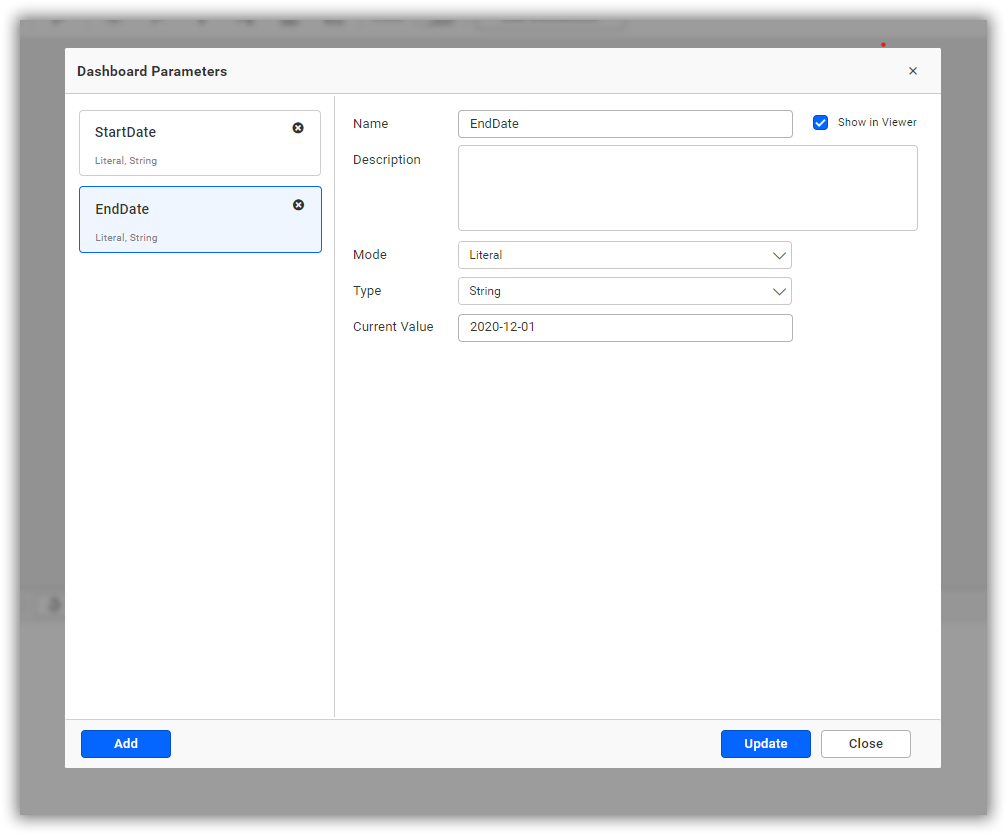
 2. Once you have connected the data source, create the StartDate and EndDate under the Literal Mode dashboard parameters.
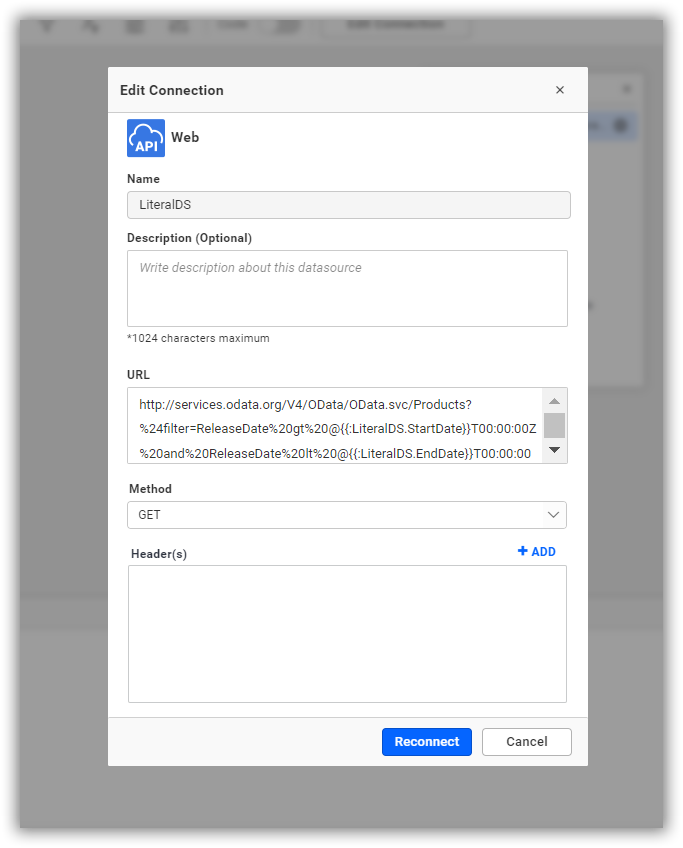
 3. Save the data source first. Then, click on the Edit Data Source button to reconnect the dashboard parameter URL provided, and save the changes.
Example:
3. Save the data source first. Then, click on the Edit Data Source button to reconnect the dashboard parameter URL provided, and save the changes.
Example:http://services.odata.org/V4/OData/OData.svc/Products?%24filter=ReleaseDate%20gt%20@{{:LiteralDS.StartDate}}T00:00:00Z%20and%20ReleaseDate%20lt%20@{{:LiteralDS.EndDate}}T00:00:00Z
 4. Create the dashboard using the data source and then publish it.
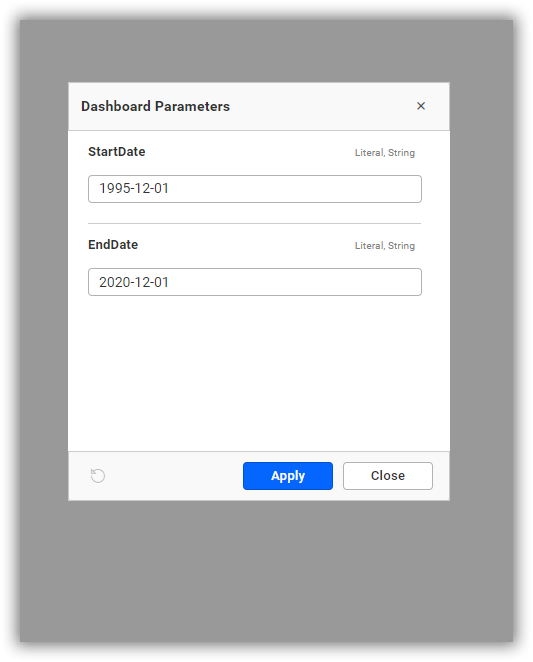
> **NOTE:** A dashboard is rendered according to the date range configured in the dashboard parameter when the data source is created.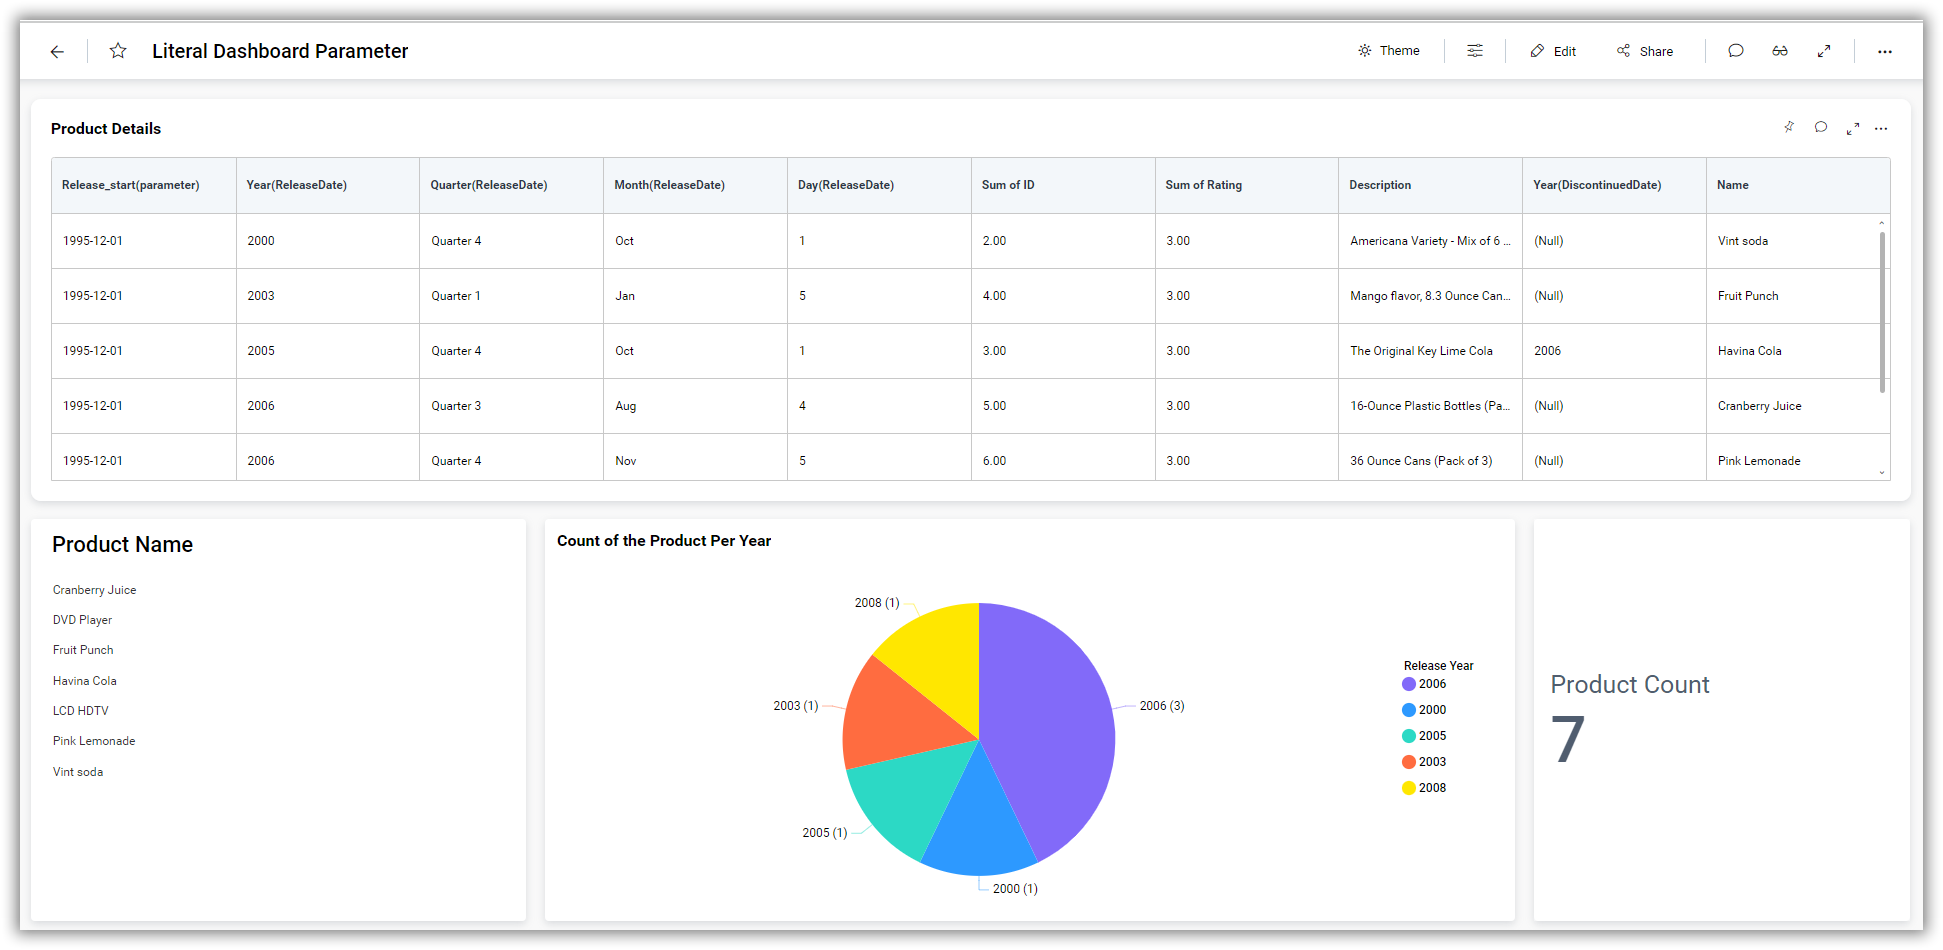 5. Click on the dashboard parameter icon and adjust the date range to display the dashboard with the specified values.
 6. Real-time data will be displayed on the dashboard according to the chosen date range.
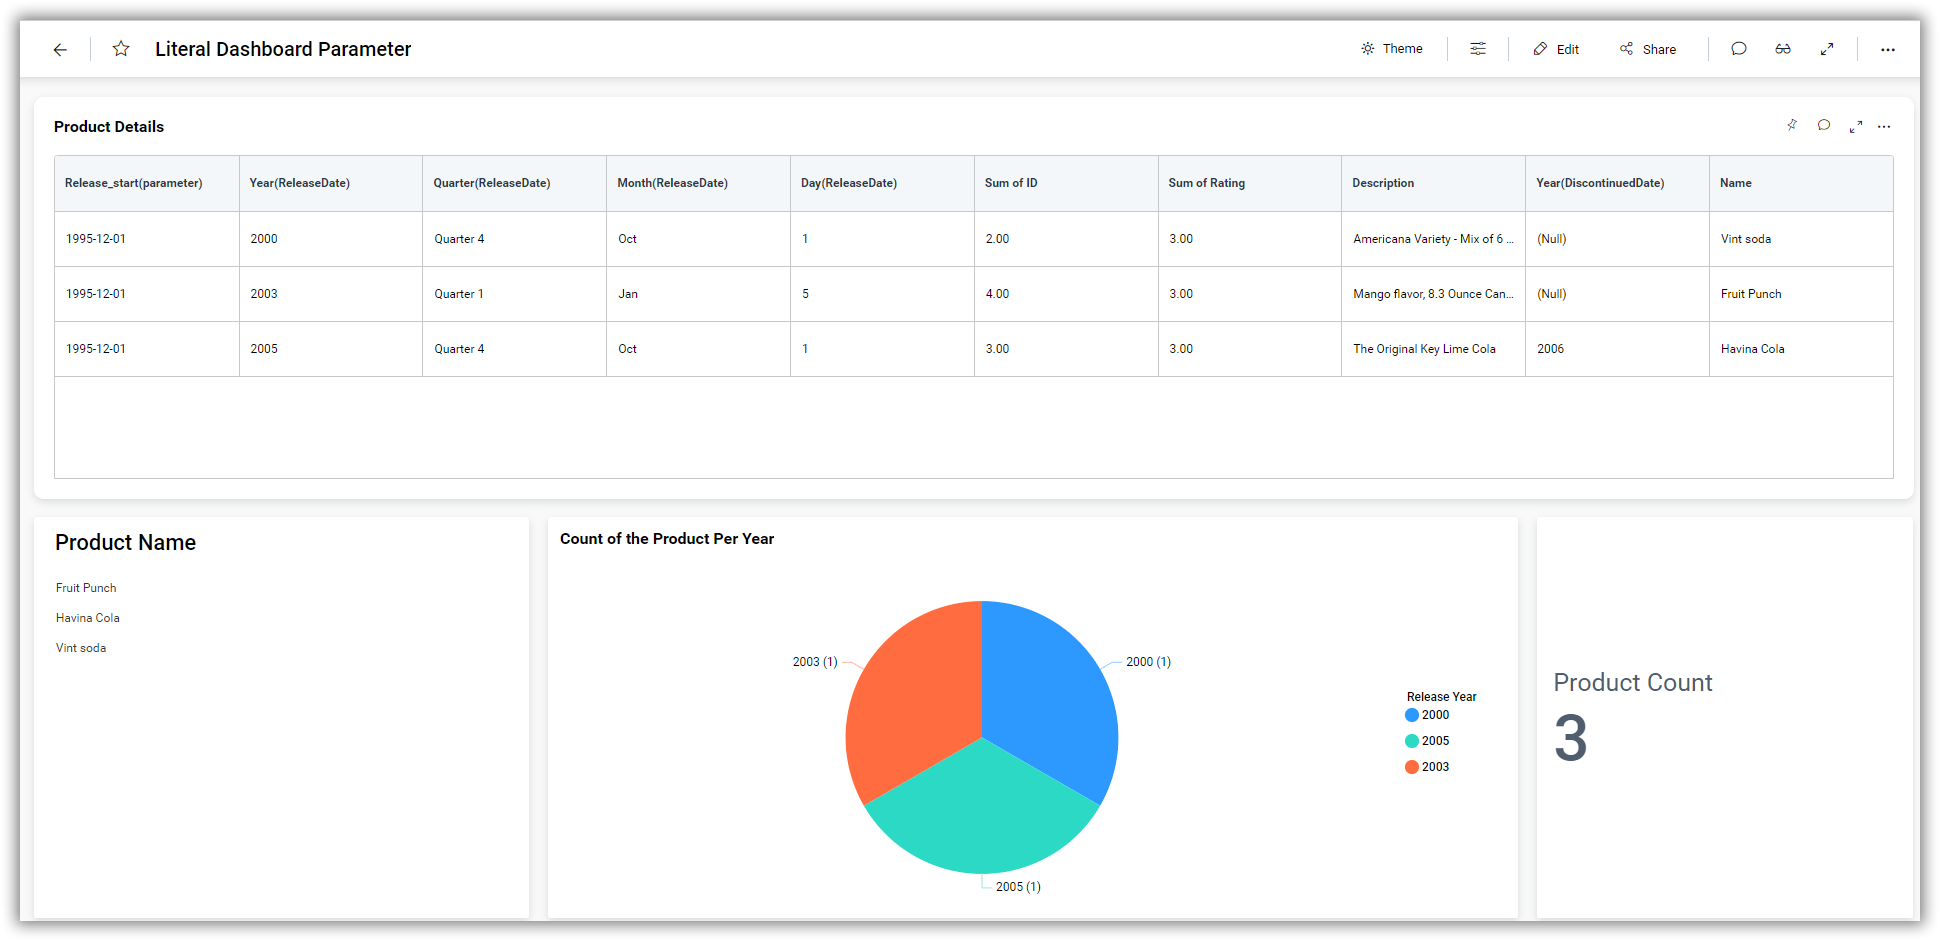
Example 2: Filtering the dashboards based on Iterative Mode.
Note: The Live Web data sources do not support multiple iterative modes for optimal performance and minimal time delay.
Follow these steps to use the feature.
- Connect the REST API to the live web data source.
https://gorest.co.in/public/v2/users
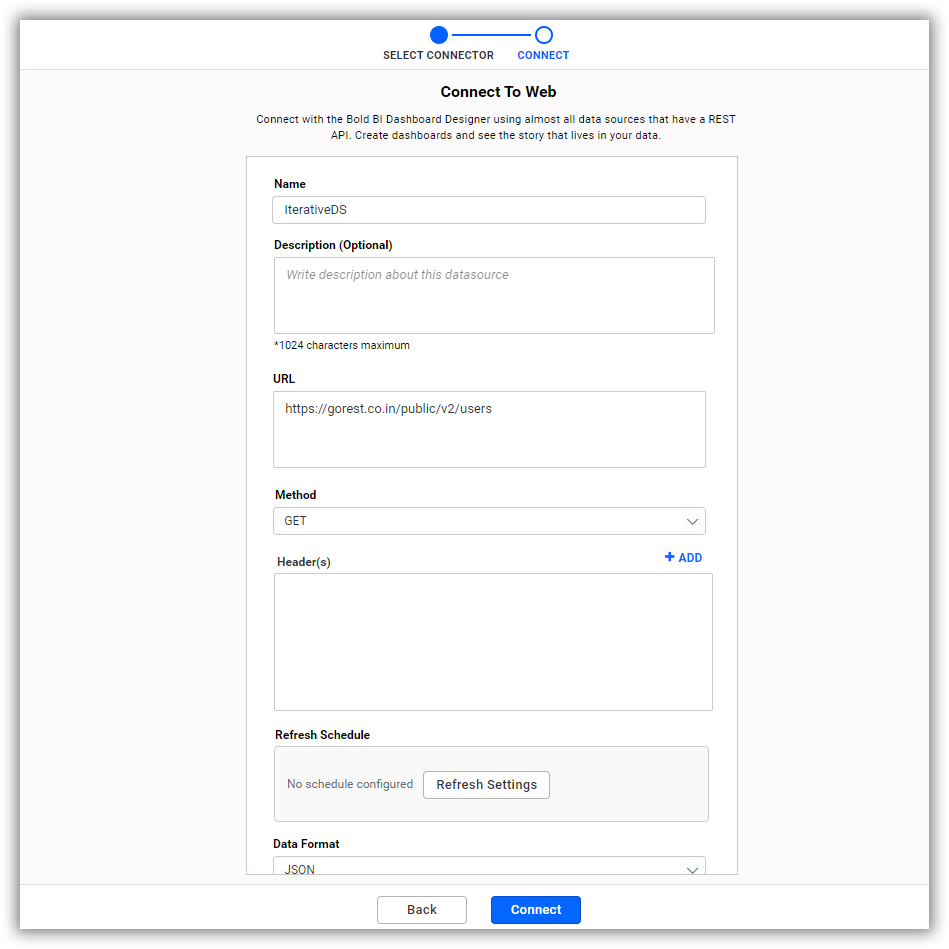
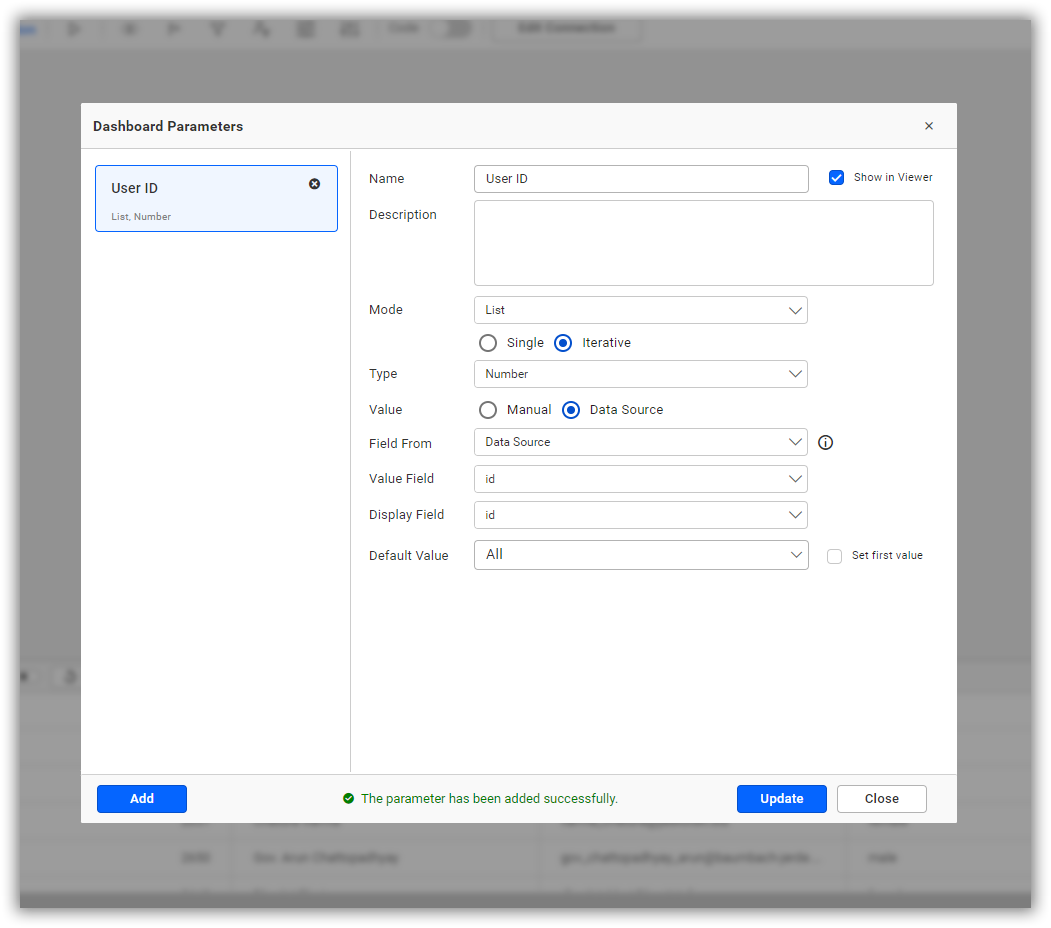
-
Once you have connected the data source, create the User ID under the Iterative Mode of the dashboard parameters. Refer to the document for instructions on how to add the Iterative Mode dashboard parameter.
-
Save the data source. Then, click edit data source to reconnect the dashboard parameter URL as provided and save the changes. Example:
https://gorest.co.in/public/v2/users/@{{:IterativeDS.User ID}}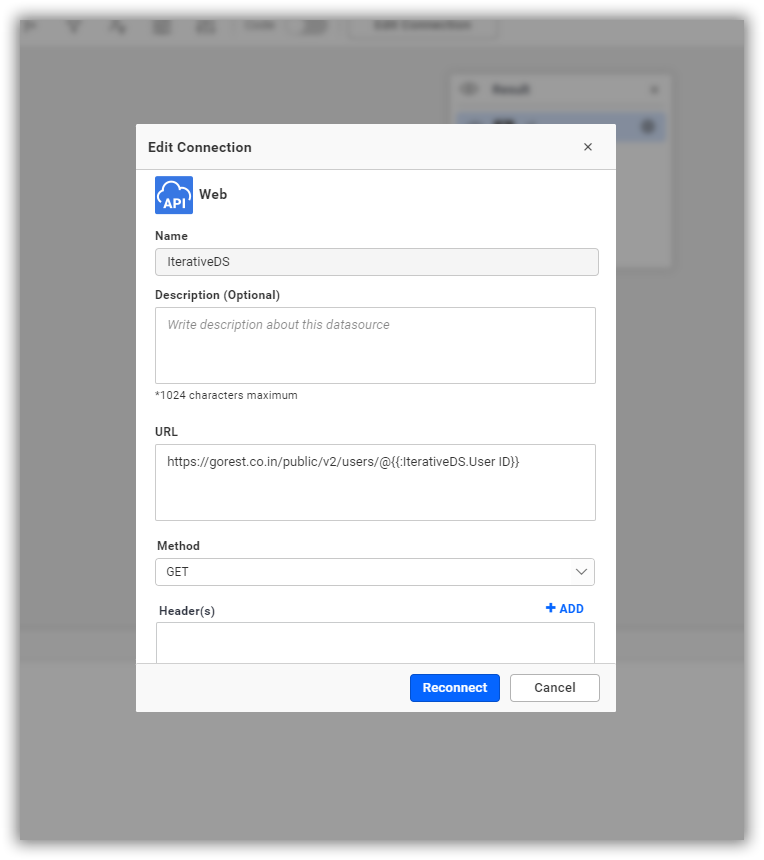
-
Create the dashboard with the data source and publish it.
NOTE: A dashboard is rendered according to the range of User IDs configured in the dashboard parameter when the data source is created.
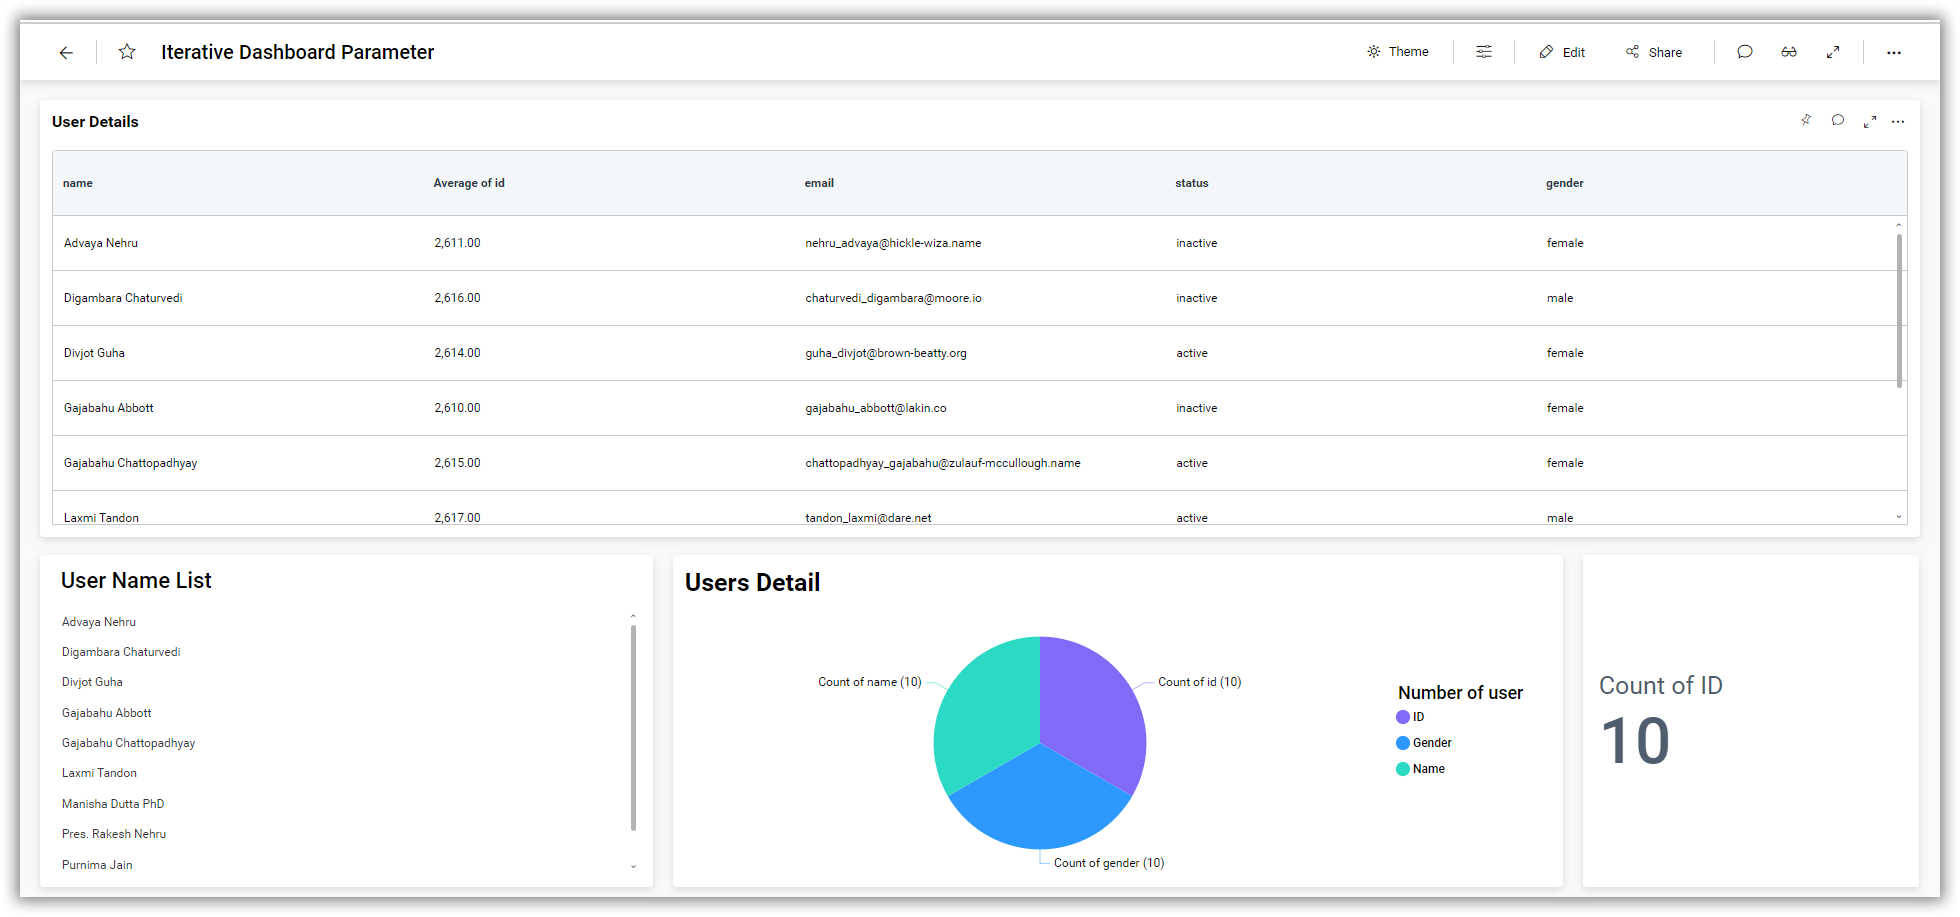
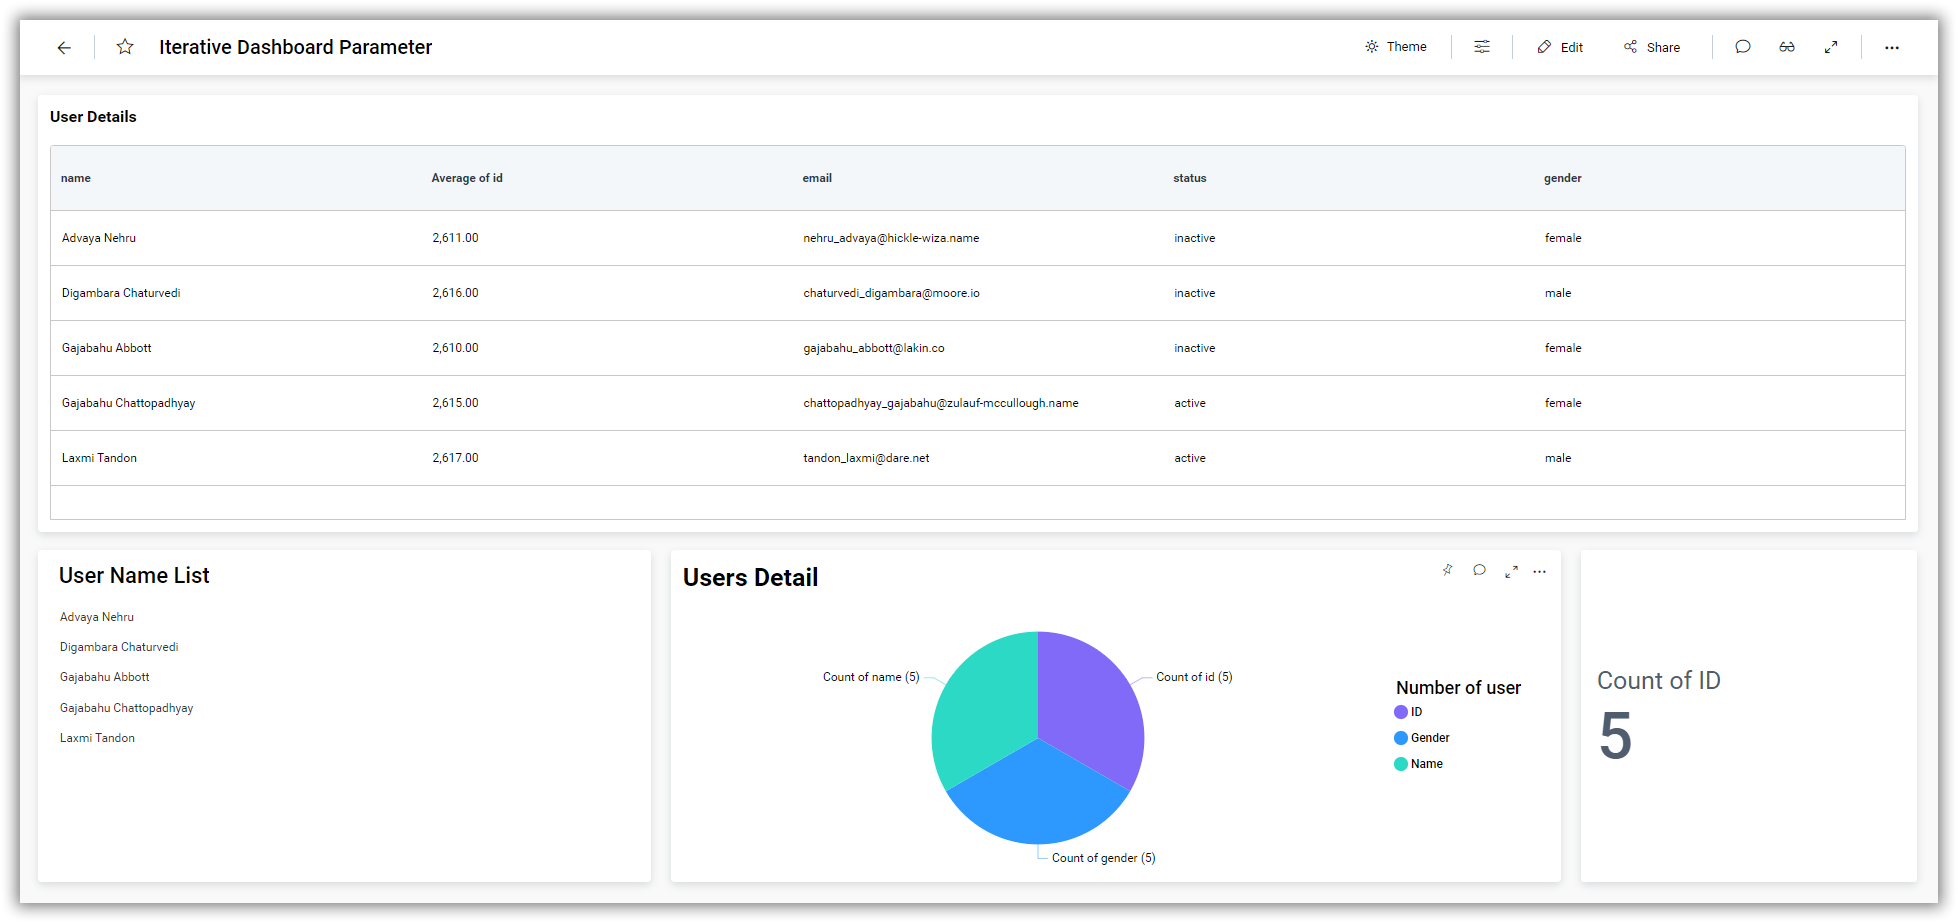
-
Click on the dashboard parameter icon and select the User IDs to render the dashboard with the specified values.
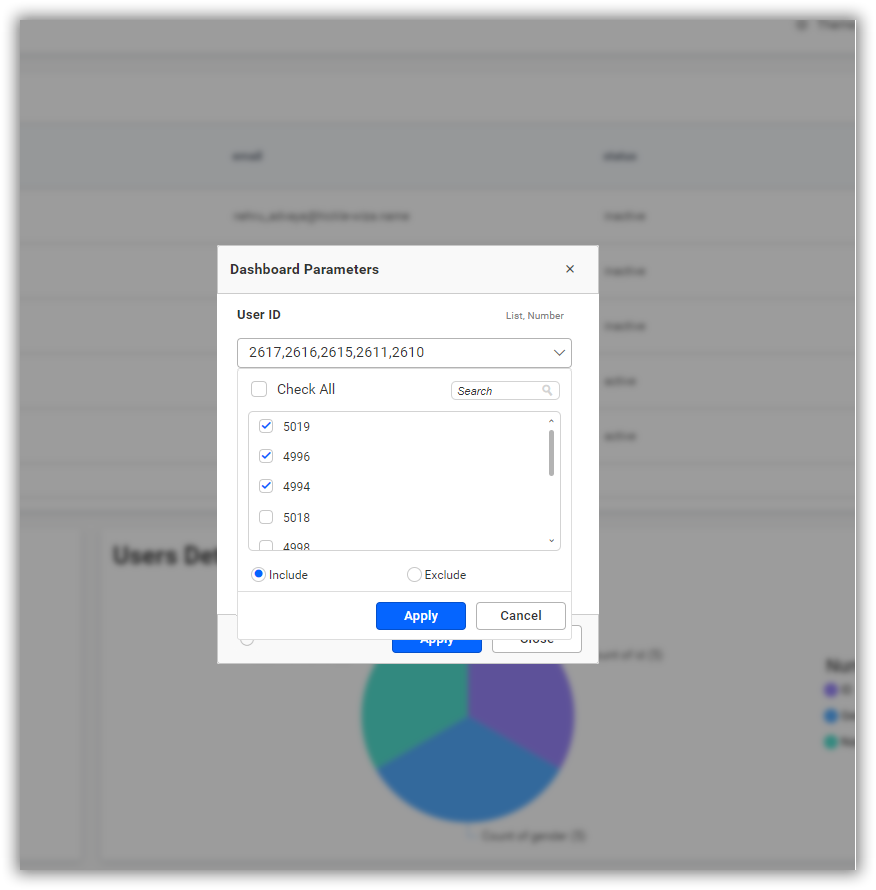
-
Real-time data will be displayed on the dashboard based on the selected User ID’s range.
Limitation Information
| Live mode max rows limitation | For optimal performance in live mode Web API, records are restricted to 5000 by default. To fetch more records in live mode or extract mode for more than 5000 records, change the limit from the Max Rows option. |
| Refresh Settings limitation | In live mode Web API, it is impossible to refresh tables because the data is not stored when connecting to the data source. |
Configuring Date Parameters
You can configure the URL of the API request with templates containing date queries. The queries will be updated with the respective date values.
Syntax{{:today()}}:It is used for single calendar related method.
Or
Syntax{{:today().adddays(1)}}:It is used when more than one method is added.
For example,a dummy API is used to explain here
Now, this URL will be parsed, and templates will be matched. Therefore, the templates will be replaced with dates accordingly. This will help you fetch data between the start date and end date.
Functions supported in date parameters
You can configure parameters as numeric values for the following functions: AddMinutes, AddHours, AddDays, AddWeeks, AddMonths, AddYears, AddQuarters, SetDayStart, and SetMonthStart.
All the Add methods should not have a parameter of 0. The SetDayStart function should have a numerical value between 0 and 6, and the SetMonthStart function should have a numerical value between 1 and 12.
String parameters are utilized in the following set of functions: start, end, format, and SetTimeZone. Both the start and end functions support four string parameters - week, month, quarter, and year. The format function is utilized to modify the format of date and time, with the parameter aligning with the date and time format supported in C#. Additionally, support for epoch time is available in the format function. The SetTimeZone function is utilized to alter the time zone of the date, with the parameter aligning with TimeZoneInfo IDs present in C#.
Today function does not hold any parameters.
Here for example concern we are using today()as 11/16/2018 12:17
| Function Name | Type(s) Used | Description | Example(s) | Result |
|---|---|---|---|---|
| Today | No Parameter | Sets date and time to current date and time. | {{:today()}} | 11/16/2018 12:17 |
| AddMinutes | Numerical | Updates the date and time by changing the number of minutes. | {{:today().addminutes(10)}} | 11/16/2018 12:27 |
| AddHours | Numerical | Updates the date and time by changing the number of hours. | {{:today().addminutes.addhours(2)}} | 11/16/2018 14:29 |
| AddDays | Numerical | Updates the date and time by changing the number of days. | {{:today().adddays(2)}} | 11/18/2018 12:17 |
| AddWeeks | Numerical | Updates the date time by adding a date with the numerical parameter considered as 7 days. | {{:today().addweeks(1)}} | 11/23/2018 12:17 |
| AddMonths | Numerical | Updates date and time by adding months with numerical parameter. | {{:today().addmonths(2)}} | 1/16/2018 12:17 |
| AddYears | Numerical | Updates date and time by adding years with the numerical parameter. | {{:today().addyears(3)}} | 11/16/2020 12:17 |
| AddQuarters | Numerical | Updates date and time by adding months with a numerical parameter, where parameter value 1 means 3 months. | {{:today().adddays(10).addquarters(2)}} | 5/26/2019 12:17 |
| Start | String | Sets the date and time values to the start of the given string parameter. | {{:today.addweeks(2).start(week)}} | 11/25/2018 00:00 |
| End | String | Sets the date and time value to the end of the given string parameter. | {{:today().addmonths(4).end(year{{}})}} | 12/31/2019 00:00 |
| Format | String | Formats the date and time to the correct date format entered as string parameter. | {{:today().start(week).format(MM/dd/yyyy)}} | 11/11/2018 |
| SetTimeZone | String | Changes the time zone to the time zone entered as string parameter. | {{:today().settimezone(New Zealand Time Zone)}} | 11/16/2018 19:47 |
| SetDayStart | Numerical | Updates the date to the day of the week based on the entered numerical parameter. | {{:today().Setdaystart(1)}} | 11/12/2018 12:17 |
| SetMonthStart | Numerical | Updates the date to change the month based on the entered numerical parameter | {{:today().SetMonthStart(10)}} | 10/16/2018 12:17 |
NOTE: Each template should start with the today function as a mandatory requirement. If the format function is used in a template, it should be the last function call.