Connecting Bold BI to Salesforce Reports data source
The Bold BI dashboard designer supports connecting to Salesforce Reports web services through the REST API.
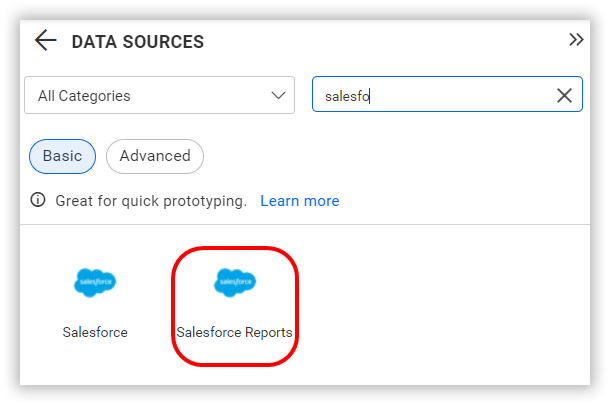
Choose Salesforce Reports data source
To configure the Salesforce Reports data source, follow the below steps:
-
Click on the Data Sources button in the configuration panel to add a new data connection.

-
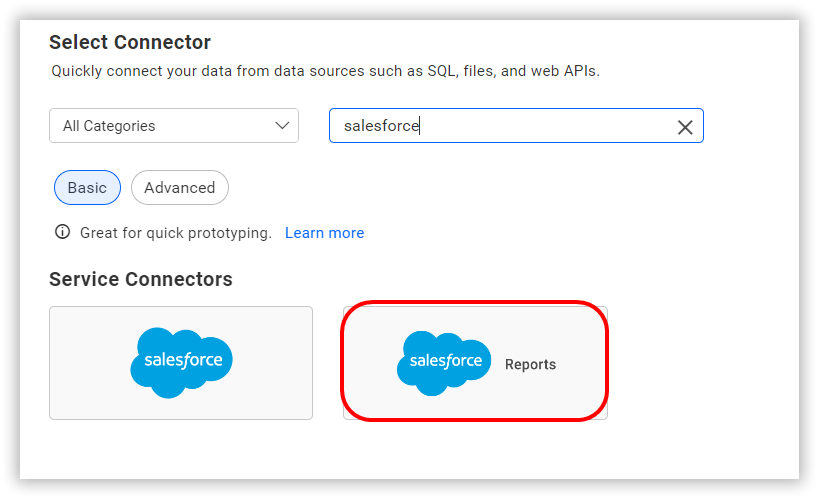
Click CREATE NEW to launch a new connection from the connection panel.
-
Select the Salesforce Reports connection in the connection panel.
NOTE: You can also create a data source from the home page by clicking on the Data Sources menu on the left menu panel and selecting Create Data Source from the data sources page.
Authentication with Salesforce Reports
Follow these steps to authenticate with the Salesforce Reports web service:
-
Click on the data source to open a login window. Enter your Salesforce Reports account credentials to authorize access.
-
Click Allow in the authorization window to accept the requested scopes by Bold BI dashboards.
NOTE: If permission is denied, the account will not be accessible from the dashboard.
-
Provide a name to identify the account and click Next.
-
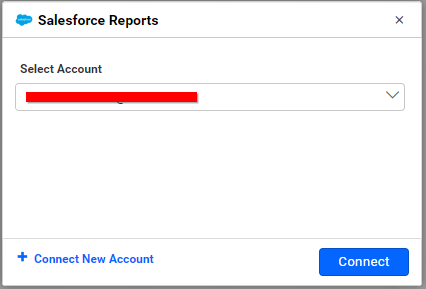
Your connection has been successfully authorized. Click Connect to proceed with the data source connection.
-
To connect using an already connected account, refer to Connected Accounts.
NOTE: To connect to another account click Connect New Account.
Connect to Salesforce Reports
Create Salesforce Reports data source
After successful authentication, the NEW DATA SOURCE configuration panel will open. Follow the below steps to create Salesforce Reports data source.
- Enter a name and description (optional) for the data source.
- Choose the Extract Engine
- Reports that exist in your account will be listed in the dropdown. Select the report from the list. You can also use the search box to filter the reports.
- Choose a time interval for Refresh Settings using the combo box to trigger the Rest API request periodically to keep the data in sync with our dashboard.
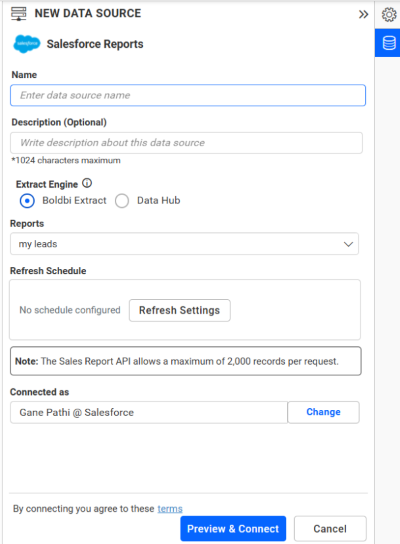
NOTE: Supported report types are - Tabular, Matrix and Summary.
You can also edit the connection information that set here by using the Edit Connection option.
For more information on the API endpoints that are available for this data source, refer to the official Salesforce-reports API documentation
Additional information
| Refresh Settings | The period of time before the next refresh call is triggered. This will automatically trigger a call for the API configured in the data source to keep the data up to date. If you do not want to sync your new data, choose 'Never'. |
Preview and data import
-
Click Preview & Connect to connect with the configurations that have been set.
-
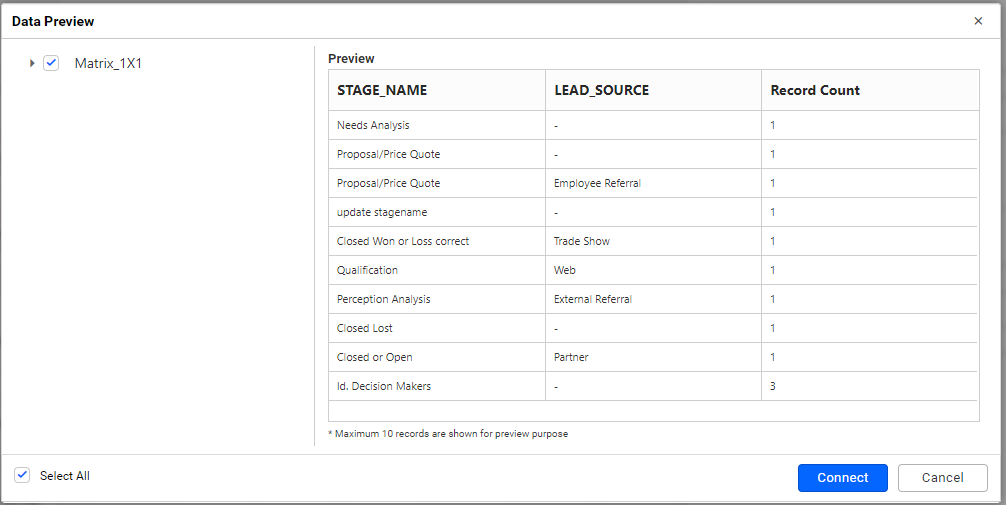
The Choose Schema(s) dialog opens. The schema represents the key fields of JSON data retrieved from Salesforce Reports Rest API request. This dialog displays a list of schemas in a treeview and its corresponding values in grid for preview. Select required schema(s) from treeview to use in designer and click Connect.
-
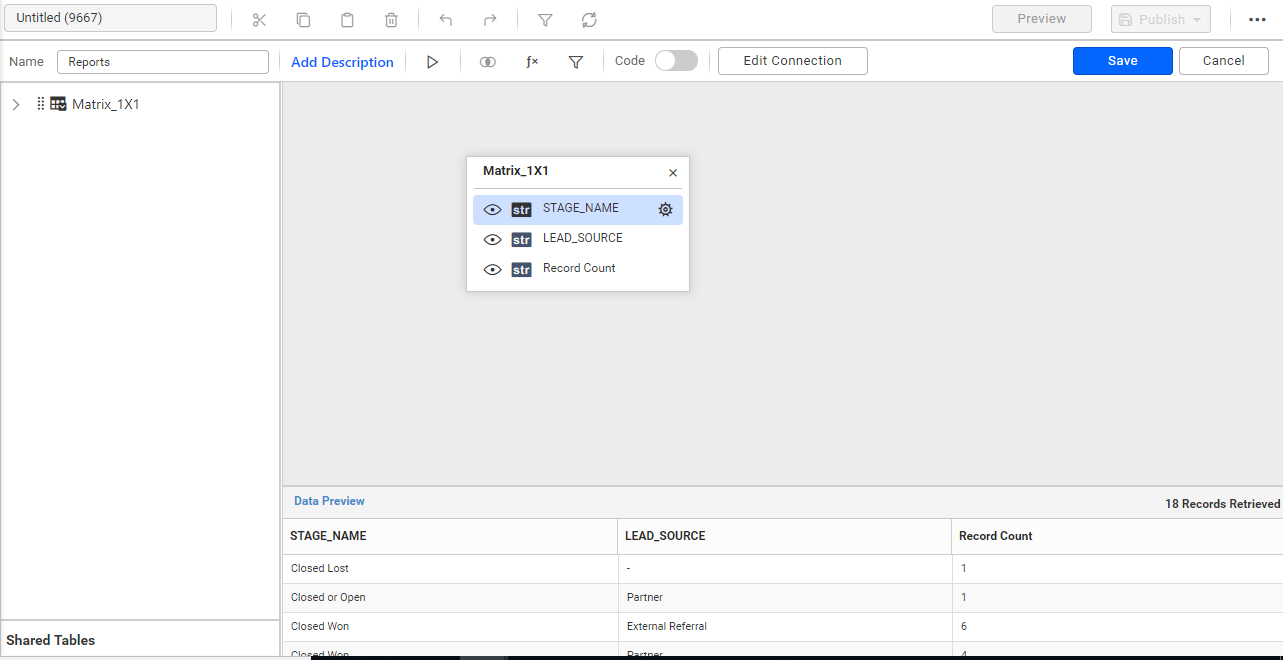
Now, the data design view page with the selected table schema opens. Drag and drop the table.
-
Click Save to save the data source with a relevant name.
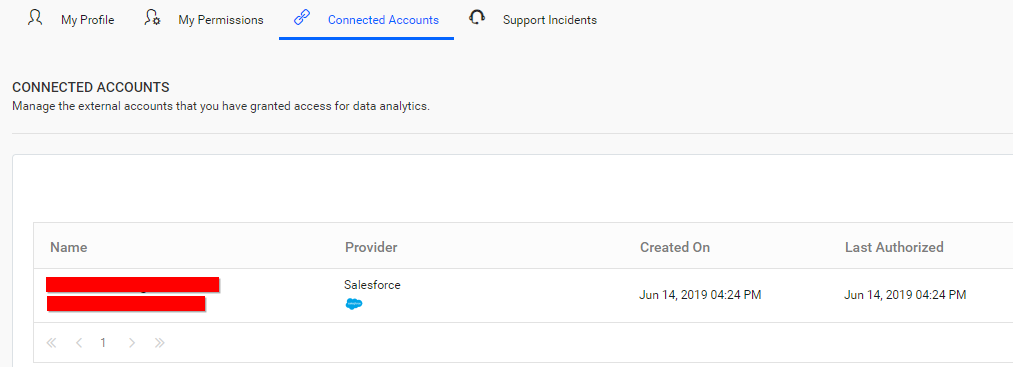
Connected accounts for OAuth data sources
If you have already logged into the account and authenticated with the web data source, the account information will be listed here. You can select one of the accounts or connect to a new account by clicking the Connect New Account button.
You can edit, delete and re-authorize this account from the Connected Accounts page.