Members
dashboardId
string
Defines the ID of the dashboard to be embedded from your Bold BI application.
- Required: Yes
- Default:
""(empty)
Example
var dashboard = BoldBI.create({
     dashboardId: "5cb065f7-dabb-4b0c-9b45-c60a5730e963"
});
dashboard.loadDashboard();
dashboardPath
string
Stores the dashboard path in the format of category name followed by dashboard name.
- Syntax:
/{category-name}/{dashboard-name} - Default:
""(empty)
Example
var dashboard = BoldBI.create({
     dashboardPath: "/Samples/Sample Dashboard"
});
dashboard.loadDashboard();
embedContainerId
string
The ID of a div element in which the dashboard will be initialized and rendered.
- Required: Yes
- Default:
""(empty)
Example
<div id="container"></div>
<script>
     var dashboard = BoldBI.create({
          embedContainerId: "container",
     });
     dashboard.loadDashboard();
</script>
embedToken
string
This property is used to pass the access token generated by the Embed Authorization Server, helping reduce redundant API calls and improve performance. Supported from version 12.1—ensure you’re using the compatible SDK and build. You can either provide the token directly or configure an authorization server. If the server is configured, setting the token manually is not required. A sample implementation is available to demonstrate how the API works.
- Default:
""(empty)
Example
var dashboard = BoldBI.create({
    embedToken: "eyJhbGciOiJIUzI1NiIsInR5cCI6IkpXVCJ9.eyJlbWFpbCI6ImRldm9wc0Bib2xkYmkuY29tIiwidXBuIjouYm9sZGJpZGVtby5jb20vYmkvc2l0ZS9zaXRlMSIsImF1ZCI6Imh0dHBzOi8vaG90Zml4LXdpbmRvd3MuYm9sZGJpZGVtby5jb20vYmkvc2l0ZS9zaXRlMSJ9.JzbqVr6Brv1mAEvnbHnE-FuShos"
});
dashboard.loadDashboard();
environment
object
Specifies the type of Bold BI application, either Cloud or Enterprise edition.
- Possible Values:
BoldBI.Environment.CloudBoldBI.Environment.Enterprise
- Default:
BoldBI.Environment.Enterprise
Example
var dashboard = BoldBI.create({
    environment: BoldBI.Environment.Enterprise
});
dashboard.loadDashboard();
expirationTime
number
This property allows you to set the expiration time for the access token, in seconds. You can customize the duration based on your application’s needs. The maximum allowed value is 604800 seconds (7 days). The minimum recommended value depends on your security and session requirements.
- Required: No
- Default:
86400(24 hours)
Example
var dashboard = BoldBI.create({
    expirationTime: 100000
});
dashboard.loadDashboard();
filterParameters
string
This parameter allows users to filter dashboard data dynamically by passing values through the URL parameters or dashboard parameters.
- Supported Cases:
- URL Parameter:
{column_name}={value1},{value2},{value3}orIN({value1},{value2}) - Dashboard Parameter:
{parameter_name}={parameter_value}orIN({value1},{value2}) - Multiple URL Parameters:
{column_name1}={value1}&{column_name2}={value2} - Multiple Dashboard Parameters:
{parameter_name}={parameter_value}&{parameter_name1}={parameter_value1} - Combination:
{column_name}={value1},{value2}&{parameter_name}={parameter_value}or vice versa
- URL Parameter:
- Default:
""(empty)
Examples URL Parameter
var dashboard = BoldBI.create({
    filterParameters: "Continent=Asia,Africa,Europe"
});
dashboard.loadDashboard();
Dashboard Parameter (Literal)
var dashboard = BoldBI.create({
    filterParameters: "Department_DP=Sales"
});
dashboard.loadDashboard();
Dashboard Parameter (List)
var dashboard = BoldBI.create({
    filterParameters: "Department_DP=IN(Sales,Marketing)"
});
dashboard.loadDashboard();
Multiple URL Parameters
var dashboard = BoldBI.create({
    filterParameters: "Continent=Asia&Direction=East"
});
dashboard.loadDashboard();
Multiple Dashboard Parameters
var dashboard = BoldBI.create({
    filterParameters: "Department_DP=Sales&Feedback=Good"
});
dashboard.loadDashboard();
Combination of URL and Dashboard Parameters
var dashboard = BoldBI.create({
    filterParameters: "Continent=Asia,Africa,Europe&Department_DP=Sales"
});
dashboard.loadDashboard();
height
string
Defines the height of the embedding module in percentages or pixels.
- Optional: Yes
- Default: Inherits from the parent container
Example
var dashboard = BoldBI.create({
    height: "800px"
});
dashboard.loadDashboard();
mode
object
Defines the dashboard rendering mode.
- Possible Values:
BoldBI.Mode.ViewBoldBI.Mode.DesignBoldBI.Mode.ConnectionBoldBI.Mode.DataSourceBoldBI.Mode.AIAssistant
- Default:
BoldBI.Mode.View
Example
var dashboard = BoldBI.create({
     mode: BoldBI.Mode.View,
});
dashboard.loadDashboard();
nonce
string
Set the nonce property if Content Security Policy (CSP) is enabled in the client application. This allows Bold BI’s script files to load and execute securely by matching the nonce value declared in the CSP meta tag.
- Required: No
- Default:
""(empty) - Note: The same unique value must be used in both the
noncemember and the meta tag.
Example
<meta http-equiv="Content-Security-Policy" content="script-src 'self' 'nonce-8beb50ac-fc1d-4106-ba6b-798835ac0c1b'">
var dashboard = BoldBI.create({
     nonce = "8beb50ac-fc1d-4106-ba6b-798835ac0c1b"
});
dashboard.loadDashboard();
serverUrl
string
The URL of the Bold BI application.
- Required: Yes
- Default:
""(empty)
Example
var dashboard = BoldBI.create({
     serverUrl: "https://mydashboard.com/bi/site/site1",
});
dashboard.loadDashboard();
token
string
Authenticates the dashboard without implementing the Authorization server endpoint. Required only if the Authorization url API is not configured. Refer to the token generation documentation for details.
- Default:
""(empty)
Example
var dashboard = BoldBI.create({
     token: "NjQ2ZDgwZjgtN2Q3MS00ZDQwLWFkNTItYTdkNDRhOGE2NmVi", // Use the generated API key
});
dashboard.loadDashboard();
To learn about the available limited supporting methods in embedding.
viewId
string
The unique ID of a Dashboard View to render the dashboard with filter view applied.
- Default value :
""(empty)
Example
var dashboard = BoldBI.create({
     viewId: "b64aebef-58ca-4033-b81a-39350c849b75"
});
dashboard.loadView();
viewName
string
The name of a Dashboard View to render the dashboard with filter view applied. dashboardId is mandatory to use along with this member.
- Default value :
""(empty)
Example
var dashboard = BoldBI.create({
     dashboardId: "5cb065f7-dabb-4b0c-9b45-c60a5730e963",
     viewName: "view 1"
});
dashboard.loadView();
width
string
Defines the width of the embedding module in percentages or pixels.
- Optional: Yes
- Default: Inherits from the parent container
Example
var dashboard = BoldBI.create({
     width:"1200px", //The dashboard is now rendered with a width of 1200px.
});
dashboard.loadDashboard();
authorizationServer
url
string
Any application that embeds a Bold BI dashboard and widget needs to authenticate with the Bold BI server. This authentication flow requires sending confidential information such as user email, group details, and embed signature to the Bold BI server. Therefore, you must implement this authentication flow in your server application and provide the URL for connecting to your server in the Bold BI embed instance. Refer to the authorization server documentation for details.
- Required: Yes (If token or embedToken APIs are not used)
- Default:
""(empty)
Example
var dashboard = BoldBI.create({
     authorizationServer: {
          url:"https://serversample.com/embed-details/get",
     }
});
dashboard.loadDashboard();
headers
object
Transmits custom data or header values to the embedding application’s Authorization Server. As a result, you may find this value in the headers of the Authorization Server API.
- Optional: Yes
- Default:
{}(empty object) - Note: Please refer to the Knowledge Base article to know more.
Example
var dashboard = BoldBI.create({
     authorizationServer:{
          headers: {
               "Cookie": "Set-Cookie: sessionId=38afes7a8",
          }
     }
});
dashboard.loadDashboard();
settings
azureMapRequired
boolean
Specifies whether Azure Map-related files need to be downloaded.
- Default:
false - Note: Set to
trueif the dashboard contains a Azure Map widget.
Example
var dashboard = BoldBI.create({
    settings: {
        azureMapRequired: false
    }
});
dashboard.loadDashboard();
bingMapRequired
boolean
Specifies whether Bing Map-related files need to be downloaded.
- Default:
false - Note: Set to
trueif the dashboard contains a Bing Map widget.
Example
var dashboard = BoldBI.create({
    settings: {
        bingMapRequired: false
    }
});
dashboard.loadDashboard();
hideErrorMessage
boolean
Enables or disables the display of error messages inside the dashboard container. The onError event is a callback function used to catch and handle errors that occur during the dashboard embedding process.
- Default:
false - Use Case: Set to
trueto suppress embedded error UI and handle errors via a custom callback.
Example
var dashboard = BoldBI.create({
    settings: {
        hideErrorMessage: true,
        events: {
            onError: function (args) {
                var dashboardContainer = document.getElementById("dashboard");
                dashboardContainer.innerHTML = "Authorization is failed. Please provide valid authorization server.";
            }
        }
    }
});
dashboard.loadDashboard();
restrictMobileView
boolean
Restricts the mobile view on desktop when the browser width reaches a specified threshold.
- Default:
false
Example
var dashboard = BoldBI.create({
    settings: {
        restrictMobileView: true
    }
});
dashboard.loadDashboard();
aiAssistant
Note: Please use the SDK and Bold BI server from the same version. Starting from version 13.1, the AI Assistant settings are restructured.
enabled
boolean
Enables the AI Assistant for generating and modifying widgets using natural language queries. The AI Assistant enhances widget creation and customization by leveraging advanced AI models, making data visualization more intuitive and accessible. This feature is available in both Cloud and Enterprise editions for Dashboard Viewer, and Dashboard Designer embeddings.
- Default:
false - Note: Ensure the SDK and Bold BI server versions match. Refer to here for more details.
Example
var dashboard = BoldBI.create({
    settings: {
        aiAssistant: {
            enabled: true
        }
    }
});
dashboard.loadDashboard();
exploreMessage
string
Note: This exploreMessage member API is supported from v15.1.
Customize the explore message title displayed in the AI Assistant chat window. Requires the enabled member API.
- Default:
""(empty)
Example
var dashboard = BoldBI.create({
    settings: {
        aiAssistant: {
            enabled: true,
            exploreMessage: 'This is explore message in Embed AI Chat.'
        }
    }
});
dashboard.loadDashboard();
helpLink
boolean
Specifies whether to show or hide the AI Chat Help icon in the AI Assistant window. Requires the aiassistantenabled to be set.
- Default:
false
From version 14.1 and later Example
var dashboard = BoldBI.create({
    mode: BoldBI.Mode.AIAssistant,
    settings: {
        aiAssistant:{
            enabled: true,
            hideIcons: {
                helpLink: true
            }
        }
    }
});
dashboard.loadAIAssistant();
Before version 14.1 (v13.2 and earlier)
Example
var dashboard = BoldBI.create({
    settings: {
        aiAssistant: {
            enabled: true,
            hideChatHelp: true
        }
    }
});
dashboard.loadDashboard();
name
string
Customizes the title of the AI Assistant as desired. Requires the enabled member API.
- Default:
""(empty)
Example
var dashboard = BoldBI.create({
    settings: {
        aiAssistant: {
          enabled: true,
          name: "Embedded AI"
        }
    }
});
dashboard.loadDashboard();
usageAnalytics
boolean
Specifies whether to show or hide the AI Data Usage icon in the AI Assistant window. Requires the aiassistantenabled to be set.
- Default:
false
From version 14.1 and later Example
var dashboard = BoldBI.create({
    mode: BoldBI.Mode.AIAssistant,
    settings: {
        aiAssistant:{
            enabled: true,
            hideIcons: {
                usageAnalytics: true
            }
        }
    }
});
dashboard.loadAIAssistant();
Before version 14.1 (v13.2 and earlier)
Example
var dashboard = BoldBI.create({
    settings: {
        aiAssistant: {
            enabled: true,
            hideUsageAnalytics: true
        }
    }
});
dashboard.loadDashboard();
userName
string
Customizes the username of the AI Assistant as desired. Requires the enabled member API.
- Default:
""(empty)
Example
var dashboard = BoldBI.create({
    settings: {
        aiAssistant: {
          enabled: true,
          userName: "Embedded AI user"
        }
    }
});
dashboard.loadDashboard();
summary.enabled
boolean
Specifies whether to show or hide the dashboard and widget summary option. Requires the enabled member API only when using Bold BI version up to v14.1.11.
- Default:
false
var dashboard = BoldBI.create({
    settings: {
        aiAssistant: {
            enabled: true,  // Required only when using Bold BI version up to v14.1.11
            summary: {
               enabled: true
            }
        }
    }
});
dashboard.loadDashboard();
summary.dashboard
boolean
Specifies whether to show or hide the AI Dashboard Summary option in the dashboard banner. Requires aiassistantenabled only when using Bold BI version up to v14.1.11 and summaryenabled member APIs.
- Default:
false - Note: Supported only in versions prior to 13.1. From 13.1 onwards, use
settings.aiAssistant.summary.dashboard.
Default value
Example
var dashboard = BoldBI.create({
    settings: {
        aiAssistant: {
            enabled: true,  // Required only when using Bold BI version up to v14.1.11
            summary: {
               enabled: true,
               dashboard: true
            }
        }
    }
});
dashboard.loadDashboard();
summary.widget
boolean
Specifies whether to show or hide the AI Widget Summary option in the widgets. Requires aiassistantenabled only when using Bold BI version up to v14.1.11 and enableAiSummary member APIs.
- Default:
false - Note: Supported only in versions prior to 13.1. From 13.1 onwards, use
settings.aiAssistant.summary.widget.
Example
var dashboard = BoldBI.create({
    settings: {
        aiAssistant: {
            enabled: true,  // Required only when using Bold BI version up to v14.1.11
            summary: {
               enabled: true,
               widget: true
            }
        }
    }
});
dashboard.loadDashboard();
aiSummaryIntroMessage
string
Note: This aiSummaryIntroMessage member API is supported from v15.2.
Customize the description of AI-generated dashboard summary in the AI Dashboard Summary option. Requires aiassistantenabled and summaryenabled member APIs.
- Default:
""(empty)
Example
var dashboard = BoldBI.create({
    settings: {
        aiAssistant: {
            enabled: true,
            aiSummaryIntroMessage: 'This is a custom description message on the dashboard summary in Embed AI.',
            summary: {
               enabled: true,
               dashboard: true
            }
        }
    }
});
dashboard.loadDashboard();
welcomeMessage
string
Note: This welcomeMessage member API is supported from v15.1.
Customize the welcome message title displayed in the AI Assistant chat window. Requires the enabled member API.
- Default:
""(empty)
Example
var dashboard = BoldBI.create({
    settings: {
        aiAssistant: {
            enabled: true,
            welcomeMessage: 'This is welcome message in Embed AI Chat.'
        }
    }
});
dashboard.loadDashboard();
dashboardSuggestions
Note: This dashboardSuggestions member API is supported from v15.1.
dashboardSuggestions.title
string
Customize the dashboard title displayed in the AI Assistant chat window of Create Dashboard embedding. Requires the enabled member API.
- Default:
""(empty)
Example
var dashboard = BoldBI.create({
    settings: {
        aiAssistant: {
            enabled: true,
            dashboardSuggestions: {
                title: "This is dashboard title in Embed AI Chat."
            }
        }
    }
});
dashboard.loadDashboard();
dashboardSuggestions.prompt
string
Customize the dashboard prompt message displayed in the AI Assistant chat window of Dashboard Viewer and Designer embeddings. Requires the enabled member API.
- Default:
""(empty)
Example
var dashboard = BoldBI.create({
    settings: {
        aiAssistant: {
            enabled: true,
            dashboardSuggestions: {
                prompt: "This is dashboard prompt message in Embed AI Chat."
            }
        }
    }
});
dashboard.loadDashboard();
widgetSuggestions
Note: This widgetSuggestions member API is supported from v15.1.
widgetSuggestions.title
string
Customize the widget title displayed in the AI Assistant chat window of Create Dashboard embedding. Requires the enabled member API.
- Default:
""(empty)
Example
var dashboard = BoldBI.create({
    settings: {
        aiAssistant: {
            enabled: true,
            widgetSuggestions: {
                title: "This is widget title in Embed AI Chat."
            }
        }
    }
});
dashboard.loadDashboard();
widgetSuggestions.prompt
string
Customize the widget prompt message displayed in the AI Assistant chat window of Dashboard Viewer and Designer embeddings. Requires the enabled member API.
- Default:
""(empty)
Example
var dashboard = BoldBI.create({
    settings: {
        aiAssistant: {
            enabled: true,
            widgetSuggestions: {
                prompt: "This is widget prompt message in Embed AI Chat."
            }
        }
    }
});
dashboard.loadDashboard();
brand
hideHelpLink
boolean
The hideHelpLink option allows you to show or hide the help icon in the AI Assistant chat window.
Default value
Example
var dashboard = BoldBI.create({
    settings: {
        brand: {
            hideHelpLink: true
        }
    }
});
dashboard.loadDashboard();
domain
string
The domain option allows you to define a link to your custom domain help documentation application instead of using our Bold BI help documentation link in the help icon of AI Assistant chat window.
Default value : empty
Example
var dashboard = BoldBI.create({
    settings: {
        brand: {
            domain: "https://yourdomain.com"
        }
     }
});
dashboard.loadDashboard();
brand.name
string
The name option allows you to customize the name in the AI Assistant chat window.
Default value : empty
Example
var dashboard = BoldBI.create({
    settings: {
        brand: {
            name: "Demo"
        }
     }
});
dashboard.loadDashboard();
designCanvas
margin
integer
Customize the margins of the dashboard using the corresponding integer values.
- Default:
null
Example
var dashboard = BoldBI.create({
    settings: {
        designCanvas: {
          margin: 30
        }
    }
});
dashboard.loadDashboard();
dynamicConnection
The dashboard server provides a dynamic connection string feature for fetching the data used to render the dashboard.
dynamicConnection.enabled
boolean
Specifies whether to show or hide the dynamic connection string feature.
- Default:
false
Example
var dashboard = BoldBI.create({
    settings: {
        dynamicConnection: {
            enabled: false
        }
    }
});
dashboard.loadDashboard();
identity
string
This property holds the values that will be passed to the API in the dynamic connection string feature. This allows the user to use this identity in their API for validation and providing the required connection string.
- Default:
""(empty)
Example
var dashboard = BoldBI.create({
    settings: {
        dynamicConnection: {
            enabled: false,
            identity: ""
        }
    }
});
dashboard.loadDashboard();
export
csv
boolean
Specifies whether to show or hide the CSV export option.
- Default:
true
Example
var dashboard = BoldBI.create({
    settings: {
        export: {
            csv: true
        }
    }
});
dashboard.loadDashboard();
excel
boolean
Specifies whether to show or hide the Excel export option.
- Default:
true
Example
var dashboard = BoldBI.create({
    settings: {
        export: {
            excel: true
        }
    }
});
dashboard.loadDashboard();
image
boolean
Specifies whether to show or hide the Image export option.
- Default:
true
Example
var dashboard = BoldBI.create({
    settings: {
        export: {
            image: true
        }
    }
});
dashboard.loadDashboard(); boolean
Specifies whether to show or hide the PDF export option.
- Default:
true
Example
var dashboard = BoldBI.create({
    settings: {
        export: {
            pdf: true
        }
    }
});
dashboard.loadDashboard();
language
hideDropdown
boolean
Displays or hides the dashboard localization dropdown in the dashboard banner.
- Default:
false - Note: Before setting dashboard localization at the embedding level, configure the
Localize Dashboardoption in the Bold BI Server dashboard designer. The dropdown is visible by default; usehideDropdownto hide it.
Example
var dashboard = BoldBI.create({
    settings: {
        language: {
            hideDropdown: true
        }
    }
});
dashboard.loadDashboard();
code
string
Contains the value to change the dashboard’s localization during initial rendering.
- Default:
""(empty) - Note: Before setting dashboard localization at the embedding level, configure the
Localize Dashboardoption in the Bold BI Server dashboard designer to enable language changes viacode.
Example
var dashboard = BoldBI.create({
    settings: {
        language: {
            code: "fr-FR"
        }
    }
});
dashboard.loadDashboard();
locale
The locale allows you to change the localization of the dashboard, modifying data based on the specified localization.
appLocale
string
Holds the value to change the language of the dashboard, data source, or widget.
- Default:
en-US - Note: Before setting the language at the embedding level, generate the respective language localization file in the Bold BI Server installed location. Refer to here to generate a new locale file.
Example
Note: The
fr-FRlanguage file has been generated in the Bold BI Server installed location.
var dashboard = BoldBI.create({
settings: {
locale: {
appLocale: "fr-FR"
}
}
});
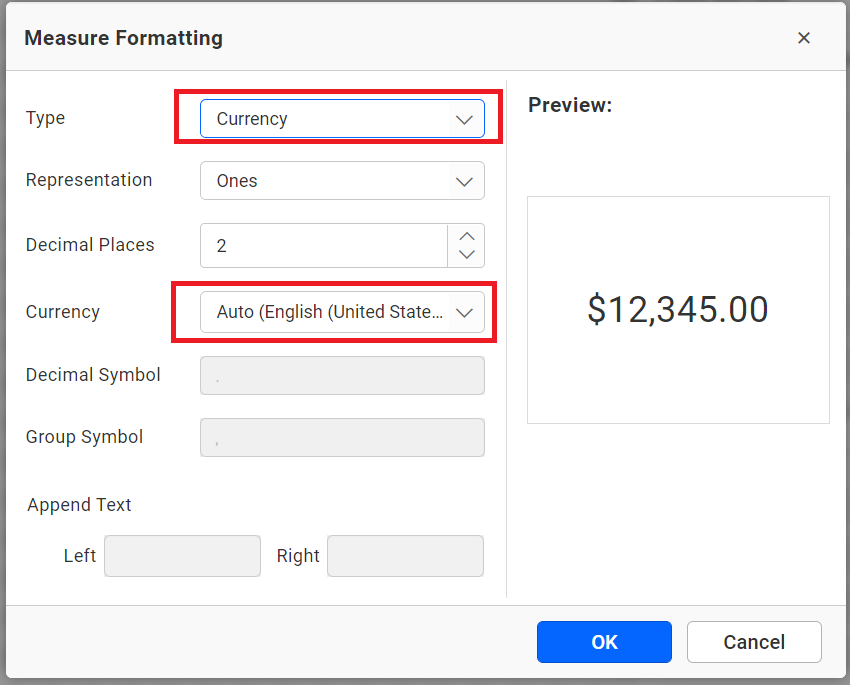
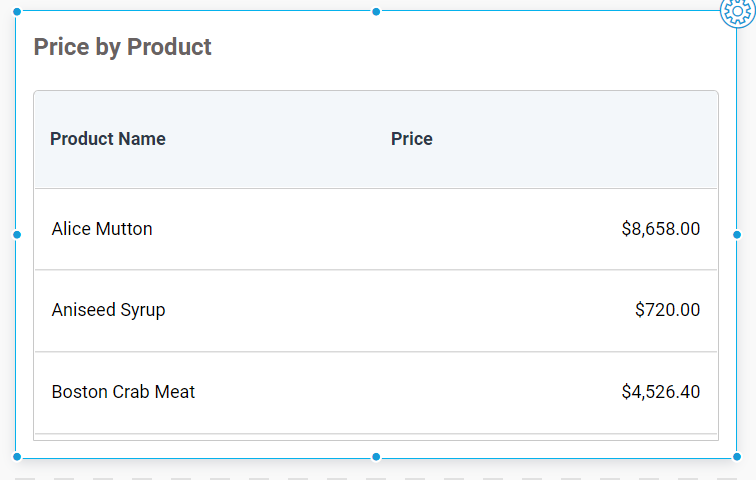
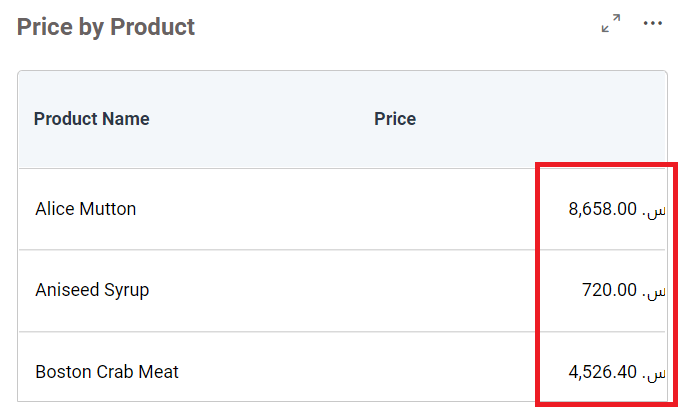
dashboard.loadDashboard();culture
string
Holds the value to change the dashboard’s culture, affecting formats like currency.
- Default:
en-US - Note: You can set the culture for the current user via the API in embedding. For example, configuring a widget to display currency defaults to
Auto (English(en-US)). After setting a custom culture, the widget reflects the new format.
Example
var dashboard = BoldBI.create({
    settings: {
        locale: {
          culture: "en-US"
        }
    }
});
dashboard.loadDashboard();
Additional Info:
- Default currency culture:
- Default grid view:
- Modified culture:
- Refer to Embedding In Your Application for setup steps. Use the
cultureSettingsAPI to adjust the culture post-embedding.
themes
appearance
string
Configures the custom theme for the embedded dashboard. This member allows you to set the overall visual style of the dashboard.
- Default:
light - Note: Custom theme files must be uploaded to the Bold BI Server. Refer to the Custom Theme documentation for details.
Example
var dashboard = BoldBI.create({
    settings: {
        theme: {
            appearance: "dark"
        }
    }
});
dashboard.loadDashboard();
application
string
Sets the custom theme for buttons, menus, and popup areas as the branding color.
- Note: When setting the
applicationtheme, you must also specify theappearancetheme; otherwise, the defaultlighttheme will be applied toappearance. Custom theme files must be uploaded to the Bold BI Server.
Example
var dashboard = BoldBI.create({
    settings: {
        theme: {
            appearance: "dark",
            application: "darkviolet" // Name under which the application theme file is saved in Bold BI Server.
        }
    }
});
dashboard.loadDashboard();
dashboard
string
Sets a custom theme for the dashboard by combining the appearance and application members.
- Note: When using the
dashboardoption, there is no need to setappearanceorapplicationseparately. Custom theme files must be uploaded to the Bold BI Server.
Example
var dashboard = BoldBI.create({
    settings: {
        theme: {
            dashboard: "greenMist" // Name under which the dashboard theme file is saved in Bold BI Server.
        }
    }
});
dashboard.loadDashboard();
localTheme
boolean
Specifies whether to directly reference a custom theme file in your embedding application. Set to true when referencing an external theme file (e.g., boldbi.theme.definition.min.css). Include the theme file in the HTML <head> tag.
- Default:
false
Example
<head>
    <script type="text/javascript" src="https://cdn.boldbi.com/embedded-sdk/v15.2.6/boldbi-embed.js"></script>
    <link rel="stylesheet" href="/path/to/theme/file/darkviolet.css">
</head>
<body onload="embedSample()">
    <div id="dashboard_container"></div>
    <script>
        function embedSample() {
            var boldbiEmbedInstance = BoldBI.create({
                settings: {
                    theme: {
                        localTheme: true
                    }
                }
            });
            boldbiEmbedInstance.loadDashboard();
        }
    </script>
</body>
fontFamily
string
Customizes the font of Bold BI embedded modules, such as the viewer, designer, data source, and pinboard embedding. The font file must be uploaded to the Bold BI Server. Use the name provided during upload. Refer to the Font documentation for details.
Example
var dashboard = BoldBI.create({
    settings: {
        theme: {
            fontFamily: "Patrick-hand" // Name under which the font family file is saved in Bold BI Server.
        }
    }
});
dashboard.loadDashboard();
viewData
allColumns
boolean
Specifies whether to show or hide the display of all columns in the table in the View Underlying Data of the widget.
- Default:
false
Example
var dashboard = BoldBI.create({
    settings: {
        viewData: {
            allColumns: true // Column options are all checked in the dashboard viewer.
        }
     }
});
dashboard.loadDashboard();
columnSelection
boolean
Specifies whether to show or hide the “Select Column” button in the view underlying data of the widget.
- Default:
true
Example
var dashboard = BoldBI.create({
    settings: {
        viewData: {
            columnSelection: false // Select column button will be hidden in the dashboard viewer.
        }
    }
});
dashboard.loadDashboard();
exporting
boolean
Specifies whether to show or hide the export option in the view underlying data of the widget.
- Default:
true
Example
var dashboard = BoldBI.create({
    settings: {
        viewData: {
            exporting: false // The Export option will be hidden in the dashboard viewer.
        }
     }
});
dashboard.loadDashboard();
viewer
dashboardName
Specifies whether or not to update the Dashboards name in the header section for a Single Tab Dashboard. For Multi Tab Dashboard, it specifies the unique ID of the dashboard and the name in which it should be rendered.
- Default:
- Single Tab Dashboard:
""(empty) - Multi Tab Dashboard:
[](empty array)
- Single Tab Dashboard:
- Note: For Multi Tab Dashboard, use an array of objects with
dashboardIdanddisplayNamepairs.
Example (Single Tab Dashboard)
var dashboard = BoldBI.create({
    settings: {
        viewer: {
            dashboardName: "name"
        }
    }
});
dashboard.loadDashboard();
Example (Multi Tab Dashboard)
var dashboard = BoldBI.create({
    settings: {
        viewer: {
            dashboardName: [
                { dashboardId: "fb63ae99-83b6-4752-97b7-890182a3729f", displayName: "value 1" },
                { dashboardId: "77fd95ce-ec8b-4f68-817c-f41cabfabd3a", displayName: "value 2" }
            ]
        }
    }
});
dashboard.loadDashboard();
dashboardParameter
boolean
Specifies whether to show or hide the Dashboard Parameter icon in dashboard banner.
- Default:
true
Example
var dashboard = BoldBI.create({
    settings: {
        viewer: {
            dashboardParameter: true
        }
    }
});
dashboard.loadDashboard();
edit
boolean
Specifies whether to show or hide the Edit icon in dashboard banner.
- Default:
false
Example
var dashboard = BoldBI.create({
    settings: {
        viewer: {
            edit: true
        }
    }
});
dashboard.loadDashboard();
viewer.export
boolean
Specifies whether to show or hide the Export button in dashboard banner.
- Default:
true
Example
var dashboard = BoldBI.create({
    settings: {
        viewer: {
            export: true
        }
    }
});
dashboard.loadDashboard();
fullScreen
boolean
Specifies whether to show or hide the Full Screen icon in dashboard banner.
- Default:
false
Example
var dashboard = BoldBI.create({
    settings: {
        viewer: {
            fullScreen: true
        }
    }
});
dashboard.loadDashboard();
header
boolean
Specifies whether to show or hide the header panel in the Dashboard Viewer.
- Default:
true
Example
var dashboard = BoldBI.create({
    settings: {
        viewer: {
            header: true
        }
    }
});
dashboard.loadDashboard();
refresh
boolean
Specifies whether to show or hide the Refresh icon in dashboard banner.
- Default:
true
Example
var dashboard = BoldBI.create({
    settings: {
        viewer: {
            refresh: true
        }
    }
});
dashboard.loadDashboard();
metrics
boolean
Specifies whether to show or hide the Metrics option in the dashboard banner.
- Default:
true
Example
var dashboard = BoldBI.create({
    settings: {
        viewer: {
            metrics: true
        }
    }
});
dashboard.loadDashboard();
moreOption
boolean
Specifies whether to show or hide the Option icon in dashboard banner.
- Default:
true
Example
var dashboard = BoldBI.create({
    settings: {
        viewer: {
            moreOption: true
        }
    }
});
dashboard.loadDashboard();
autoRefresh
The auto refresh feature allows you to configure the scheduled refreshing process of the dashboard. It is used to refresh the data based on the specified time.
autoRefresh.enabled
boolean
Enables or disables the auto-refresh feature for the dashboard.
- Default:
false
Example
var dashboard = BoldBI.create({
    settings: {
        viewer: {
            autoRefresh: {
                enabled: false
            }
        }
    }
});
dashboard.loadDashboard();
hourlySchedule.hours
number
Specifies the hourly time interval for auto-refreshing data.
- Default:
0
Example
var dashboard = BoldBI.create({
    settings: {
        viewer: {
            autoRefresh: {
                enabled: false,
                hourlySchedule: {
                    hours: 1
                }
            }
        }
    }
});
dashboard.loadDashboard();
hourlySchedule.minutes
number
Specifies the minute-by-minute time interval for auto-refreshing data.
- Default:
0
Example
var dashboard = BoldBI.create({
     settings: {
        viewer: {
            autoRefresh: {
                enabled: false,
                hourlySchedule: {
                    minutes: 10
                }
            }
        }
    }
});
dashboard.loadDashboard();
hourlySchedule.seconds
number
Specifies the second-by-second time interval for auto-refreshing data.
- Default:
0
Example
var dashboard = BoldBI.create({
     settings: {
        viewer: {
            autoRefresh: {
                enabled: false,
                hourlySchedule: {
                    seconds: 30
                }
            }
        }
    }
});
dashboard.loadDashboard();
filterOverview
filterOverview.enabled
boolean
Specifies whether to show or hide the Filter Overview icon in the dashboard banner.
- Default:
true
Example
var dashboard = BoldBI.create({
    settings: {
        viewer: {
            filterOverview: {
                enabled: true
            }
        }
    }
});
dashboard.loadDashboard();
saveAs
boolean
Specifies whether to display or hide the Save As option in the Filter Overview section of the dashboard banner.
- Default:
false
Example
var dashboard = BoldBI.create({
    settings: {
        viewer: {
            filterOverview: {
                enabled: true,
                saveAs: true // To enable save as option in filter overview
            }
        }
    }
});
dashboard.loadDashboard();
save
boolean
Specifies whether to display or hide the Save option in the filter overview section of the dashboard banner.
- Default:
false
Example
var dashboard = BoldBI.create({
    settings: {
        viewer: {
            filterOverview: {
                enabled: true,
                save: true // To enable save option in filter overview
            }
        }
    }
});
dashboard.loadDashboard();
viewSavedFilter
boolean
Specifies whether to display or hide the View Saved Filter option in the Filter Overview section of the dashboard banner. When clicked, it triggers the onSavedFilterClick event, allowing customization of the views dialog and additional actions.
- Default:
false
Example
var dashboard = BoldBI.create({
mode: BoldBI.Mode.View,
settings: {
viewer: {
filterOverview: {
enabled: true,
viewSavedFilter: true // To enable view saved filters option in filter overview
}
},
events: {
filters: {
onSavedFilterClick: function (args) {
// Retrieves the array of view information from 'args.viewInfos' and perform further actions.
console.log(args.viewInfos); //The 'args.viewInfos' contains a list of views in the form of an array.
}
}
}
}
});
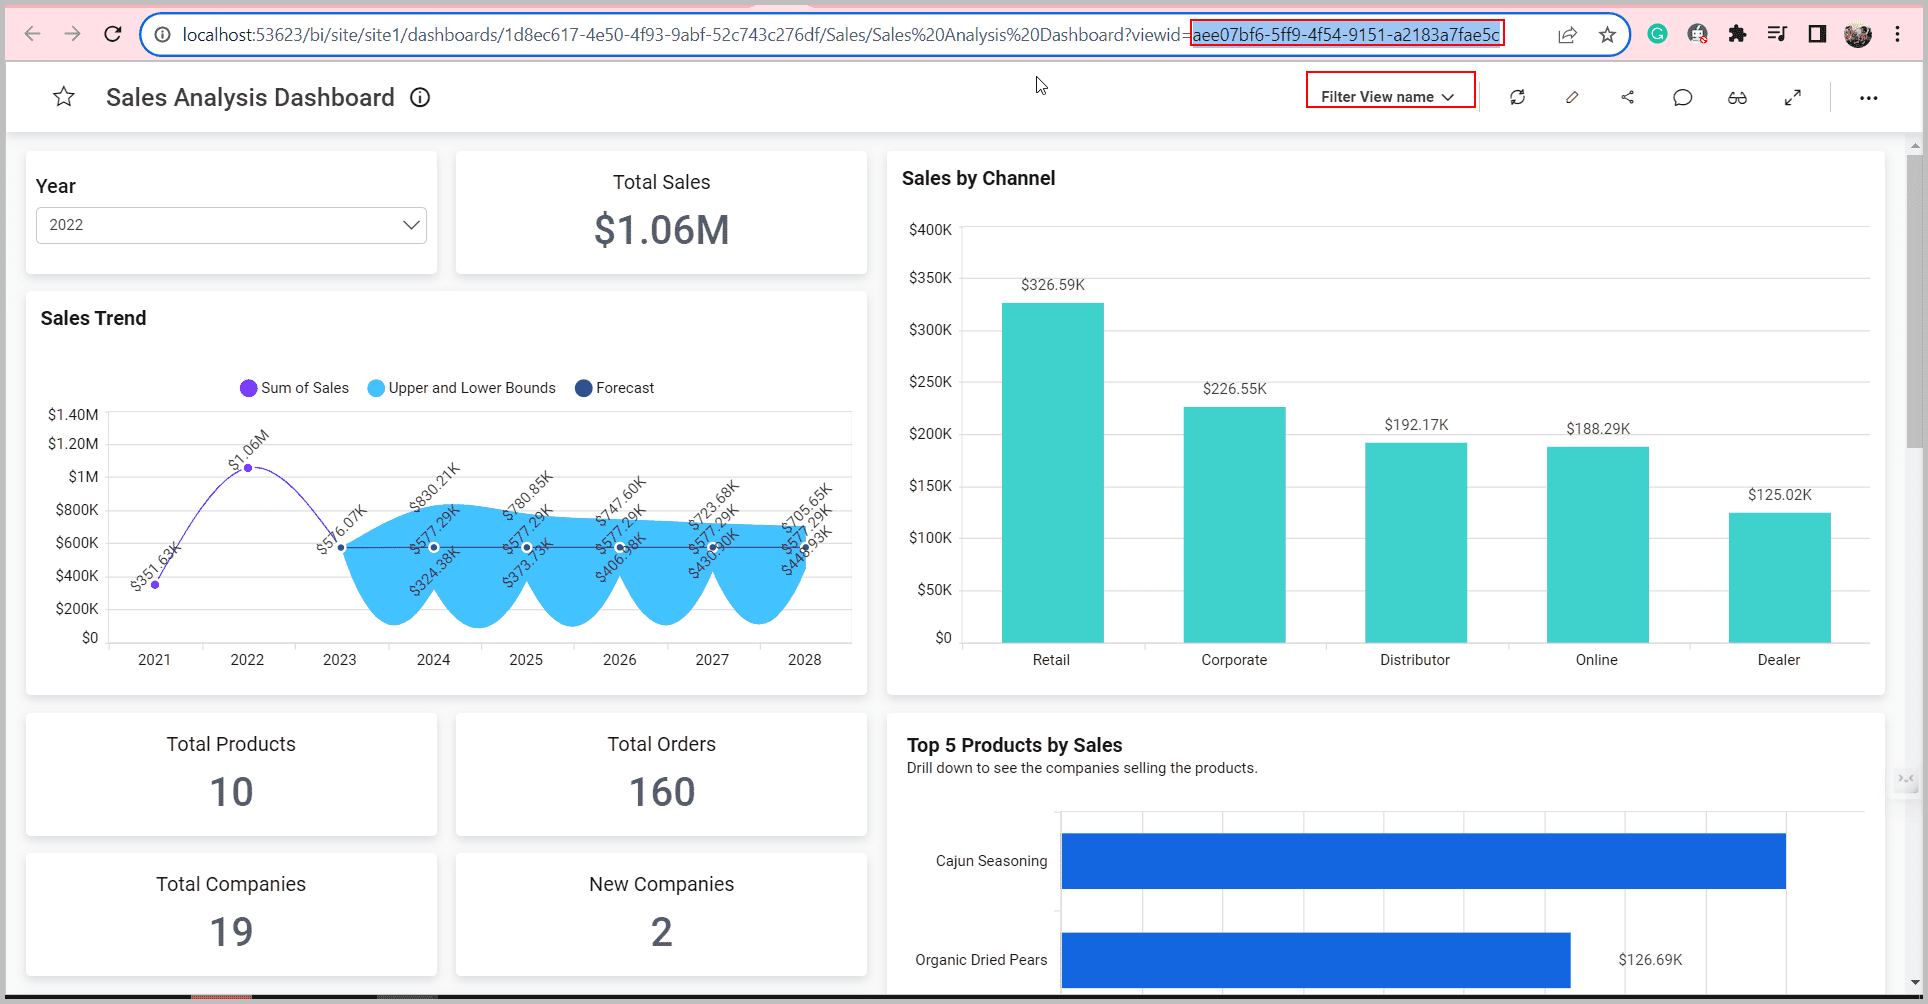
dashboard.loadDashboard();viewId
string
Allows embedding the dashboard with views by passing the viewId value, viewName, and query string in the filterParameters.
- Default:
""(empty) - Note: To obtain the view ID, extract it from the URL of the corresponding dashboard in its view. Refer to the Knowledge Base article for details on retrieving
viewNameand query string via the REST API. - Image Reference:
Example
var dashboard = BoldBI.create({
    settings: {
        viewer: {
            filterOverview: {
                enabled: true,
                viewId: '0732e6c9-f7d6-469a-85e0-a7a4b22dbb2a' // View ID
                viewName: 'Filter View' // View name
            }
        }
    },
    filterParameters: 'filterQuery=[{"ucn":"Column1","cn":"Orderdate","rn":"ComboBox2","ir":false,"ims":false,"fi":"92884626db4ffba31a49504a4864e4","ipw":false,"dimfi":{"c":"Include","t":["2022"]}}]', //query string of the respective view
});
dashboard.loadDashboard();
viewName
string
Allows embedding the dashboard with views by passing the viewName value and query string in the filterParameters.
- Default:
""(empty) - Note: Refer to the Knowledge Base article for details on retrieving
viewNameand query string via the REST API.
Example
var dashboard = BoldBI.create({
    settings: {
        viewer: {
            filterOverview: {
                enabled: true,
                viewName: 'Filter View' // View name
            }
        }
    },
    filterParameters: 'filterQuery=[{"ucn":"Column1","cn":"Orderdate","rn":"ComboBox2","ir":false,"ims":false,"fi":"92884626db4ffba31a49504a4864e4","ipw":false,"dimfi":{"c":"Include","t":["2022"]}}]', //query string of the respective view
});
dashboard.loadDashboard();
widgetContainer
boxShadow
string
Customize the box shadow of the widgets.
- Default:
""(empty)
Example
var dashboard = BoldBI.create({
    settings: {
        viewer: {
            widgetContainer: {
                boxShadow: "10px 10px lightblue"
            }
        }
    }
});
dashboard.loadDashboard();
widgetContainer.margin
integer
Customize the margins of the widget with the corresponding integer values.
- Default:
null - Note: Do not specify the
pxsuffix; only integer values are supported.
Example
var dashboard = BoldBI.create({
    settings: {
        viewer: {
            widgetContainer: {
                margin: 20
            }
        }
    }
});
dashboard.loadDashboard();