Members
dashboardId
string
The ID of the dashboard, which needs to be embedded in a page from your Bold BI application, is required.
Default value : empty
Example
var dashboard = BoldBI.create({
     dashboardId: "5cb065f7-dabb-4b0c-9b45-c60a5730e963"
});
dashboard.loadDashboard();
dashboardPath
string
This will store the dashboard path as the category name, followed by the dashboard name.
Syntax
Default value : empty
Example
var dashboard = BoldBI.create({
     dashboardPath: "/Samples/Sample Dashboard"
});
dashboard.loadDashboard();
dashboardIds
array of string []
The IDs of individual dashboards in the form of an array, which is used in the method loadMultitabDashboard() to embed programmatic multitab dashboard into your application.
Default value : empty
Example
var dashboard = BoldBI.create({
     dashboardIds: ["5cb065f7-dabb-4b0c-9b45-c60a5730e963","47415a2c-d1de-478d-9d9e-5e6adc6e530d"]
});
dashboard.loadMultitabDashboard();
dashboardPaths
array of string []
The paths of individual dashboards in the form of an array, which is used in the method loadMultitabDashboard() to embed programmatic multitab dashboard into your application.
Default value : empty
Example
var dashboard = BoldBI.create({
     dashboardPaths: ["/Samples/Sample Dashboard","/Support/Support Market Dashboard"]
});
dashboard.loadMultitabDashboard();
datasourceId
string
The ID of the datasource, which needs to be embedded in a page from your Bold BI application, is required.
Default value : empty
Example
var dashboard = BoldBI.create({
     datasourceId: "5cb065f7-dabb-4b0c-9b45-c60a5730e963"
});
dashboard.loadDatasource();
datasourceName
string
The name of the datasource, which needs to be embedded in a page from your Bold BI application, is required.
Default value : empty
Example
var dashboard = BoldBI.create({
     datasourceName: "Sample Datasource"
});
dashboard.loadDatasource();
disableAutoRecover
boolean
This specifies whether to show or hide the Auto Recover Popup in the Dashboard Designer.
Default value
Example
var dashboard = BoldBI.create({
     mode: BoldBI.Mode.Design,
     disableAutoRecover: false,
});
dashboard.loadDesigner();
embedContainerId
string
The ID of a div element in which the dashboard will be initialized and rendered.
Default value : empty
Example
<div id="container"></div>
<script>
     // Embed Dashboard
     var dashboard = BoldBI.create({
          embedContainerId: "container",
     });
     dashboard.loadDashboard();
</script>
embedType
object
There are two types of embedding available: component and iframe. In the component type, you will use the embedding SDK to render the dashboard. In the iframe type, you will load the dashboard URL in the iframe and the dashboard will be rendered.
Possible values
Default value
Example
var dashboard = BoldBI.create({
     embedType: BoldBI.EmbedType.Component,
});
dashboard.loadDashboard();
embedToken
string
Introduced a new API to store the Embed Authorization API access token and reduce redundant API calls, thereby improving performance.
Default value
Example
var dashboard = BoldBI.create({
     embedToken:  "eyJhbGciOiJIUzI1NiIsInR5cCI6IkpXVCJ9.eyJlbWFpbCI6ImRldm9wc0Bib2xkYmkuY29tIiwidXBuIjouYm9sZGJpZGVtby5jb20vYmkvc2l0ZS9zaXRlMSIsImF1ZCI6Imh0dHBzOi8vaG90Zml4LXdpbmRvd3MuYm9sZGJpZGVtby5jb20vYmkvc2l0ZS9zaXRlMSJ9.JzbqVr6Brv1mAEvnbHnE-FuShos",
});
dashboard.loadDashboard();
Note: This support was provided from v12.1. Please use v12.1 build and sdk to explore this api. Additionally we have created sample to explain how this api works.
environment
object
Environment refers to the type of Bold BI application. Bold BI offers both Cloud and Enterprise editions of the dashboard application. You need to assign your application type to this member.
Possible values
Default value
Example
var dashboard = BoldBI.create({
     environment: BoldBI.Environment.Enterprise,
});
dashboard.loadDashboard();
expirationTime
number
Specifies the access token expiration time of the dashboard in seconds.
Default value
Example
var dashboard = BoldBI.create({
     expirationTime:100000,
});
dashboard.loadDashboard();
filterParameters
string
This member supports filtering the dashboard in the following cases.
- Filtering with URL Parameter.
- Filtering with Dashboard Parameter.
- Filtering with Multiple URL Parameters.
- Filtering with Multiple Dashboard Parameters.
- Filtering with Combination of URL Parameter and Dashboard Parameter and vice versa.
Default value
Example
var dashboard = BoldBI.create({
     filterParameters: "Continent=Asia,Africa,Europe"
});
dashboard.loadDashboard();| Cases | Syntax | Example |
|---|---|---|
URL Parameter |
{column_name}={value1},{value2},{value3} |
|
Dashboard Parameter |
{parameter_name}={parameter_value} |
For Literals
|
Multiple URL Parameters |
{column_name1}={value1}&{column_name2}={value2} |
|
Multiple Dashboard Parameters |
{parameter_name}={parameter_value}&&{parameter_name1}={parameter_value1} |
|
Combination Of URL Parameter and Dashboard Parameter |
{column_name}={value1},{value2},{value3}&&{parameter_name}={parameter_value} |
|
Combination Of Dashboard Parameter and URL Parameter |
{parameter_name}={parameter_value}&{column_name}={value1},{value2},{value3} |
|
height
string
The height is an optional member of the API. You can define the height of the embedding module in either percentages or pixels, depending on your requirements. If you do not specify a height for the API, it will automatically take the dimensions of your embedding container. If no value is provided, it will inherit the height from the dimensions of the parent container of the embedding.
Example
var dashboard = BoldBI.create({
     height:"800px", //The dashboard is now rendered with a height of 800px
});
dashboard.loadDashboard();
hideErrorMessage
boolean
Enables or disables the display of error messages inside the dashboard container. When set to true, embedded error UI will be suppressed. This is useful when you want to handle errors via a custom callback or log them silently.
Default value
Example
var dashboard = BoldBI.create({
     hideErrorMessage: true,
     onError: function (args) {
         var dashboardContainer = document.getElementById("dashboard");
         dashboardContainer.innerHTML = "Authorization is failed. Please provide valid authorization url.";
     },
});
dashboard.loadDashboard();
isBingMapRequired
boolean
Specifies whether the bingMap related files need to be downloaded or not.
NOTE: If your dashboard contains a bingMap widget, you should set it as true.
Default value
Example
var dashboard = BoldBI.create({
     isBingMapRequired: false,
});
dashboard.loadDashboard();
mode
object
Mode refers to the dashboard rendering mode, such as view, design, connection, and datasource. The default value was “view,” which is used to render the dashboard for viewing.
Possible values
Default value
Example
var dashboard = BoldBI.create({
     mode: BoldBI.Mode.View,
});
dashboard.loadDashboard();
nonce
string
This API member allows you to bypass or load dependencies from the Bold BI server via the Embed SDK wrapper using a nonce source when the Content Security Policy is enabled in your application. Set any unique value here. The same unique value must be used in both the nonce member and meta tag as follows.
Example
<meta http-equiv="Content-Security-Policy" content="script-src 'self' 'nonce-8beb50ac-fc1d-4106-ba6b-798835ac0c1b'">

var dashboard = BoldBI.create({
     nonce = "8beb50ac-fc1d-4106-ba6b-798835ac0c1b"
});
dashboard.loadDashboard();
pinboardName
string
The pinboard that needs to be embedded in a page from your Bold BI application needs to be named.
Default value : empty
Example
var pinboard = BoldBI.create({
     pinboardName: "Pinboard Name"
});
pinboard.loadPinboard();
restrictMobileView
boolean
This property allows users to restrict the mobile view on desktop when the browser width reaches a specified pixel threshold.
Default value
Example
var dashboard = BoldBI.create({
     restrictMobileView: true,
});
dashboard.loadDashboard();
serverUrl
string
The Bold BI application URL needs to be assigned to this member.
Default value : empty
Example
var dashboard = BoldBI.create({
     serverUrl: "https://mydashboard.com/bi/site/site1",
});
dashboard.loadDashboard();
token
string
By using token API member, able to authenticate the dashboard in your application without implementing the AuthorizeAPI endpoint. Refer token generation section for generating 2 different tokens.
Default value : empty
Example
var dashboard = BoldBI.create({
     token: "eyJhbGciOiJIUzI1NiIsInR5cCI6IkpXVCJ9.eyJlbWFpbCI6ImRldm9wc0Bib2xkYmkuY29tIiwidXBuIjouYm9sZGJpZGVtby5jb20vYmkvc2l0ZS9zaXRlMSIsImF1ZCI6Imh0dHBzOi8vaG90Zml4LXdpbmRvd3MuYm9sZGJpZGVtby5jb20vYmkvc2l0ZS9zaXRlMSJ9.JzbqVr6Brv1mAEvnbHnE-FuShos", // Use the generated Personal Access token
});
dashboard.loadDashboard();

var dashboard = BoldBI.create({
     token: "NjQ2ZDgwZjgtN2Q3MS00ZDQwLWFkNTItYTdkNDRhOGE2NmVi", // Use the generated API key
});
dashboard.loadDashboard();
To learn about the available limited supporting methods in embedding.
viewId
string
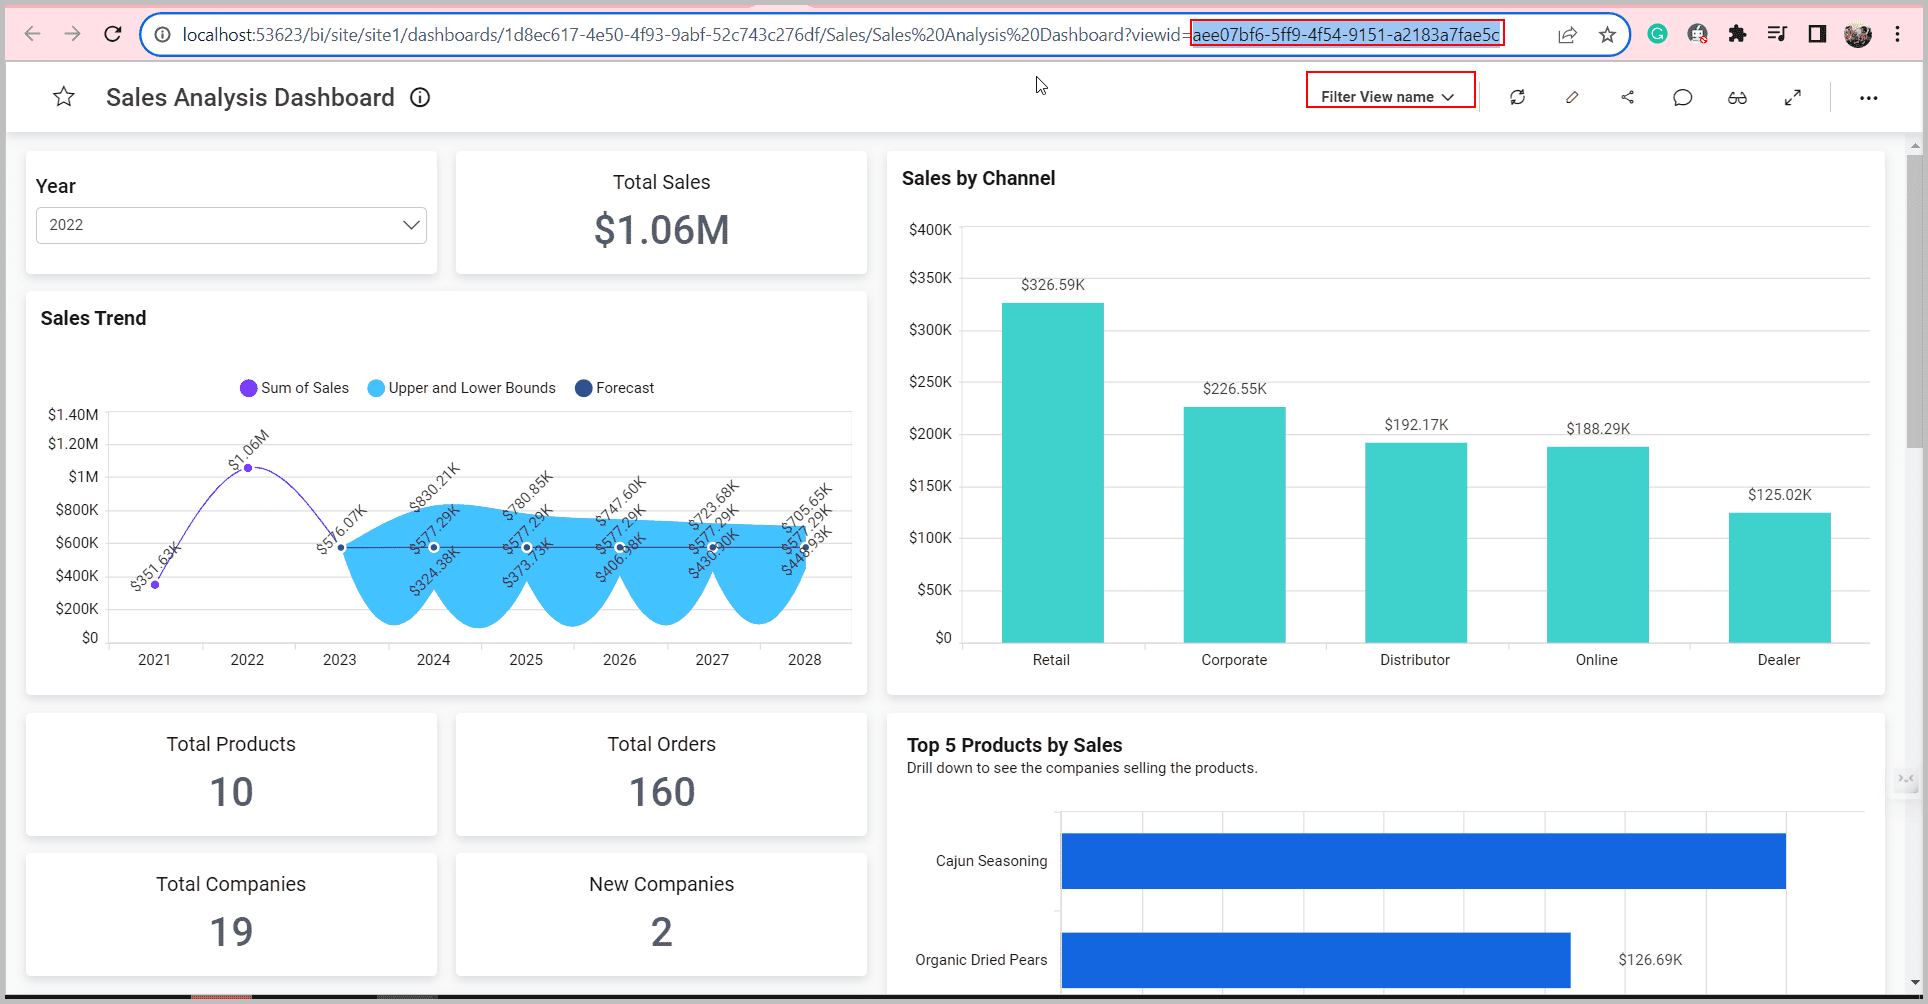
The unique ID of a Dashboard View to render the dashboard with filter view applied.
Default value : empty
Example
var dashboard = BoldBI.create({
     viewId:  "b64aebef-58ca-4033-b81a-39350c849b75"
});
dashboard.loadView();
viewName
string
The name of a Dashboard View to render the dashboard with filter view applied.
Default value : empty
Example
var dashboard = BoldBI.create({
     viewName : "view 1"
});
dashboard.loadView();
widgetList
Array
This member will assist in loading the specific widgets of the single dashboard with a single instance call.
Default value : empty
Example
<div id="dashboard"></div>
<div id="widget1" style="height:500px;width:500px"></div>
<div id="widget2" style="height:500px;width:500px"></div>
<div id="widget3" style="height:500px;width:500px"></div>
<script>
var dashboard = BoldBI.create({
      dashboardId: "5cb065f7-dabb-4b0c-9b45-c60a5730e963",
      embedContainerId: "dashboard",
      widgetList: [{widgetName: "Medal details by Country", containerId: "widget1" },
                  {widgetName: "Total Medals by Country", containerId: "widget2" },
                  {widgetName: "Country", containerId: "widget3" }],
     });
dashboard.loadMultipleWidgets();
</script>
NOTE: We have enhanced the performance of loading multiple widgets in the javascript embedding. Please note that support will work and take effect if the embed SDK Wrapper and Bold BI Server are on the same version effectively from v8.1.41
width
string
The width is an optional member of the API. You can define the width of the embedding module in either percentages or pixels, depending on your requirements. If you do not specify a width for the API, it will automatically take the dimensions of your embedding container. If no value is provided, it will inherit the width from the dimensions of the parent container of the embedding.
Example
var dashboard = BoldBI.create({
     width:"1200px", //The dashboard is now rendered with a width of 1200px.
});
dashboard.loadDashboard();
authorizationServer
headers
object
The authorizationServer.headers parameter, which is optional, is used to transmit any custom data or header values that need to be delivered to your embedding application’s AuthorizationServer. As a result, you may find this value in the headers of the Authorization Server API. Please refer to the Knowledge Base article.
Default value
Example
var dashboard = BoldBI.create({
     authorizationServer:{
          headers: {
               "Authorization": "Bearer eDIHDIJAdjakdnajdbaidhoasjasajnsJNININfsbfskdnskdnskdn"
          }
     }
});
dashboard.loadDashboard();
url
string
Any application that embeds a Bold BI dashboard and widget needs to authenticate with the Bold BI server. This authentication flow requires sending confidential information such as user email, group details, and embed signature to the Bold BI server. Therefore, you must implement this authentication flow in your server application and provide the URL for connecting to your server in the Bold BI embed instance.
This property holds the URL of the embedding application that will implement authorization. Learn more about the authorization server.
Default value : empty
Example
var dashboard = BoldBI.create({
     authorizationServer: {
          url:"https://serversample.com/embed-details/get",
     }
});
dashboard.loadDashboard();
autoRefreshSettings
The auto refresh feature allows you to configure the scheduled refreshing process of the dashboard. It is used to refresh the data based on the specified time.
enabled
boolean
Specifies whether to enable or disable the autoRefreshSettings option.
Default value
Example
var dashboard = BoldBI.create({
     autoRefreshSettings:{
          enabled: false,
     }
});
dashboard.loadDashboard();
autoRefreshSettings.hourlySchedule
hours
number
Specifies the hourly time interval for automatically refreshing data.
Default value
Example
var dashboard = BoldBI.create({
     autoRefreshSettings:{
          enabled: true,
          hourlySchedule: {
               hours: 1,
          }
     }
});
dashboard.loadDashboard();
minutes
number
Specifies the time interval, minute by minute, for automatically refreshing the data.
Default value
Example
var dashboard = BoldBI.create({
     autoRefreshSettings:{
          enabled: true,
          hourlySchedule: {
               minutes: 10,
          }
     }
});
dashboard.loadDashboard();
seconds
number
Specifies the time interval, second by second, for automatically refreshing the data.
Default value
Example
var dashboard = BoldBI.create({
     autoRefreshSettings:{
          enabled: true,
          hourlySchedule: {
               seconds: 30,
          }
     }
});
dashboard.loadDashboard();
customBrandSettings
hideHelpLink
boolean
The hideHelpLink option allows you to show or hide the “Know More” option in the scrollable dashboard feature within Dashboard Designer.
Default value
Example
var dashboard = BoldBI.create({
     customBrandSettings:{
          hideHelpLink: true
     }
});
dashboard.loadDesigner();
customDomain
string
The customDomain option allows you to define a link to your custom domain help documentation application instead of using our Bold BI help documentation link.
Default value : empty
Example
var dashboard = BoldBI.create({
     customBrandSettings:{
          customDomain: "https://yourdomain.com"
     }
});
dashboard.loadDesigner();
dashboardSettings
dashboardName
Single Tab Dashboard
Specifies whether or not to update the Dashboards name in the header section.
Default value : empty
Example
var dashboard = BoldBI.create({
     dashboardSettings: {
          dashboardName: "name",
     }
});
dashboard.loadDashboard();
Multi Tab Dashboard
Specifies the unique ID of the dashboard if it is present within the multi-tab dashboard and mentions the name of the dashboard in which it should be rendered.
Default value
Example
var dashboard = BoldBI.create({
     dashboardSettings: {
       dashboardName: [
        { dashboardId: "fb63ae99-83b6-4752-97b7-890182a3729f", dashboardName: "value 1" },
        { dashboardId: "77fd95ce-ec8b-4f68-817c-f41cabfabd3a", dashboardName: "value 2" }
       ]
     }
});
dashboard.loadDashboard();
enableFilterOverview
boolean
Specifies whether to show or hide the Filter Overview icon in the dashboard banner.
Default value
Example
var dashboard = BoldBI.create({
     dashboardSettings: {
          enableFilterOverview: true,
     }
});
dashboard.loadDashboard();
enableFullScreen
boolean
Specifies whether to show or hide the Full Screen icon in dashboard banner.
Default value
Example
var dashboard = BoldBI.create({
     dashboardSettings: {
          enableFullScreen: true,
     }
});
dashboard.loadDashboard();
enableTheme
boolean
Specifies whether to show or hide the Theme icon in the dashboard banner.
Default value
Example
var dashboard = BoldBI.create({
     dashboardSettings: {
          enableTheme: false,
     }
});
dashboard.loadDashboard();
fontFamily
string
The Fontfamily member allows you to customize the font of the Bold BI embedded modules such as the viewer, designer, data source, and pinboard embedding.
Default value : empty
NOTE: Before customizing the font for embedding, you need to upload the font file to the Bold BI Server. Please refer to the Font for further information on uploading the font family file. When embedding, use the name you provided for the font when uploading the font file to the server.
Example
var dashboard = BoldBI.create({
     dashboardSettings: {
          fontFamily : "Patrick-hand"
     }
});
dashboard.loadDashboard();
showDashboardParameter
boolean
Specifies whether to show or hide the Dashboard Parameter icon in dashboard banner.
Default value
Example
var dashboard = BoldBI.create({
     dashboardSettings: {
          showDashboardParameter: true,
     }
});
dashboard.loadDashboard();
showExport
boolean
Specifies whether to show or hide the Export icon in dashboard banner.
Default value
Example
var dashboard = BoldBI.create({
     dashboardSettings: {
          showExport: true,
     }
});
dashboard.loadDashboard();
showHeader
boolean
To enable or disable the header panel in the Dashboard Viewer.
Default value
Example
var dashboard = BoldBI.create({
     dashboardSettings: {
          showHeader: true,
     }
});
dashboard.loadDashboard();
showMetrics
boolean
Specifies whether to show or hide the Metrics option in the dashboard banner.
Default value
Example
var dashboard = BoldBI.create({
     dashboardSettings: {
          showMetrics: true,
     }
});
dashboard.loadDashboard();
showMoreOption
boolean
Specifies whether to show or hide the Option icon in dashboard banner.
Default value
Example
var dashboard = BoldBI.create({
     dashboardSettings: {
          showMoreOption: true,
     }
});
dashboard.loadDashboard();
showPreviewAs
boolean
Please indicate whether to display or hide the PreviewAs option in the designer preview.
Default value
Example
var dashboard = BoldBI.create({
     mode: BoldBI.Mode.Design,
     dashboardSettings: {
          showPreviewAs: true //By default, the previewAs button will be shown.
     }
});
dashboard.loadDesigner();
showRefresh
boolean
Specifies whether to show or hide the Refresh icon in dashboard banner.
Default value
Example
var dashboard = BoldBI.create({
     dashboardSettings: {
          showRefresh: true,
     }
});
dashboard.loadDashboard();
dashboardSettings.dataSourceConfig
hideDataSourceConfig
boolean
Please indicate whether you want to display or hide the Data source configuration button in the dashboard designer banner.
Default value
Example
var dashboard = BoldBI.create({
     mode: BoldBI.Mode.Design,
     dashboardSettings: {
          dataSourceConfig :{
            hideDataSourceConfig: false // By default, the datasource configuration is shown.
          }
     }
});
dashboard.loadDesigner();
hideSampleDataSources
boolean
Please specify whether you want to display or hide the Sample Datasources option under the datasource configuration in the dashboard designer banner.
Default value
Example
var dashboard = BoldBI.create({
     mode: BoldBI.Mode.Design,
     dashboardSettings: {
          dataSourceConfig :{
            hideSampleDataSources: false // By default, the sample datasource option is shown.
          }
     }
});
dashboard.loadDesigner();
hideDataSourceList
boolean
Specify whether to show or hide the Data source List dropdown configuration in the dashboard designer banner.
Default value
Example
var dashboard = BoldBI.create({
     mode: BoldBI.Mode.Design,
     dashboardSettings: {
          dataSourceConfig :{
            hideDataSourceList: false // By default, the datasource list dropdown is shown.
          }
     }
});
dashboard.loadDesigner();
hideExpression
boolean
Specify whether to show or hide the Hide Expression configuration button in the dashboard designer banner.
Default value
Example
var dashboard = BoldBI.create({
     mode: BoldBI.Mode.Design,
     dashboardSettings: {
          dataSourceConfig :{
            hideExpression: false // By default, the add expression button is shown.
          }
     }
});
dashboard.loadDesigner();
dashboardSettings.filterOverviewSettings
showSaveAsIcon
boolean
Please specify whether you want to display or conceal the Save As option in the filter overview of the dashboard banner.
Default value
Example
var dashboard = BoldBI.create({
     mode: BoldBI.Mode.View,
     dashboardSettings: {
          filterOverviewSettings :{
            showSaveAsIcon: true,// To enable save as option in filter overview
          }
     }
});
dashboard.loadDashboard();
showSaveIcon
boolean
Please indicate whether to display or hide the Save option in the filter overview section of the dashboard banner.
Default value
Example
var dashboard = BoldBI.create({
     mode: BoldBI.Mode.View,
     dashboardSettings: {
          filterOverviewSettings :{
            showSaveIcon: true,// To enable save option in filter overview
          }
     }
});
dashboard.loadDashboard();
showViewSavedFilterIcon
boolean
Please indicate whether you want to display or hide the View Saved Filter option in the filter overview on the dashboard banner. When the View Saved Filter option is clicked, it will trigger the onViewSavedFiltersClick event. From there, you can customize the views dialog and perform additional actions.
Default value
Example
var dashboard = BoldBI.create({
     mode: BoldBI.Mode.View,
     dashboardSettings: {
          filterOverviewSettings :{
            showViewSavedFilterIcon: true,// To enable view saved filters option in filter overview
          },
          onViewSavedFiltersClick: function(args) {
             // Retrieves the array of view information from 'args.viewInfos' and perform further actions.
             console.log(args.viewInfos); //The 'args.viewInfos' contains a list of views in the form of an array.
          },
     }
});
dashboard.loadDashboard();
dashboardSettings.filterOverviewSettings.viewId
string
By using this member API, you can embed the dashboard with views. For that, you need to pass the viewId value, viewName, and query string in the filterParameters.
To obtain the view ID of a specific view from the URL of the corresponding dashboard in its view.
For more details, Please refer to the Knowledge Base article to obtain the viewName and query string from the REST API.
Default value
Example
var dashboard = BoldBI.create({
     mode: BoldBI.Mode.View,
     dashboardSettings: {
          filterOverviewSettings :{
            viewId: '0732e6c9-f7d6-469a-85e0-a7a4b22dbb2a' // View ID
            viewName: 'Filter View' // View name
          }
     },
     filterParameters: 'filterQuery=[{"ucn":"Column1","cn":"Orderdate","rn":"ComboBox2","ir":false,"ims":false,"fi":"92884626db4ffba31a49504a4864e4","ipw":false,"dimfi":{"c":"Include","t":["2022"]}}]', //query string of the respective view
});
dashboard.loadDashboard();
dashboardSettings.filterOverviewSettings.viewName
string
By passing the value of viewName and the query string in the filterParameters, you can embed the dashboard with views.
For more details, please refer to the Knowledge Base article to retrieve the viewName and query string from the REST API.
Default value
Example
var dashboard = BoldBI.create({
     mode: BoldBI.Mode.View,
     dashboardSettings: {
          filterOverviewSettings :{
            viewName: 'Filter View' // View name
          }
     },
     filterParameters: 'filterQuery=[{"ucn":"Column1","cn":"Orderdate","rn":"ComboBox2","ir":false,"ims":false,"fi":"92884626db4ffba31a49504a4864e4","ipw":false,"dimfi":{"c":"Include","t":["2022"]}}]', //query string of the respective view
});
dashboard.loadDashboard();
dashboardSettings.viewDataSettings
enableColumnSelection
boolean
Please specify whether to show or hide the “Select Column” button in the view underlying data of the widget, which will be used by both the viewer and designer of the dashboard.
Default value
Example
var dashboard = BoldBI.create({
     mode: BoldBI.Mode.Design,
     dashboardSettings: {
          viewDataSettings :{
            enableColumnSelection: false,//Select column button will be hidden in the dashboard designer.
          }
     }
});
dashboard.loadDesigner();

var dashboard = BoldBI.create({
     dashboardSettings: {
          viewDataSettings :{
            enableColumnSelection: false,//Select column button will be hidden in the dashboard viewer.
          }
     }
});
dashboard.loadDashboard();
enableExporting
boolean
Please specify whether to show or hide the export option in the view underlying data of the widget, which will be used by both the viewer and the designer of the dashboard.
Default value
Example
var dashboard = BoldBI.create({
     mode: BoldBI.Mode.Design,
     dashboardSettings: {
          viewDataSettings :{
            enableExporting: false,//The Export option will be hidden in the dashboard designer.
          }
     }
});
dashboard.loadDesigner();

var dashboard = BoldBI.create({
     dashboardSettings: {
          viewDataSettings :{
            enableExporting: false,//The Export option will be hidden in the dashboard viewer.
          }
     }
});
dashboard.loadDashboard();
showAllColumns
boolean
To enable the display of all columns in the table in the View Underlying Data of the widget, which will be used by both the viewer and the designer of the dashboard.
Default value
Example
var dashboard = BoldBI.create({
     mode: BoldBI.Mode.Design,
     dashboardSettings: {
          viewDataSettings :{
            showAllColumns: true,//Column options are all checked in the dashboard designer.
          }
     }
});
dashboard.loadDesigner();

var dashboard = BoldBI.create({
     dashboardSettings: {
          viewDataSettings : {
            showAllColumns: true,//Column options are all checked in the dashboard viewer.
          }
     }
});
dashboard.loadDashboard();
dashboardSettings.widgetsPanel
existingDashboards
Array
The current dashboard widgets can be added to the existing panel tab in the designer settings.
Default value : empty
Example
var dashboard = BoldBI.create({
     mode: BoldBI.Mode.Design,
     dashboardSettings: {
          widgetsPanel :{
            existingDashboards: [], //Here you are able to pass the n number of dashboard ids.
          }
     }
});
dashboard.loadDesigner();
hideDefaultWidgets
boolean
Please indicate whether to display or hide the Default Widgets panel tab in the dashboard designer banner.
Default value
Example
var dashboard = BoldBI.create({
     mode: BoldBI.Mode.Design,
     dashboardSettings: {
          widgetsPanel :{
            hideDefaultWidgets: false // By default, the Default Widgets will be shown.
          }
     }
});
dashboard.loadDesigner();
hideExistingWidgets
boolean
Please indicate whether you would like to display or conceal the Existing Widgets panel tab on the dashboard designer banner.
Default value
Example
var dashboard = BoldBI.create({
     mode: BoldBI.Mode.Design,
     dashboardSettings: {
          widgetsPanel :{
            hideExistingWidgets: false // By default, the Existing Widgets will be shown.
          }
     }
});
dashboard.loadDesigner();
datasource
datasources
array
This property is used for adding multiple data sources to the designer page. You can customize the properties of the Datasource using the following options.
canEdit- specifies whether to enable or disable the edit icon in the Datasource.canDelete- specifies whether to enable or disable the delete icon in the Datasource.
Example
var dashboard = BoldBI.create({
     datasources: [
          {"id": "348e414b-c8c6-4542-839a-2e12934fe64f", "canEdit": true, "canDelete": false},
          {"id": "d9a28bba-e6dd-46c9-89d7-810ebb4796b3", "canEdit": false, "canDelete": true}
     ]
});
dashboard.loadDesigner();
designCanvasSettings
margin
integer
Customize the margins of the dashboard using the corresponding integer values.
Default value
Example
var dashboard = BoldBI.create({
     designCanvasSettings: {
          margin: 30,
     }
});
dashboard.loadDashboard();
dynamicConnection
The dashboard server provides a dynamic connection string feature for fetching the data used to render the dashboard.
identity
string
This property holds the values that will be passed to the API in the dynamic connection string feature. This allows the user to use this identity in their API for validation and providing the required connection string.
Default value : empty
Example
var dashboard = BoldBI.create({
     dynamicConnection: {
          isEnabled: true,
          identity: "",
     }
});
dashboard.loadDashboard();
isEnabled
boolean
Specifies whether to enable or disable the dynamic connection string feature.
Default value
Example
var dashboard = BoldBI.create({
     dynamicConnection: {
          isEnabled: false,
     }
});
dashboard.loadDashboard();
embedAiAssistant
enableAiAssistant
boolean
The AI Assistant enables users to generate widgets and modify their properties using natural language queries, making data visualization more intuitive and accessible. It enhances widget creation and customization by leveraging advanced AI models. This feature is available in both Cloud and Enterprise editions of the dashboard application and is supported for Dashboard Viewer, Dashboard Designer, Single Widget, and Pinboard embeddings. Please refer here for more details.
Default value:
- false
Note: Please ensure the SDK and Bold BI server versions match.
Version info:
- Until 9.1.73:
enableAiAssistantcould be used directly inside thecreatemethod. - From 10.1.18:
enableAiAssistantmust be set insideembedAiAssistant. - From 12.1 onwards: use
enabledinstead ofenableAiAssistant.
Example (Before 12.1):
var dashboard = BoldBI.create({
    embedAiAssistant: {
        enableAiAssistant: true
    }
});
dashboard.loadDashboard();
Note: Please use the SDK and Bold BI server from the same version. Starting from version 12.1, the AI Assistant settings are restructured. Use the
enabledobjects as shown below.
Example (From 12.1 onwards):
var dashboard = BoldBI.create({
    embedAiAssistant: {
        enabled: true,
         summary: {
          }
    }
});
dashboard.loadDashboard();
Note: To enable the AI Assistant, it is necessary to provide a summary block, as this is a known issue in version 12.1.5.
name
boolean
Using the API to customize the title of AI assistant as we desired. To use this, it is mandatory to use the enabled member API.
Default value
Example
var dashboard = BoldBI.create({
     embedAiAssistant: {
          enabled: true,
          name: "Embedded AI",
          summary: {
          }
     }
});
dashboard.loadDashboard();
Note: To customize the title of AI Assistant, it is necessary to provide a summary block, as this is a known issue in version 12.1.5.
enableAiSummary
boolean
This specifies whether to show or hide the dashboard and widget summary option. To enable this, it is mandatory to use the enabled member API.
Note:
enableAiSummaryis supported only in versions prior to 12.1. From version 12.1 onwards, useembedAiAssistant.summary.enabledinstead.
Default value
Example (Before Version 12.1)
var dashboard = BoldBI.create({
     embedAiAssistant: {
          enableAiAssistant: true,
          enableAiSummary: true
     }
});
dashboard.loadDashboard();
Note: Please use the SDK and Bold BI server from the same version. Starting from version 12.1, the AI Assistant settings are restructured. Use the
enabledandsummaryobjects as shown below.
var dashboard = BoldBI.create({
     embedAiAssistant: {
          enabled: true,
          summary: {
               enabled: true
          }
     }
});
dashboard.loadDashboard();
enableDashboardSummary
boolean
This specifies whether to show or hide the AI Dashboard Summary option in the dashboard banner. To enable this, it is mandatory to use both the enableaiassistant and enableAiSummary member APIs.
Note:
enabledashboardsummaryis supported only in versions prior to 12.1. From version 12.1 onwards, useembedAiAssistant.summary.includeDashboardSummaryinstead.
Default value
Example
var dashboard = BoldBI.create({
     embedAiAssistant: {
          enableAiAssistant: true,
          enableAiSummary: true,
          enableDashboardSummary: true
     }
});
dashboard.loadDashboard();
Note: Please use the SDK and Bold BI server from the same version. Starting from version 12.1, the AI Assistant settings are restructured. Use the
includeDashboardSummaryandsummaryobjects as shown below.
var dashboard = BoldBI.create({
     embedAiAssistant: {
          enabled: true,
          summary: {
               enabled: true,
               includeDashboardSummary: true
          }
     }
});
dashboard.loadDashboard();
enableWidgetSummary
boolean
This specifies whether to show or hide the AI Widget Summary option in the widgets. To enable this, it is mandatory to use both the enableaiassistant and enableAiSummary member APIs.
Note:
enableWidgetSummaryis supported only in versions prior to 12.1. From version 12.1 onwards, useembedAiAssistant.summary.includeWidgetSummaryinstead.
Default value
Example
var dashboard = BoldBI.create({
     embedAiAssistant: {
          enableAiAssistant: true,
          enableAiSummary: true,
          enableWidgetSummary: true
     }
});
dashboard.loadDashboard();
Note: Please use the SDK and Bold BI server from the same version. Starting from version 12.1, the AI Assistant settings are restructured. Use the
includeWidgetSummaryandsummaryobjects as shown below.
var dashboard = BoldBI.create({
     embedAiAssistant: {
          enabled: true,
          summary: {
               enabled: true,
               includeWidgetSummary: true
          }
     }
});
dashboard.loadDashboard();
hideAiDataUsage
boolean
This specifies whether to show or hide the AI Data Usage icon in the AI Assistant window. To enable this, it is mandatory to use the enableaiassistant member API.
Default value
Example
var dashboard = BoldBI.create({
     embedAiAssistant: {
          enableAiAssistant: true,
          //enabled: true,  //Please use this property from v12.1
          hideAiDataUsage: true
     }
});
dashboard.loadDashboard();
exportSettings
showCSV
boolean
This specifies whether to show or hide the CSV export option.
Default value
Example
var dashboard = BoldBI.create({
     exportSettings: {
          showCSV: true,
     }
});
dashboard.loadDashboard();
showExcel
boolean
Specifies whether to show or hide the Excel export option.
Default value
Example
var dashboard = BoldBI.create({
     exportSettings: {
          showExcel: true,
     }
});
dashboard.loadDashboard();
showImage
boolean
Specifies whether to show or hide the Image export option.
Default value
Example
var dashboard = BoldBI.create({
     exportSettings: {
          showImage: true,
     }
});
dashboard.loadDashboard();
showPDF
boolean
Specifies whether to show or hide the PDF export option.
Default value
Example
var dashboard = BoldBI.create({
     exportSettings: {
          showPDF: true,
     }
});
dashboard.loadDashboard();
languageSettings
hideLanguageDropdown
boolean
This property will display or hide the dashboard localization dropdown in the dashboard banner.
Default value
Before setting the dashboard localization at the embedding level, you should configure the Localize Dashboard option in the dashboard designer of your Bold BI Server. By default, the dashboard localization dropdown is visible in the dashboard banner. To hide it, use the hideLanguageDropdown API at the embedding level.
Example
var dashboard = BoldBI.create({
     languageSettings:{
          hideLanguageDropdown: true,
     }
});
dashboard.loadDashboard();
languageCode
string
This property contains the values that will be passed to the dashboard to change its localization during the initial rendering.
Default value
Before setting the dashboard localization at the embedding level, you should configure the Localize Dashboard option in the dashboard designer of your Bold BI Server. After doing so, you will be able to change the language using the languageCode API at the embedding level.
Example
var dashboard = BoldBI.create({
     languageSettings:{
          languageCode: "fr-FR",
     }
});
dashboard.loadDashboard();
localeSettings
The locale allows you to change the localization of the dashboard. It is used to modify the data based on the specified localization.
appLocale
string
This property holds the values that will be passed to the dashboard in order to change the language of the dashboard. This can also be done in the dashboard designer, data source, or widget.
Default value
Before setting the language of the dashboard at the embedding level, you should have or generate the respective language localization file in the installed location of your Bold BI Server. Please refer here to generate a new locale file. Then, you will be able to change the language by using the appLocale API at the embedding level.
Example
Note To set the fr-FR language in the embedding, I have generated the respective locale file in the installed location of the Bold BI Server.
var dashboard = BoldBI.create({
     localeSettings:{
          appLocale: "fr-FR",
     }
});
dashboard.loadDashboard();
culture
string
This property holds the values that will be passed to the dashboard in order to change the dashboard’s culture.
Default value
Example
var dashboard = BoldBI.create({
     localeSettings:{
          culture: "en-US",
     }
});
dashboard.loadDashboard();
Set a Culture for the Current User in Embedding
You can set the culture for the current user using the API in embedding.
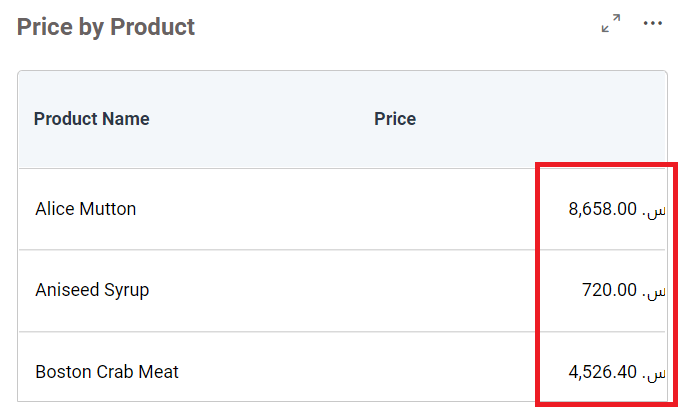
For example, if you configure the widget to display the currency value, it will be shown in the default Auto (English(en-US)) format, as shown in the following image.
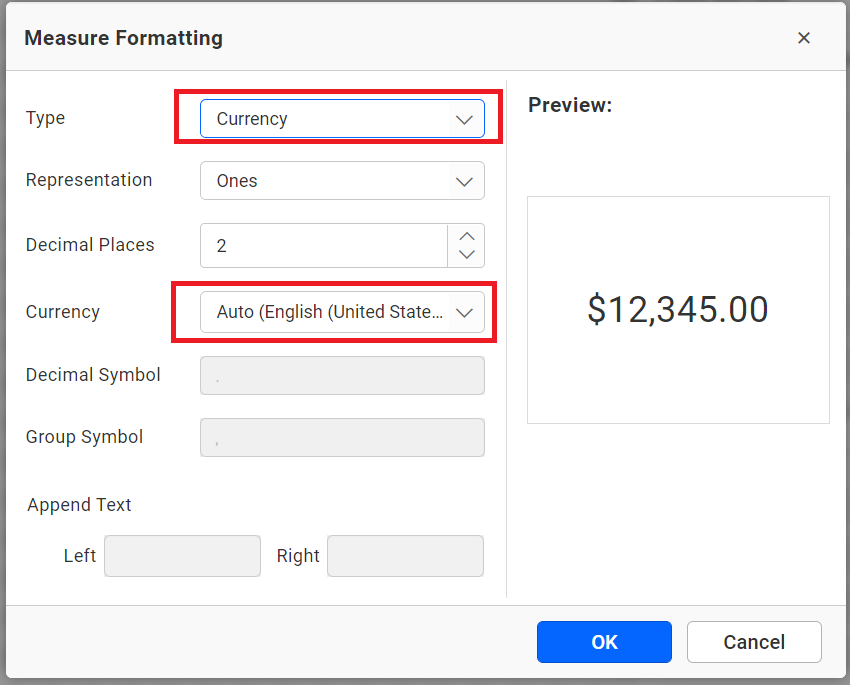
The values in the widget will be rendered as follows.
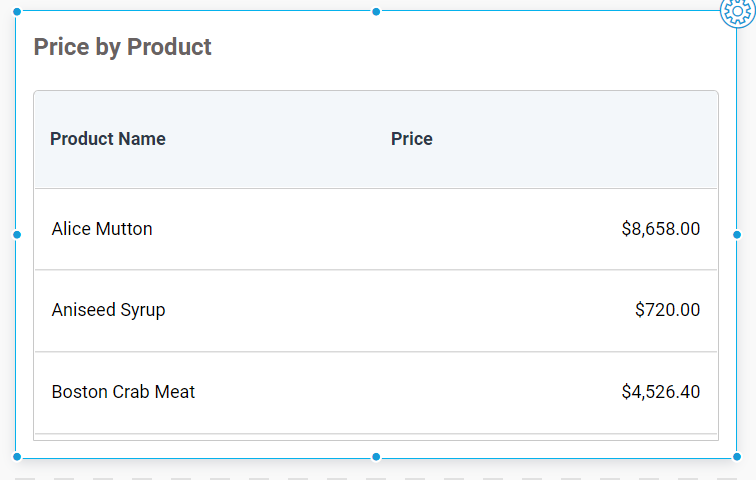
You can embed the Bold BI dashboards in your web page by following the steps provided in this guide on Embedding In Your Application.
After embedding the dashboard, you can change the culture settings on the embedded dashboard instance to achieve the desired currency format by passing it through the highlighted API provided.
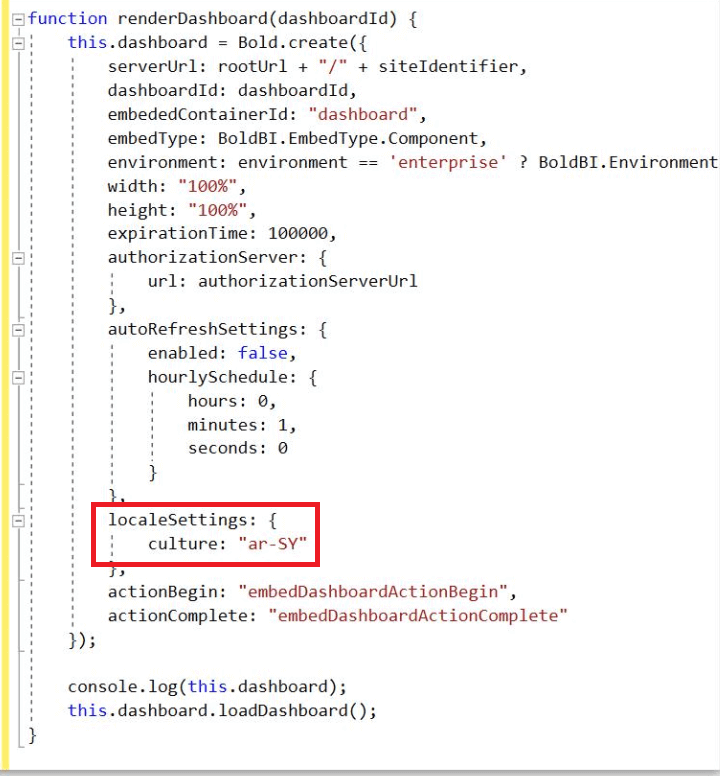
After this, the values in the widget will be displayed as follows within your application.
pinboardSettings
enablePinboardHeader
boolean
Please enable or disable the header panel on the pinboard.
Default value
Example
var dashboard = BoldBI.create({
     pinboardSettings: {
          enablePinboardHeader: true,
     }
});
dashboard.loadPinboard();
enableUnpinWidget
boolean
Enable or disable the Unpin option on the Pinboard.
Default value
Example
var dashboard = BoldBI.create({
     pinboardSettings: {
          enableUnpinWidget: true,
     }
});
dashboard.loadPinboard();
preConfiguredWidgets
Predefined or preconfigured widgets are a list of widgets that appear under the Default Widget Panel when initializing the dashboard designer itself. To do this, you need to create a dashboard called a template dashboard and configure the widgets that will be considered as predefined widgets for your designer.
categoryName
string
The name of the category where the widget to be added in designer.
Default value : empty
Example
var dashboard = BoldBI.create({
     preConfiguredWidgets: {
          categoryName: "",
     }
});
dashboard.loadDesigner();
NOTE:
- If the
categoryNamealready exists, the predefined widgets have been added to that category.- If the
categoryNamedoes not exist in the panel, the widgets are added by creating a new category with the given name.- Otherwise, the widgets were added to the
Miscellaneouscategory by default.
preConfiguredWidgets.dashboardId
string
The preconfigured widgets will be listed from the mentioned dashboard ID within the embedded dashboard designer in your application.
Default value : empty
Example
var dashboard = BoldBI.create({
     preConfiguredWidgets: {
          dashboardId: "",
     }
});
dashboard.loadDesigner();
widgetContainerSettings
boxShadow
string
Customize the box shadow of the widgets.
Default value
Example
var dashboard = BoldBI.create({
     widgetContainerSettings: {
          boxShadow: "10px 10px lightblue",
     }
});
dashboard.loadDashboard();
widgetContainerSettings.margin
integer
Customize the margins of the widget with the corresponding integer values.
NOTE: It is not necessary to specify the px suffix. it supports only integer values.
Default value
Example
var dashboard = BoldBI.create({
     widgetContainerSettings: {
          margin: 20,
     }
});
dashboard.loadDashboard();
widgetSettings
widgetSettings.showExport
boolean
Specifies whether to show or hide the Export icon in widget banner.
Default value
Example
var dashboard = BoldBI.create({
     widgetSettings: {
          showExport: true,
     }
});
dashboard.loadDashboard();
showFilter
boolean
Specifies whether to show or hide the Clear Filter icon in widget banner.
Default value
Example
var dashboard = BoldBI.create({
     widgetSettings: {
          showFilter: true,
     }
});
dashboard.loadDashboard();
showMaximize
boolean
Specifies whether to show or hide the Maximize icon in widget banner.
Default value
Example
var dashboard = BoldBI.create({
     widgetSettings: {
          showMaximize: true,
     }
});
dashboard.loadDashboard();
widgetSettings.showMoreOption
boolean
Specifies whether to show or hide the Option icon in widget banner.
Default value
Example
var dashboard = BoldBI.create({
     widgetSettings: {
          showMoreOption: true,
     }
});
dashboard.loadDashboard();- dashboardId
- dashboardPath
- dashboardIds
- dashboardPaths
- datasourceId
- datasourceName
- disableAutoRecover
- embedContainerId
- embedType
- embedToken
- environment
- expirationTime
- filterParameters
- height
- hideErrorMessage
- isBingMapRequired
- mode
- nonce
- pinboardName
- restrictMobileView
- serverUrl
- token
- viewId
- viewName
- widgetList
- width
- authorizationServer
- headers
- url
- autoRefreshSettings
- enabled
- autoRefreshSettingshourlySchedule
- hours
- minutes
- seconds
- customBrandSettings
- hideHelpLink
- customDomain
- dashboardSettings
- dashboardName
- enableFilterOverview
- enableFullScreen
- enableTheme
- fontFamily
- showDashboardParameter
- showExport
- showHeader
- showMetrics
- showMoreOption
- showPreviewAs
- showRefresh
- dashboardSettingsdataSourceConfig
- hideDataSourceConfig
- hideSampleDataSources
- hideDataSourceList
- hideExpression
- dashboardSettingsfilterOverviewSettings
- showSaveAsIcon
- showSaveIcon
- showViewSavedFilterIcon
- dashboardSettingsfilterOverviewSettingsviewId
- dashboardSettingsfilterOverviewSettingsviewName
- dashboardSettingsviewDataSettings
- enableColumnSelection
- enableExporting
- showAllColumns
- dashboardSettingswidgetsPanel
- existingDashboards
- hideDefaultWidgets
- hideExistingWidgets
- datasource
- datasources
- designCanvasSettings
- margin
- dynamicConnection
- identity
- isEnabled
- embedAiAssistant
- enableAiAssistant
- name
- enableAiSummary
- enableDashboardSummary
- enableWidgetSummary
- hideAiDataUsage
- exportSettings
- showCSV
- showExcel
- showImage
- showPDF
- languageSettings
- hideLanguageDropdown
- languageCode
- localeSettings
- appLocale
- culture
- Set a Culture for the Current User in Embedding
- pinboardSettings
- enablePinboardHeader
- enableUnpinWidget
- preConfiguredWidgets
- categoryName
- preConfiguredWidgetsdashboardId
- widgetContainerSettings
- boxShadow
- widgetContainerSettingsmargin
- widgetSettings
- widgetSettingsshowExport
- showFilter
- showMaximize
- widgetSettingsshowMoreOption
- dashboardId
- dashboardPath
- dashboardIds
- dashboardPaths
- datasourceId
- datasourceName
- disableAutoRecover
- embedContainerId
- embedType
- embedToken
- environment
- expirationTime
- filterParameters
- height
- hideErrorMessage
- isBingMapRequired
- mode
- nonce
- pinboardName
- restrictMobileView
- serverUrl
- token
- viewId
- viewName
- widgetList
- width
- authorizationServer
- headers
- url
- autoRefreshSettings
- enabled
- autoRefreshSettingshourlySchedule
- hours
- minutes
- seconds
- customBrandSettings
- hideHelpLink
- customDomain
- dashboardSettings
- dashboardName
- enableFilterOverview
- enableFullScreen
- enableTheme
- fontFamily
- showDashboardParameter
- showExport
- showHeader
- showMetrics
- showMoreOption
- showPreviewAs
- showRefresh
- dashboardSettingsdataSourceConfig
- hideDataSourceConfig
- hideSampleDataSources
- hideDataSourceList
- hideExpression
- dashboardSettingsfilterOverviewSettings
- showSaveAsIcon
- showSaveIcon
- showViewSavedFilterIcon
- dashboardSettingsfilterOverviewSettingsviewId
- dashboardSettingsfilterOverviewSettingsviewName
- dashboardSettingsviewDataSettings
- enableColumnSelection
- enableExporting
- showAllColumns
- dashboardSettingswidgetsPanel
- existingDashboards
- hideDefaultWidgets
- hideExistingWidgets
- datasource
- datasources
- designCanvasSettings
- margin
- dynamicConnection
- identity
- isEnabled
- embedAiAssistant
- enableAiAssistant
- name
- enableAiSummary
- enableDashboardSummary
- enableWidgetSummary
- hideAiDataUsage
- exportSettings
- showCSV
- showExcel
- showImage
- showPDF
- languageSettings
- hideLanguageDropdown
- languageCode
- localeSettings
- appLocale
- culture
- Set a Culture for the Current User in Embedding
- pinboardSettings
- enablePinboardHeader
- enableUnpinWidget
- preConfiguredWidgets
- categoryName
- preConfiguredWidgetsdashboardId
- widgetContainerSettings
- boxShadow
- widgetContainerSettingsmargin
- widgetSettings
- widgetSettingsshowExport
- showFilter
- showMaximize
- widgetSettingsshowMoreOption