Connecting Bold BI to Microsoft SQL Server Data Source
The Bold BI designer allows you to connect with several SQL data sources to visualize and analyze the data using interactive dashboards.
Supported Server Versions: Microsoft SQL Server (2012, 2014, 2016, 2017, and 2019)
NOTE: If you are hosting your database on a Windows platform, there are no restrictions. However, if hosted on any other platform, only SQL Server/Express 2016 or above will be supported.
Modes
There are two types of modes to create connection with SQL data source using the Bold BI designer:
- Live
- Extract
Live
In live mode, the Bold BI designer execute the query directly into the database server and fetches the result to visualize data in the dashboard widgets at real time.
Extract
In extract mode, the Bold BI designer extract data and store it in Azure SQL database, which Bold BI maintains as extracting data from REST data sources. The SQL query will execute in intermediate database instead of executing in actual database server to fetch data. Currently, Bold BI designer extracts 50000 record initially and other records will be extracted in next iteration based on the Refresh Settings.
How to create Microsoft SQL Server data source
To configure the Microsoft SQL Server data source, follow these steps:
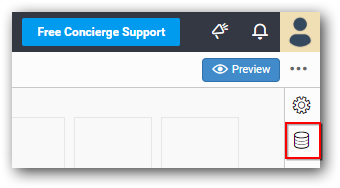
- Click the Data Source button in the configuration panel to add a new data connection.
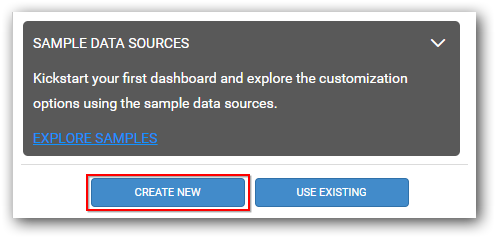
- Click CREATE NEW to launch a new connection panel.
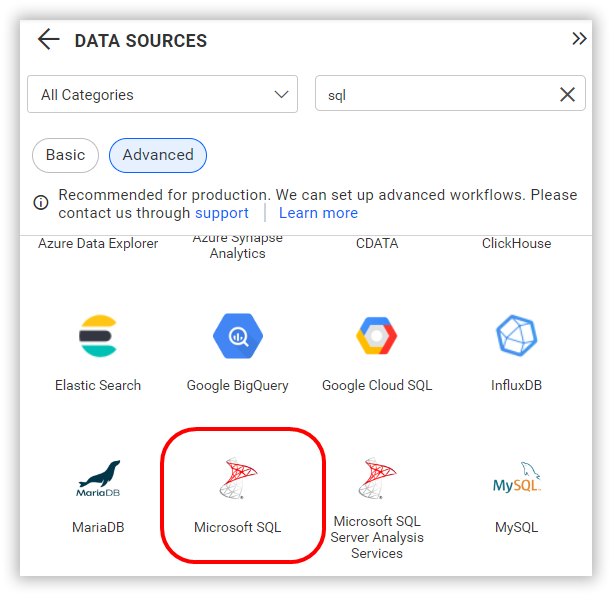
- Click the Microsoft SQL connection button in the connection panel.
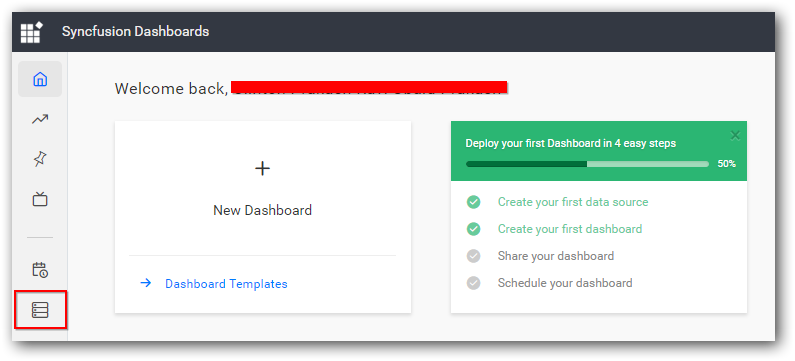
NOTE: You can also create a data source from the dashboard server page by clicking the Data Sources menu from left menu panel and Create Data Source from the data sources page.
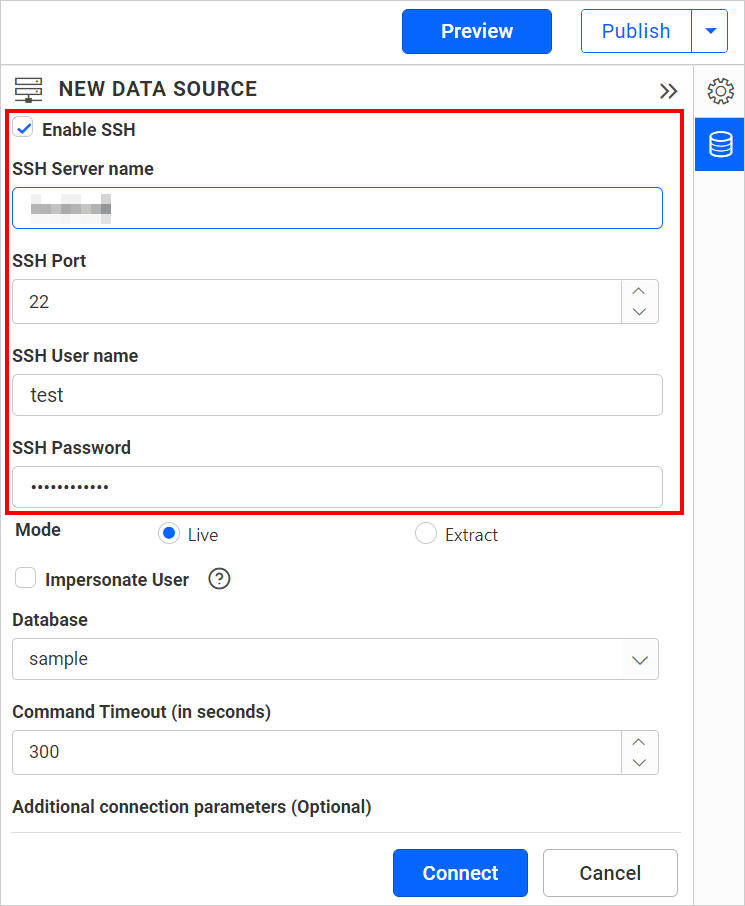
NOTE: To connect data source with SSH, enable the SSH check box in the NEW DATA SOURCE configuration panel and enter the required credentials.
Create Microsoft SQL Server data source in live mode
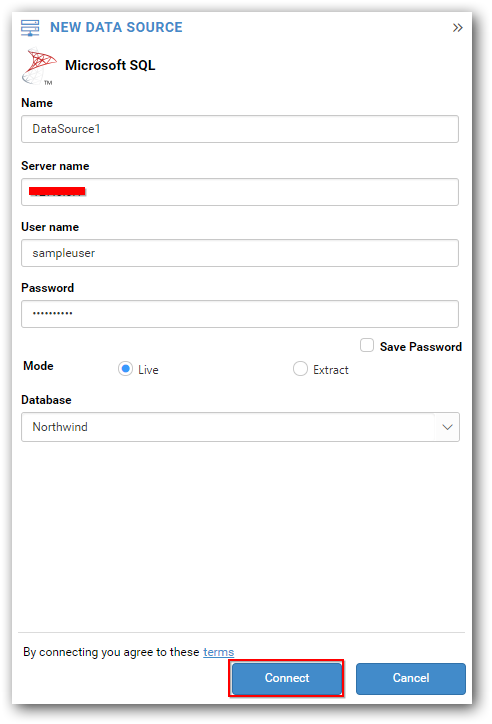
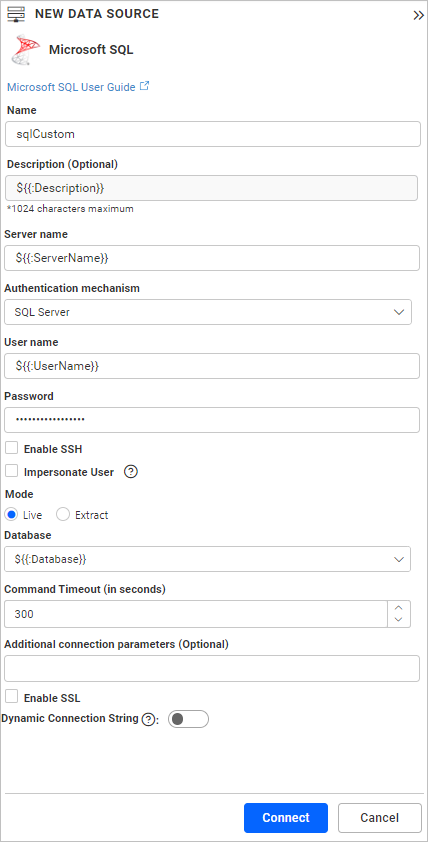
To connect with the SQL server database in live mode, follow these steps:
-
Set the server name in which the Microsoft SQL server runs.
-
Enter the user name and password to connect to the Microsoft SQL server.
-
Choose the Live mode radio button to establish a live mode connection with Microsoft SQL server. Refer Live mode to learn more.
-
Select the database and click Connect to connect the Bold BI designer with Microsoft SQL server database.
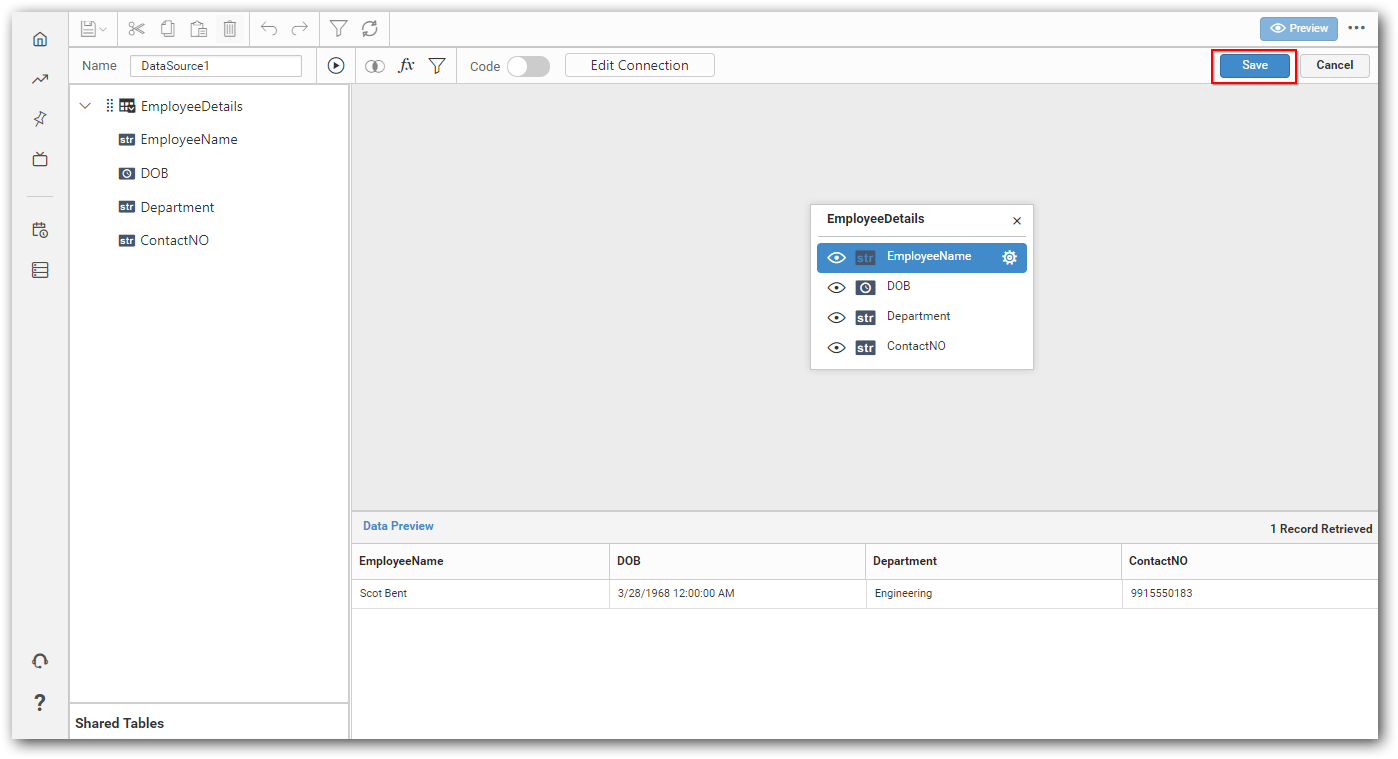
- Drag and drop the table from the table schema in the data design view page.
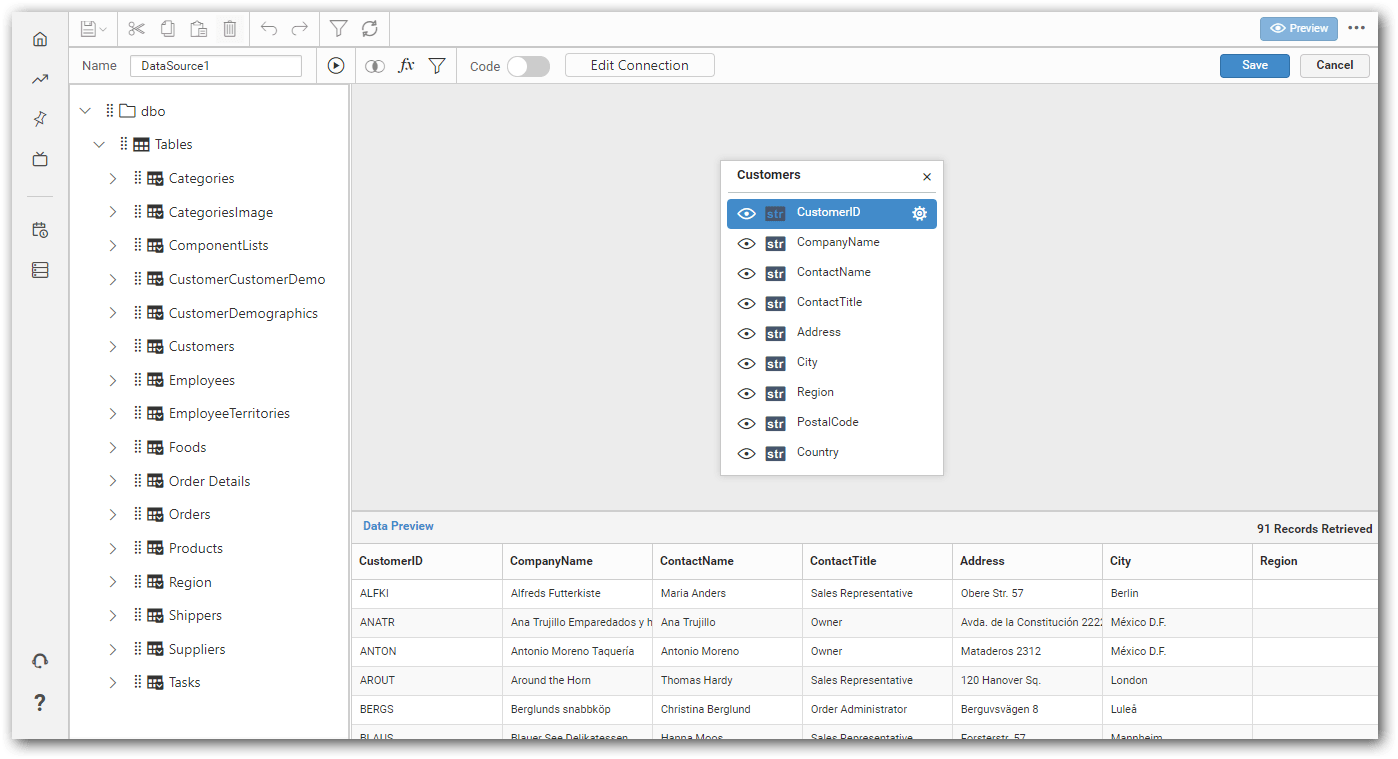
- Click Save to save the data source with a relevant name to proceed with designing dashboard.
Create Microsoft SQL Server data source in extract mode
To Connect to Bold ETL from sql server, switch to extract mode. Refer Bold ETL
- switch to Extract mode, Redirect dialog will pop up.
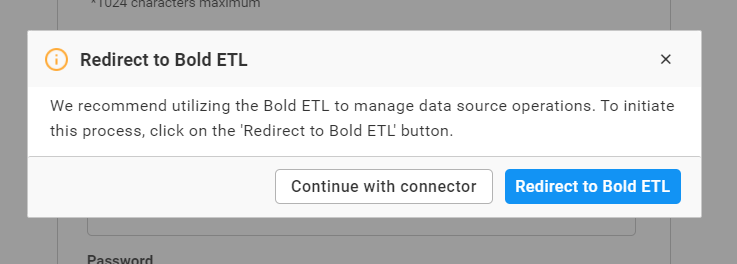
- Click on Redirect to Bold ETL button to redirect to Bold ETL. Or
- To continue with Bold BI, click on ‘Continue with connector.
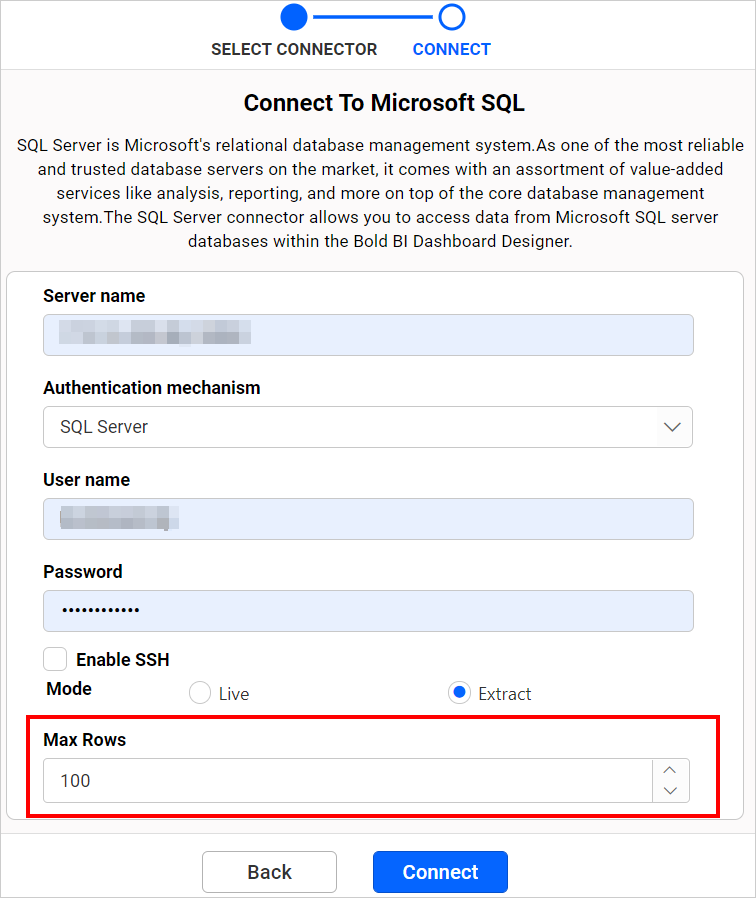
To connect the SQL server database in extract mode, follow these steps:
-
Set the server name in which the Microsoft SQL server runs.
-
Enter the user name and password to connect to the Microsoft SQL server.
-
Choose the Extract mode radio button to enable extract mode for creating data source. Refer Extract mode to learn more.
NOTE: Initially, data will be extracted based on the Max Rows selected in order to proceed with data model creation. The remaining records (there is no limit) will be extracted during the next refresh.
-
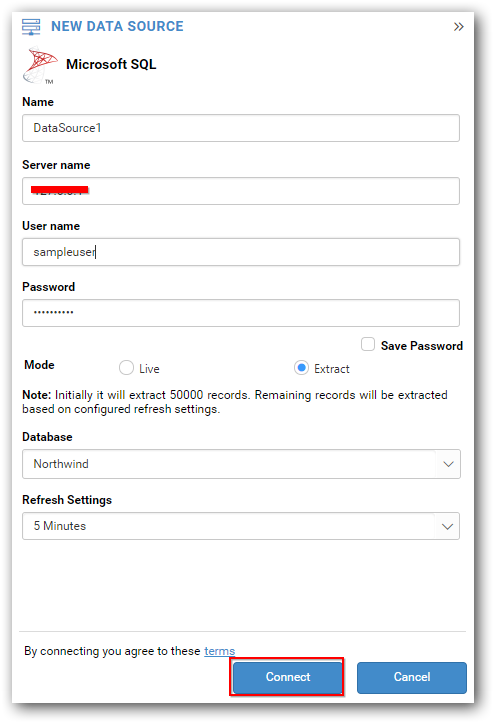
Select the database name from dropdown text box from which the tables to be extracted.
-
Choose a relevant time interval from Refresh Settings dropdown menu for refreshing the data source periodically. Refer Refresh Settings to learn more.
- Click Connect Extract Data dialog opens. This dialog has two modes of connection either via Table or Custom query. Under custom query option, write the required query and click Connect.
Under Table option, this dialog displays list of tables and views in treeview. Select the required table(s) or view(s) from treeview to use in the designer.
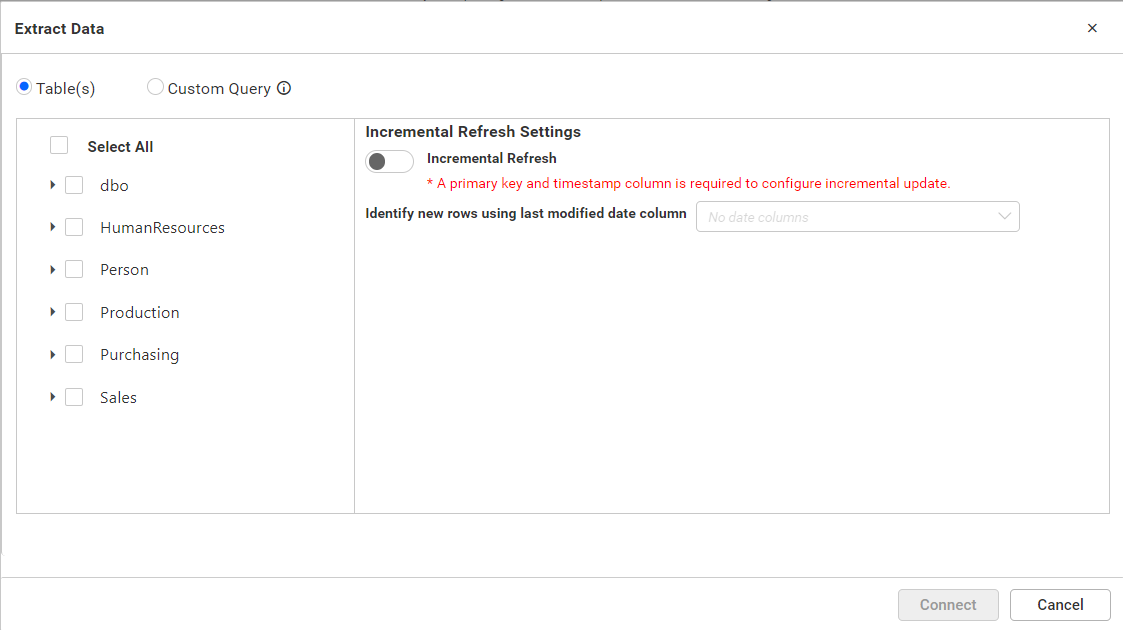
-
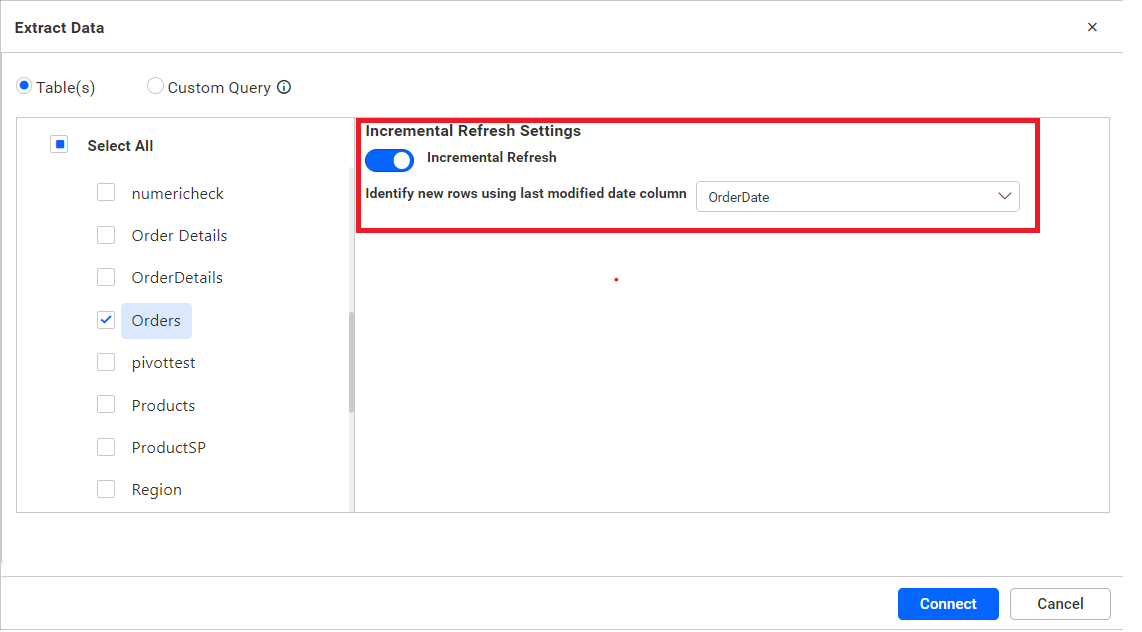
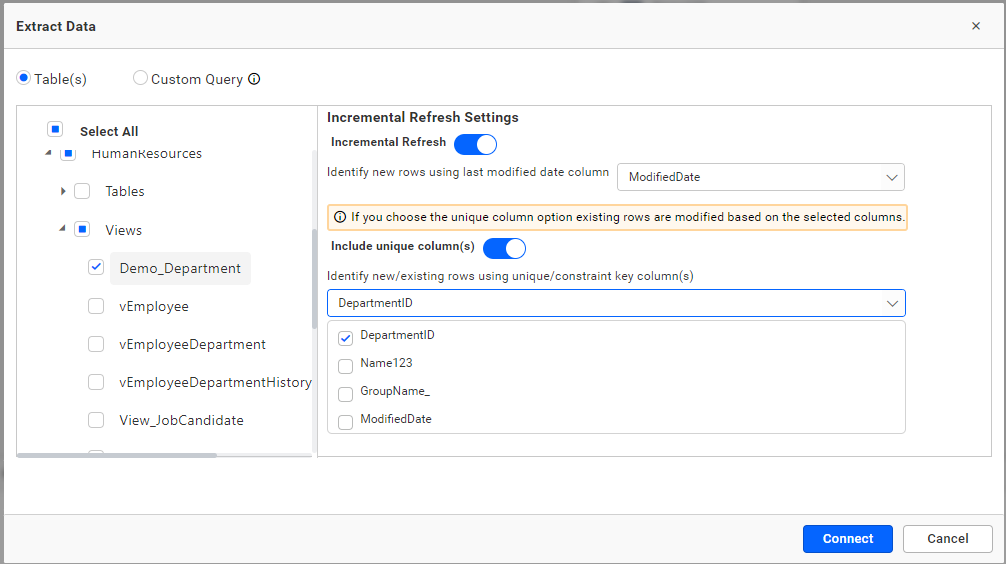
The incremental refresh settings configuration pane is used to configure the selected table to perform Full Load or Incremental Update based on refresh time interval configured in Step 5.
-
To perform Full Load refresh, off the Incremental Refresh toggle button for selected table/view.
-
Incremental Update can be performed in both tables and views.
-
To perform Incremental Update refresh, on the Incremental Refresh toggle button and select the last modified time column (represent the last modified time of the record, which is used to fetch the record modified recently) from the list of time stamp column loaded in dropdown box for selected table.
- The table must have a primary key column and date column to configure the incremental refresh option.
- The Views must have a date column to configure the incremental refresh option and unique column(s) is optional which is used to update the modified records.
NOTE: The Incremental Refresh toggle button is enabled only when the selected table contains time stamp column. If it is not enabled, the Bold BI designer will do Full Load refresh by default.
-
-
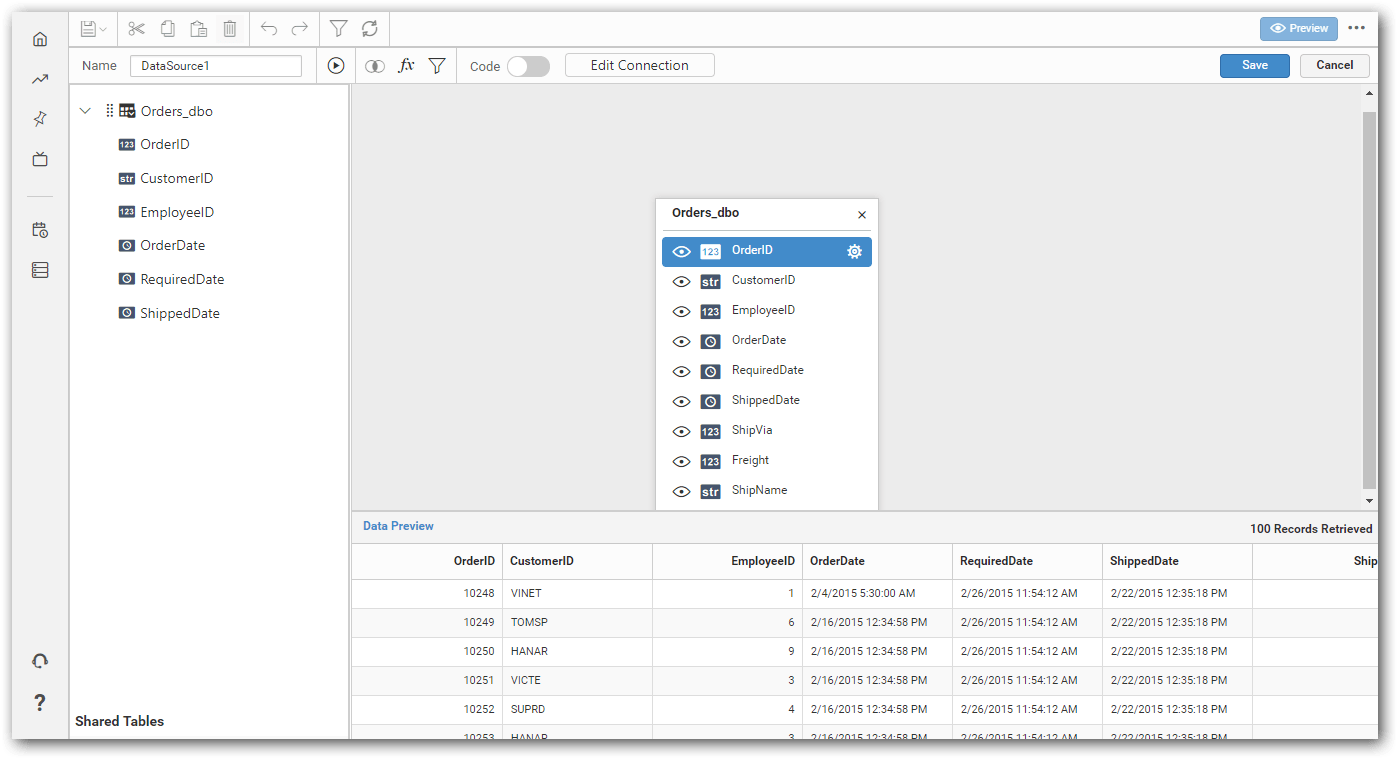
Click Connect to extract the selected tables and get into the data design view page.
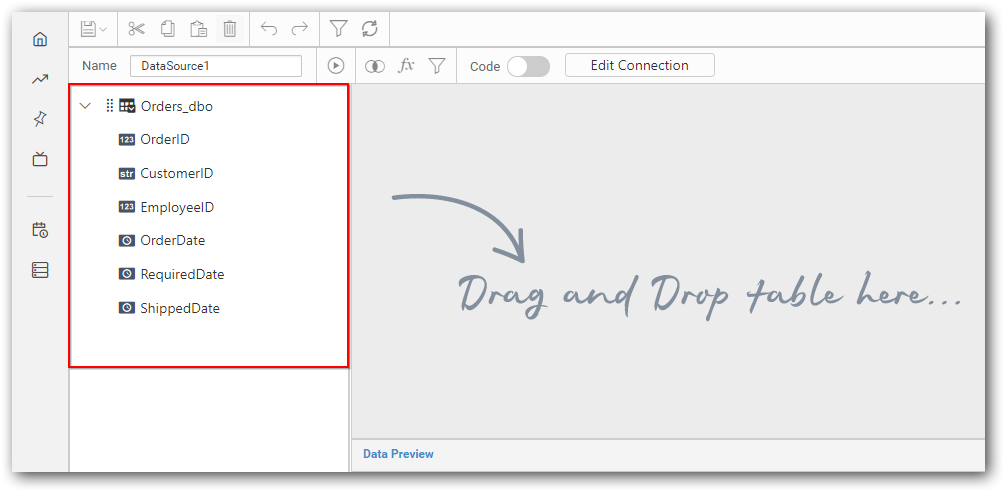
> **NOTE:** The extracted table will be stored in the intermediate database in name format `<tableName>_<schemaName>`. For example, in the previous step, the table **Orders** are extracted from schema **dbo** hence, the table name was stored as `Orders_dbo` in intermediate database.- Drag and drop the table from the left panel of data design page.
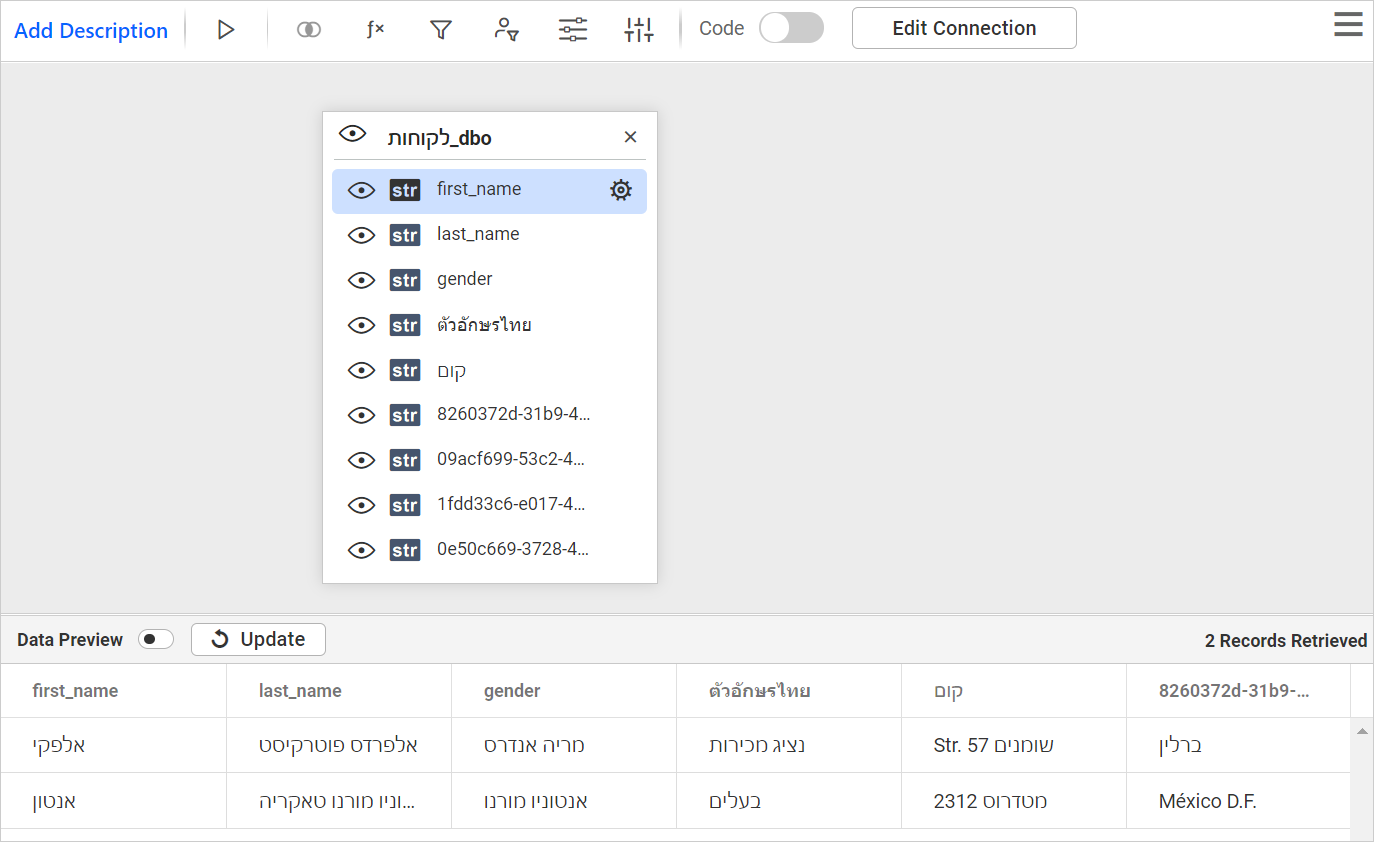
> **NOTE:** MS SQL Server data source supports all uni-code characters and other languages tables in Bold BI v4.2
- Click Save to save the data source with a relevant name.
View table schema support
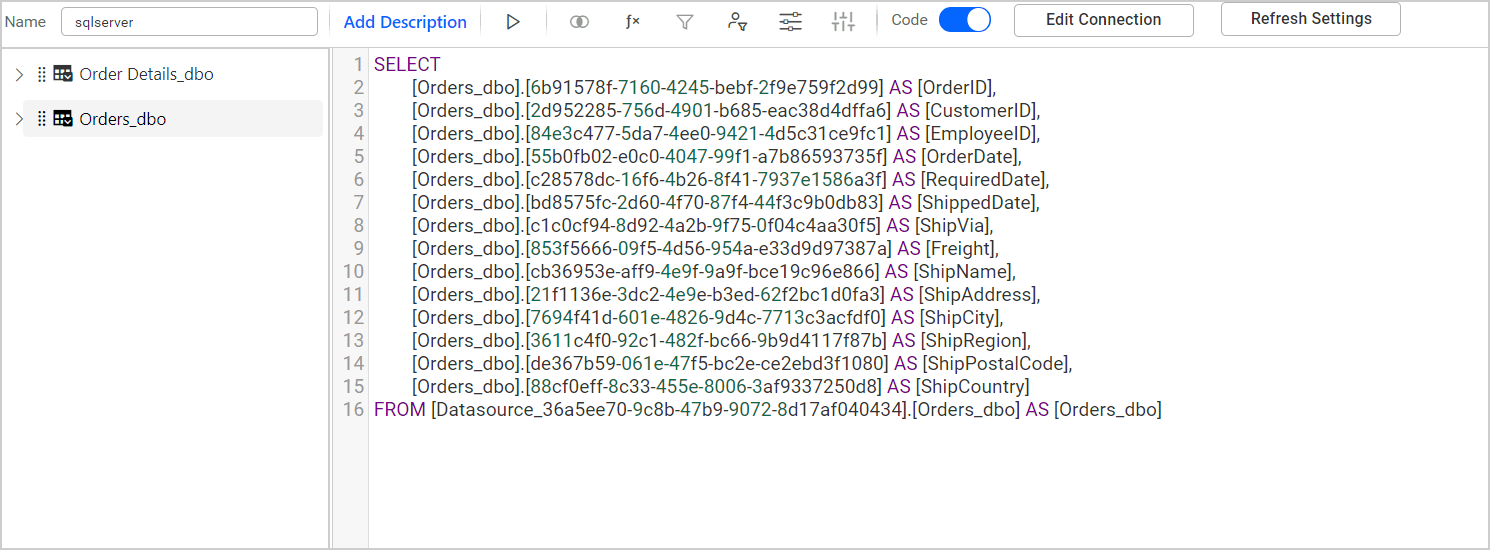
From the Bold BI 4.2 Enterprise Edition, we are using the GUID as the column name to resolve the large column name issue.
NOTE: The view table schema is supported only in the Extract Mode.
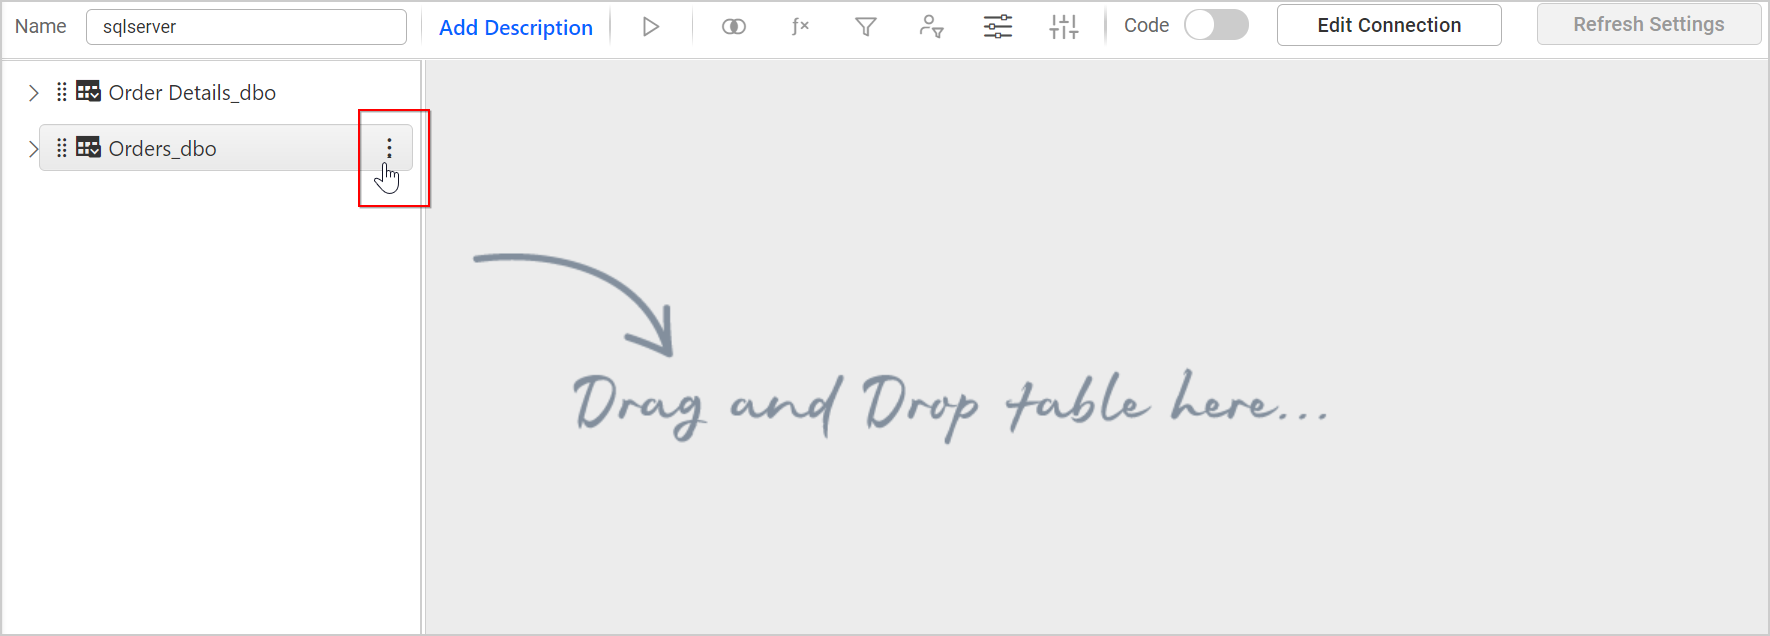
- After connecting the data source in an extract mode, the data design view opens with the design view. Now, you can see the
View SchemaOption in a TreeView.
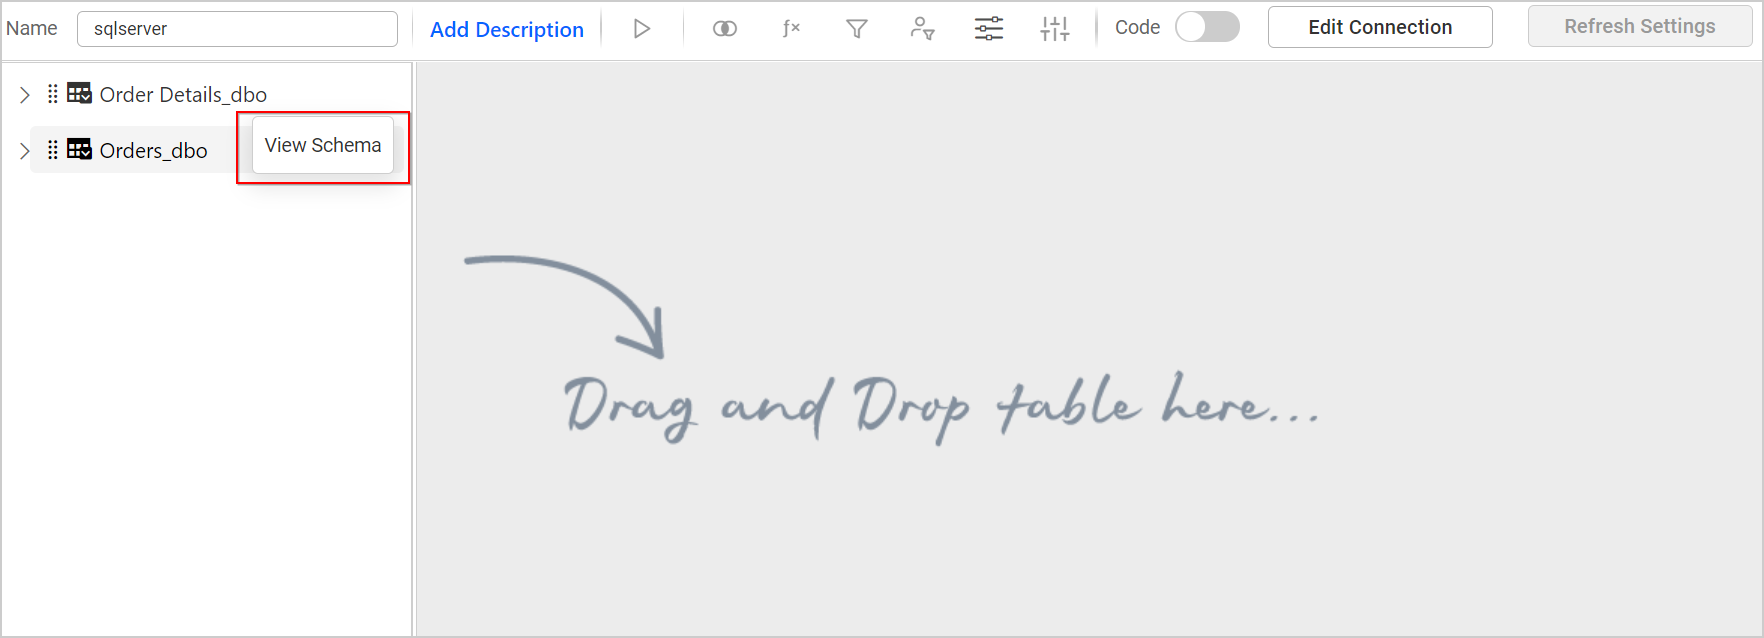
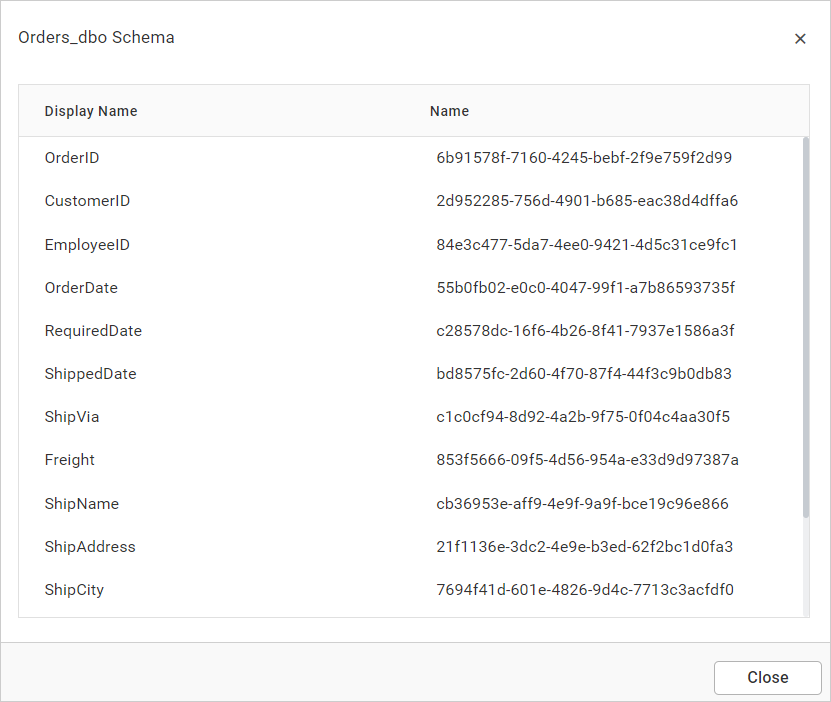
- Click
View Schema,the dialog will open with the Column name and Description. For the data source created on or after the 4.2 version, the GUID is used as the column name in extract data sources.
- You can copy the column name and GUID name using the
CTRL+Cby selecting the cell.
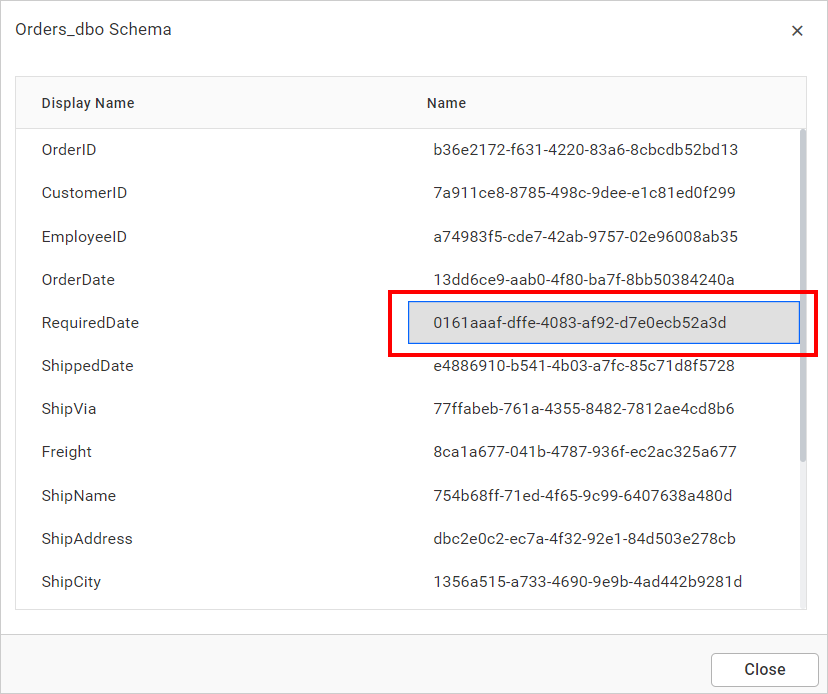
- You can use the GUID name in the code view mode.
Note: Following a successful connection, Query Designer will list
Tables,Views, andStored procedure. Materialized views will be listed under theViewssection.
Connecting to stored procedure in SQL Server database
The Bold BI designer allows you to use stored procedures defined in the SQL server database using Microsoft SQL connection.
NOTE: Bold BI designer supports stored procedure only for Microsoft SQL Server.
Connecting to Stored Procedure in Live mode
To connect the SQL Server database in live mode, refer Create Microsoft SQL Server data source in live mode.
After completing Step 4 in Create Microsoft SQL Server data source in live mode, you will get into the data design view with the available stored procedure that is displayed on the left pane of tree view. The available parameters can also be displayed while expanding the procedure.
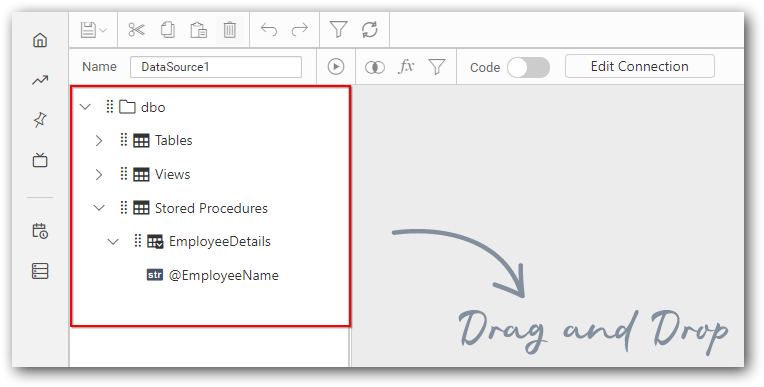
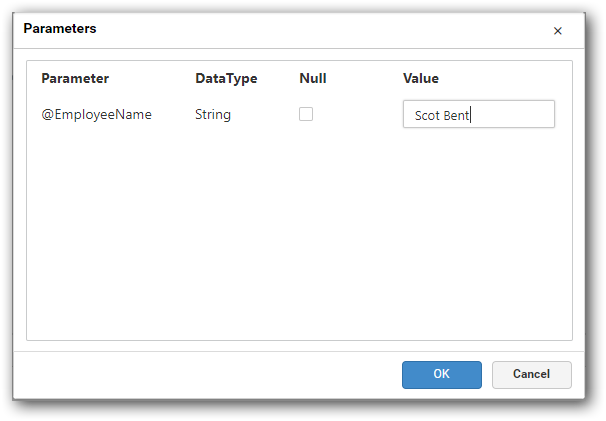
You can drag the desired stored procedure into the canvas area. Enter the parameter values in the Parameters dialog and click OK to proceed further.
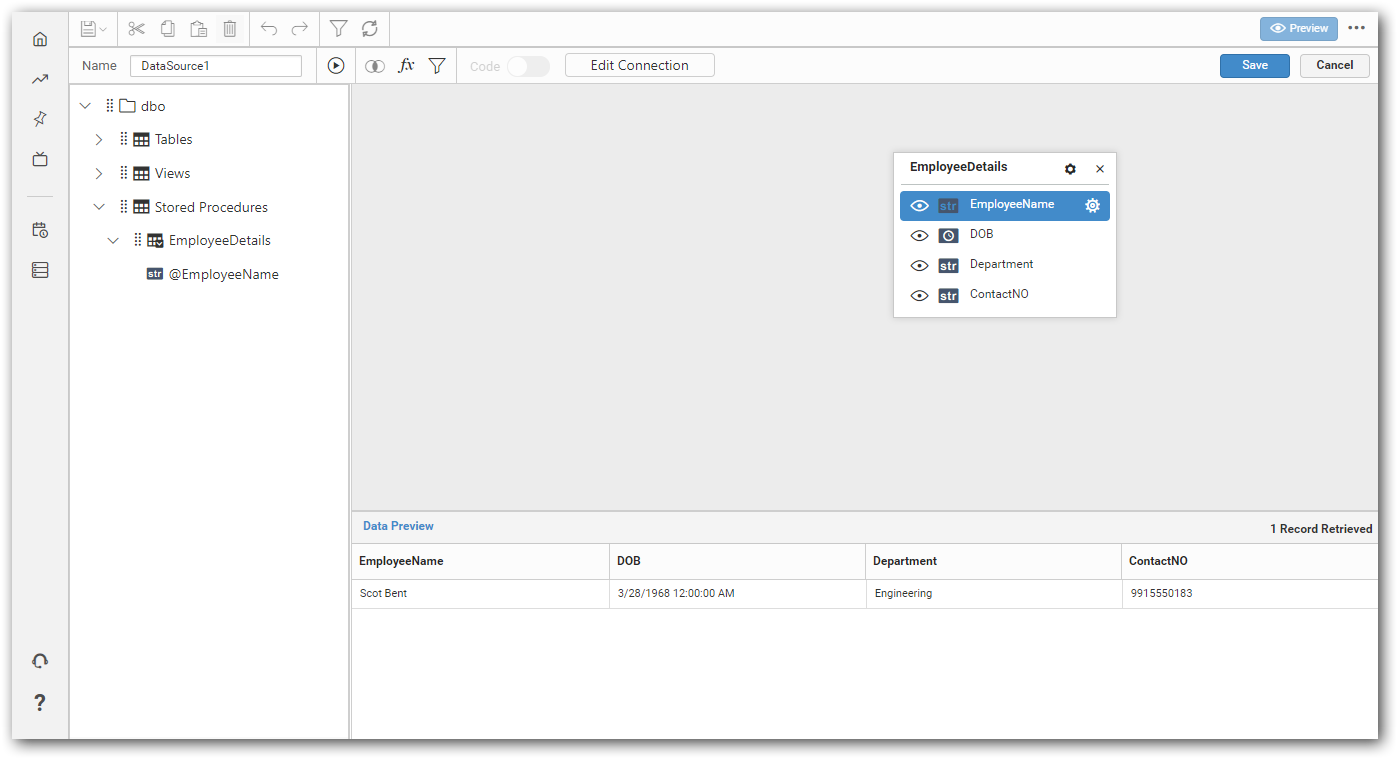
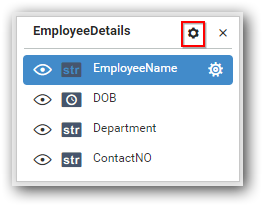
The Bold BI designer allows you to edit the supplied parameters by using the edit parameters button that is available in the created table.
NOTE: You can add only one stored procedure per model even if the database contains more than one stored procedure.
Connecting to stored procedure in extract mode
To connect the SQL server database in extract mode, refer Create Microsoft SQL Server data source in extract mode.
After completing Step 6 in Create Microsoft SQL Server data source in extract mode, you will get into the Choose Table(s) dialog with the available stored procedure that is displayed on the left pane of tree view.
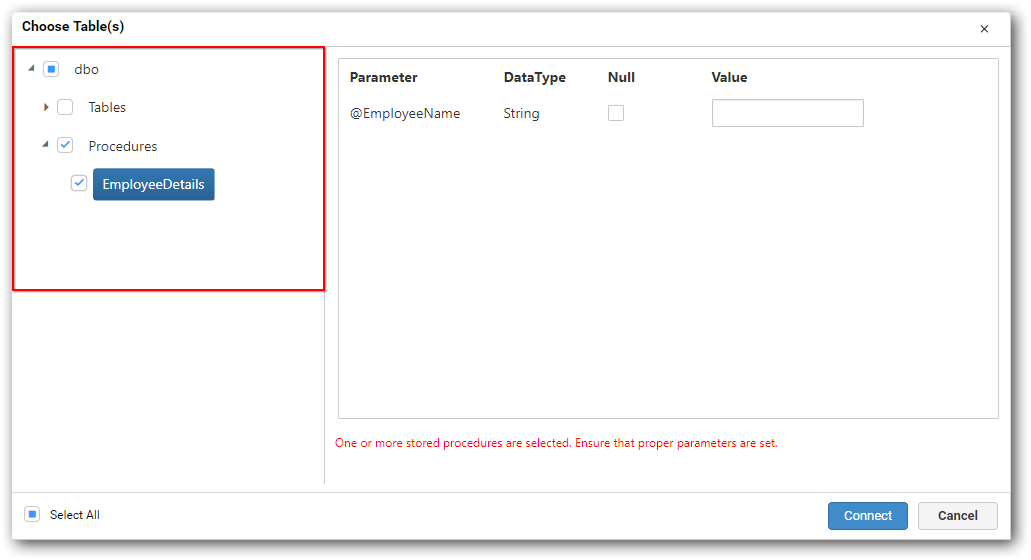
Now, enter the parameter value required for selected stored procedure and click Connect button.
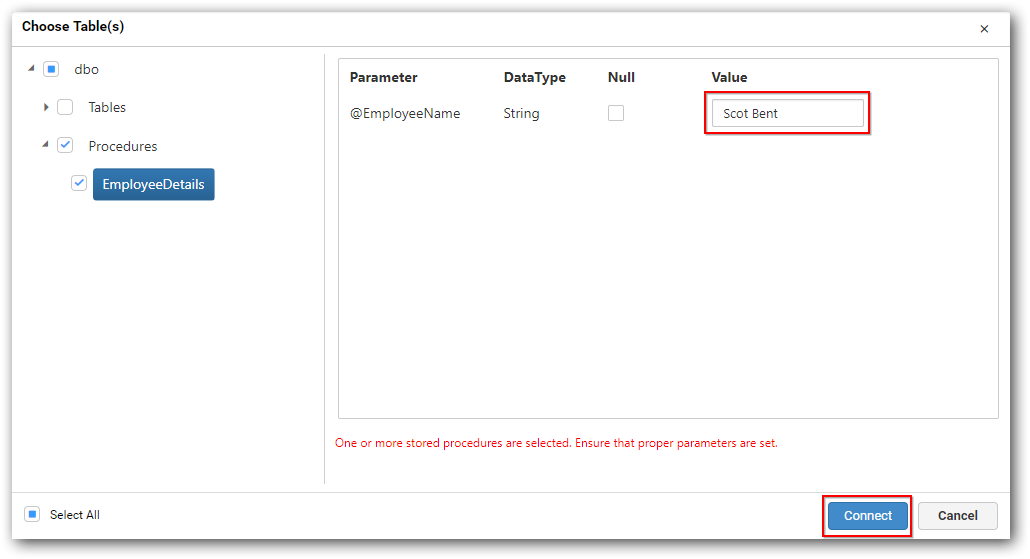
When the Connect button is clicked, the selected stored procedures data based on supplied parameter will be extracted and stored as a table in Azure SQL database maintained for Bold BI and then, the data design view page opens with extracted stored procedure table details in left pane of tree view.
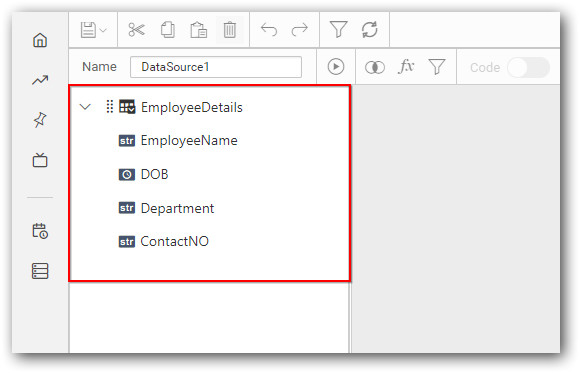
Now, you can drag and drop the table from left panel of data design page and save the data source by clicking the Save button.
NOTE: Stored procedure follows only Full Load refresh for regular update of data in extract mode.
Connecting through Custom SQL Query
You can connect to data source of certain data connections through the custom SQL query. This feature allows you to define the data source with manually written queries instead of manually dragged tables for data connection type such as Microsoft SQL connections.
Establish Data Connection
To connect the Microsoft SQL Server database, refer to the Microsoft SQL.
Switch to Code View
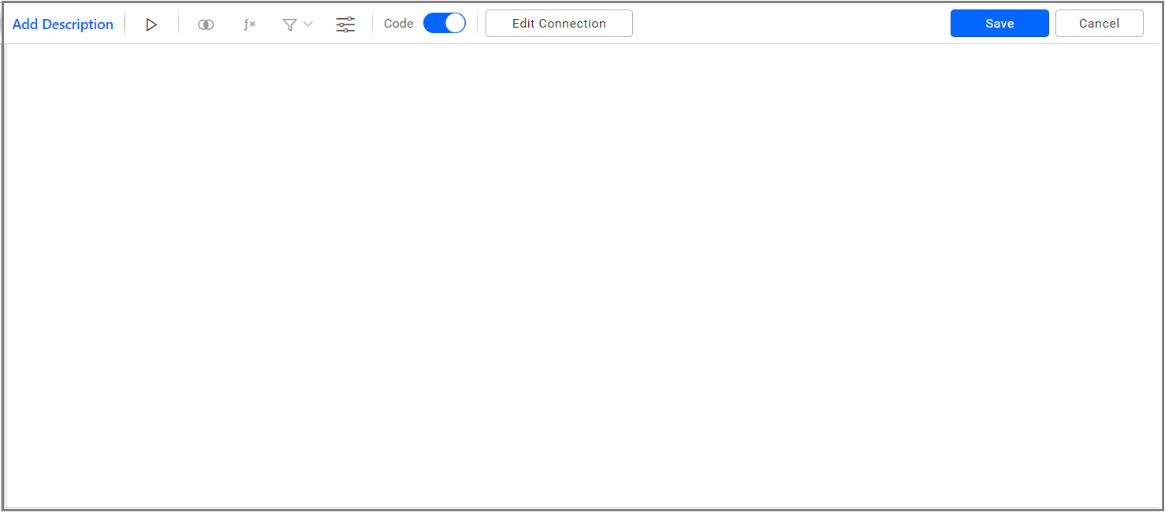
By default, the data design view opens with design view. Switch to the code view by enabling the slider option in the tools pane in data design view as shown (highlighted) in the following image.

This will open the query editor window as like below,
Write query and execute
In the Query Editor window, you can write your own query which helps you to access table schema information and create a new data source that can be bound to dashboard widgets.
After writing your query, click the Execute button in the tools pane. You can also view the data for your query in bottom of the Query Editor by clicking Update.
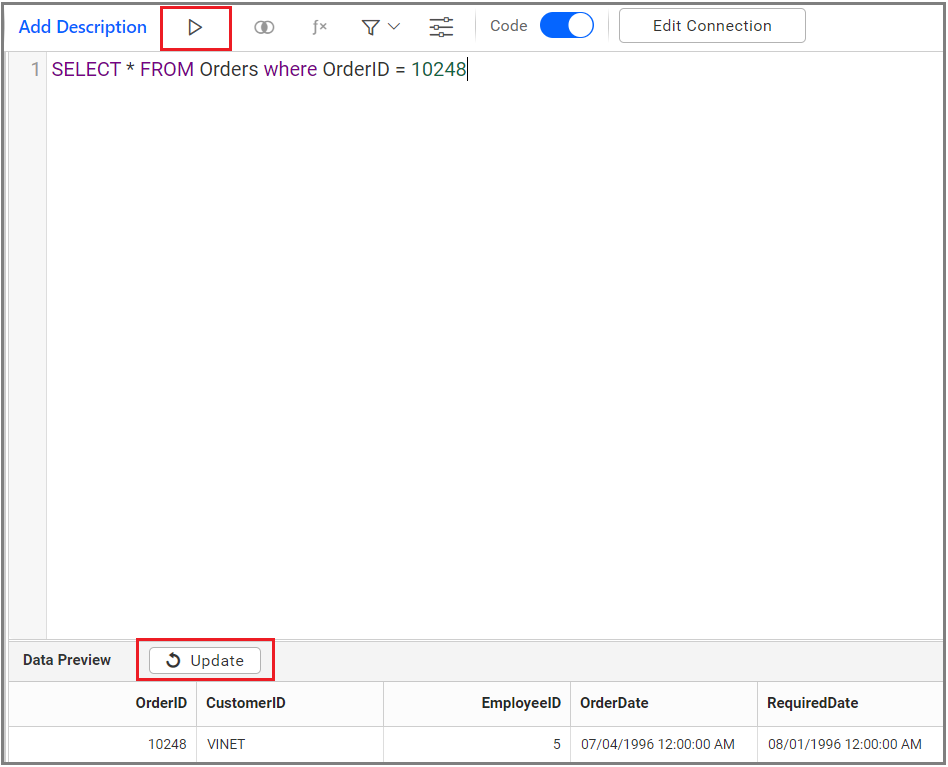
Then click Save to save the data source.

Code View for Design View Tables
You can view the query in Query Editor window for already created a data source in design view.
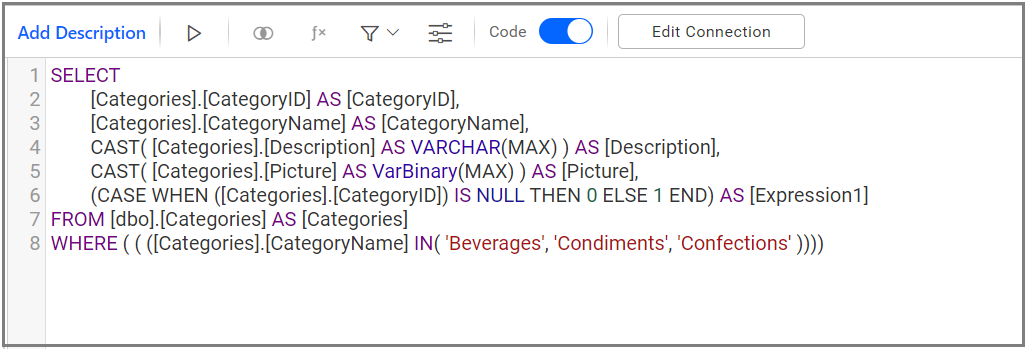
For example, I have dragged the Categories table in design view and added expression column and applied filters too.
Then, I tried to enable the Code Slider to view the query, this query shows the added expression column, applied filters and whatever changes that made in the table.
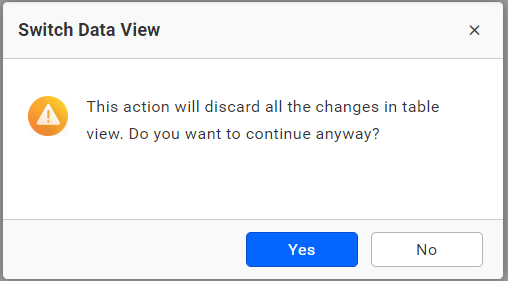
If you click Execute, you will be prompted with an alert message for confirmation as proceeding with this action, will reset the design view expression.
Alias Name for Tables and Columns
In query editor window, you can write/edit your query and perform all the operations with respect to retrieving data from your database.
Here, you can change the table or column name using SQL Alias name. Refer the below image,
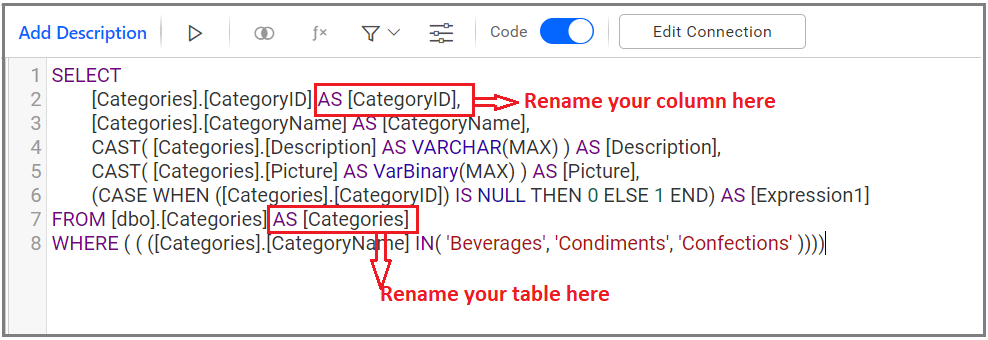
After clicking Execute, this modification will be reflected in your table.
NOTE: You can modify the column name in design view itself. Please refer here.
Configuring Expression Columns
Code view supports expressions which is a combination of data columns, operators, and built-in functions.
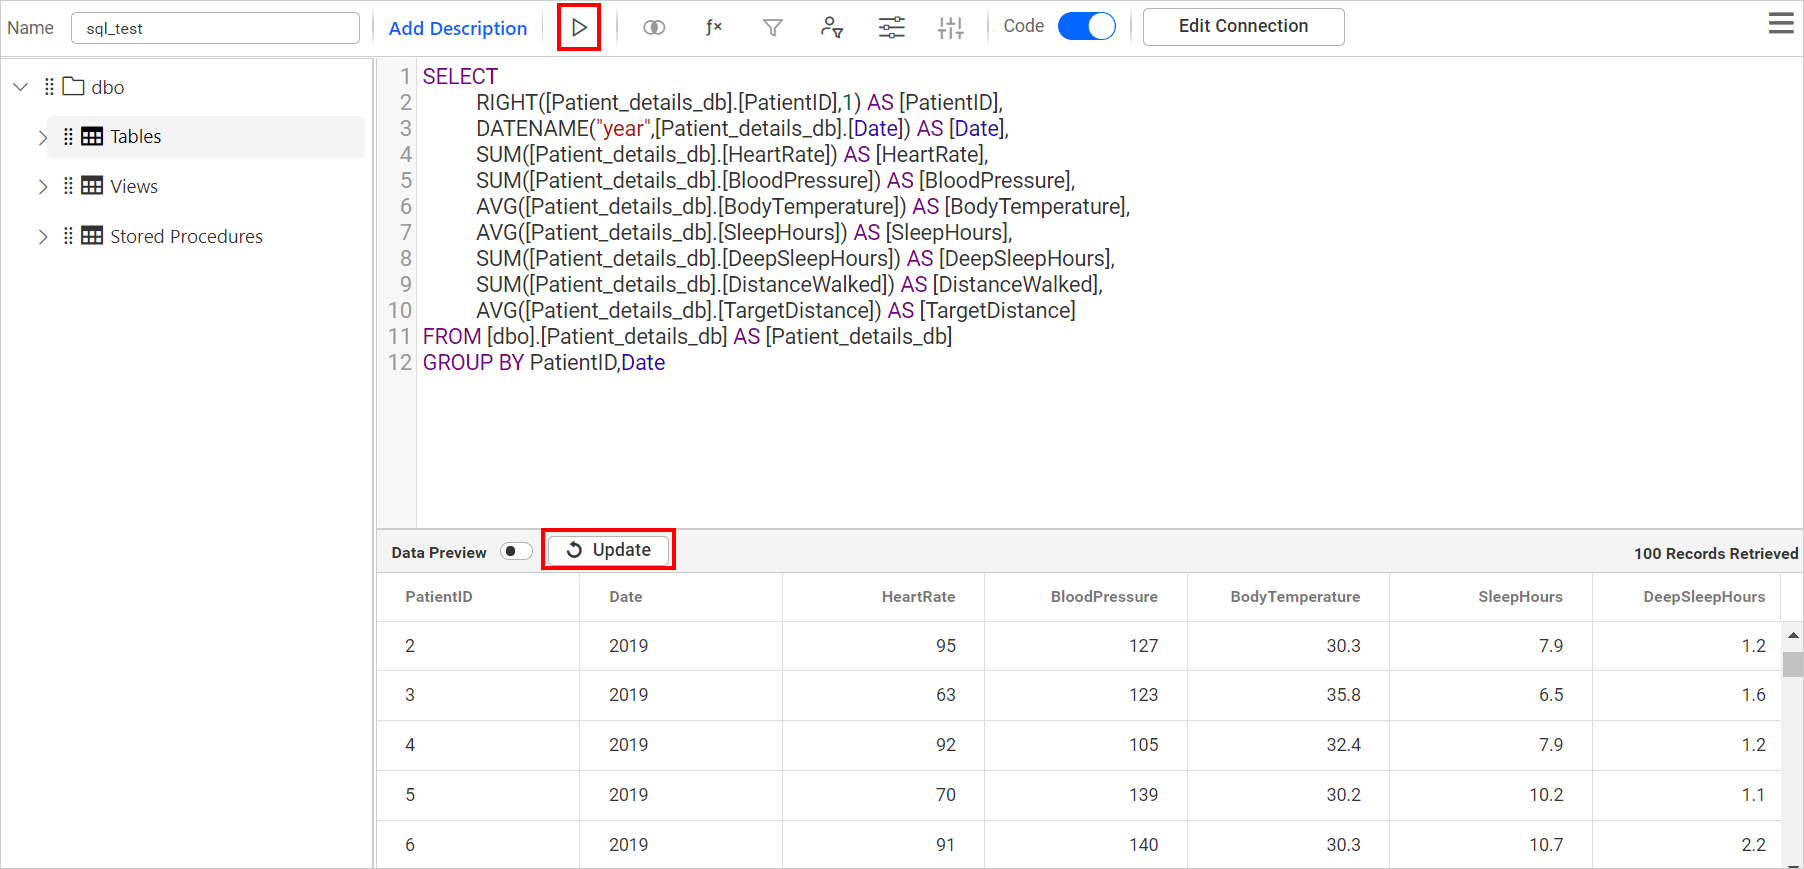
The following image shows the sample SQL query for using expressions with built-in functions like SUM(), COUNT(), and more in the code view editor. After altering the query, click the Run icon to execute the query and click Update to fetch the data.
To know more, refer to this link.
Configuring User Filter
Code view supports the User filter, which provides row-level security for the data used for creating dashboards.
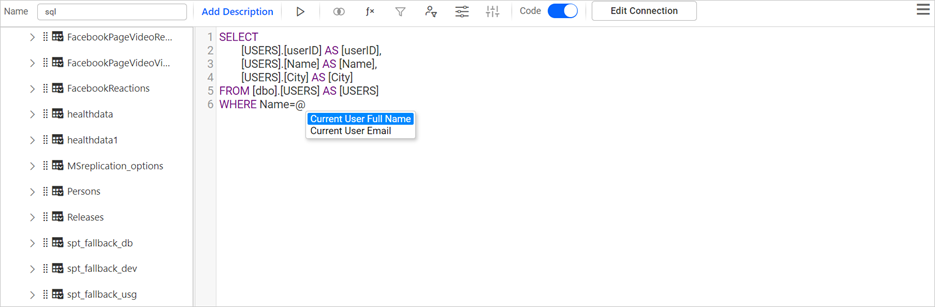
After switching to code view, press the Shift+2 key to list the available default parameters.
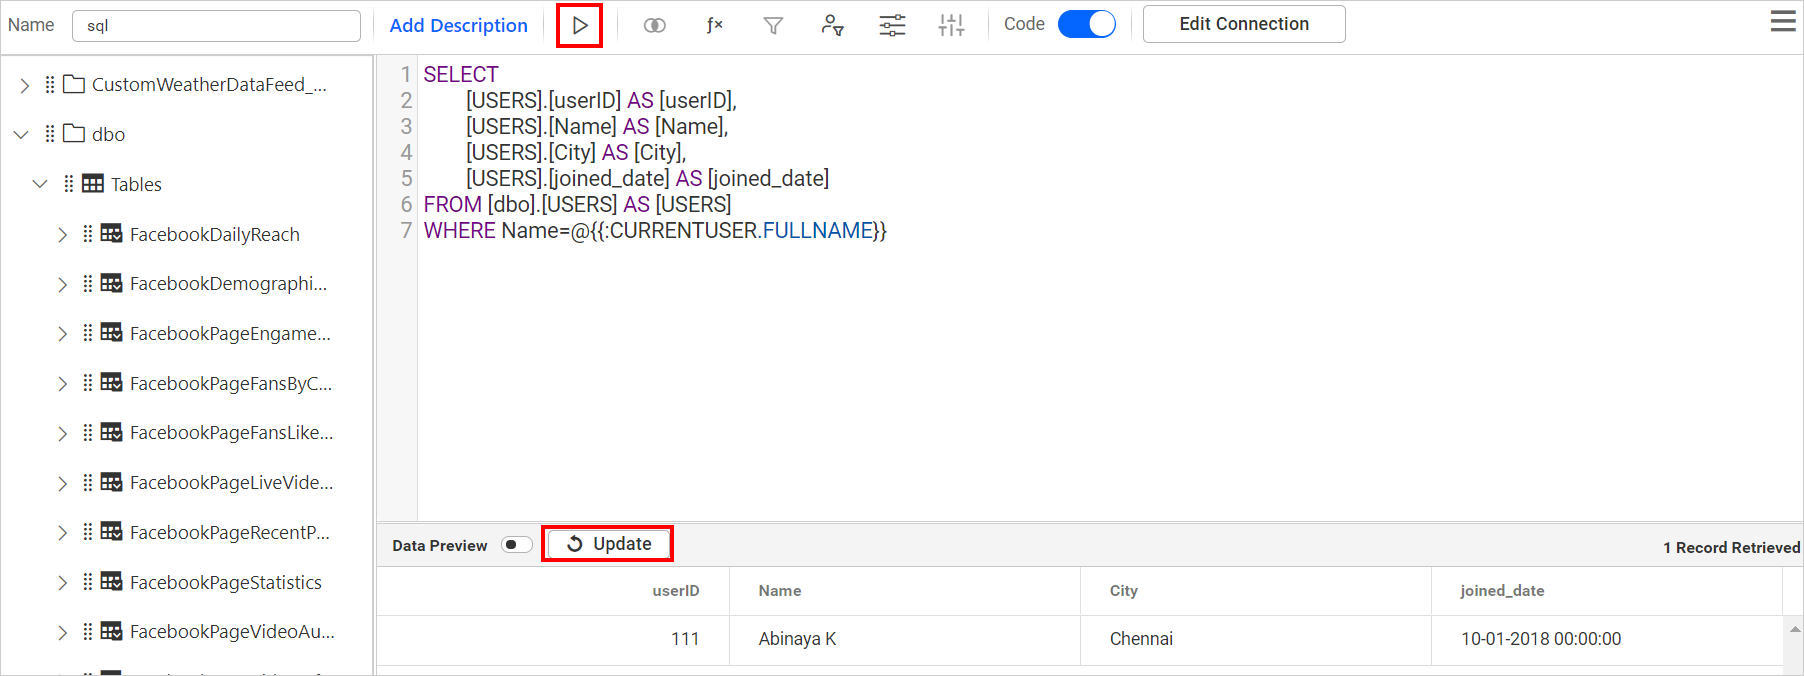
The Current User Full Name parameter filters the data based on the full name, and the Current User Email parameter filters the data based on the user email.
Here, you need to assign the Current User Full Name parameter to the Name column, which will fetch the records of the currently logged user based on the full name. After altering the query, click the Run icon to execute the query and click Update to fetch the filtered data.
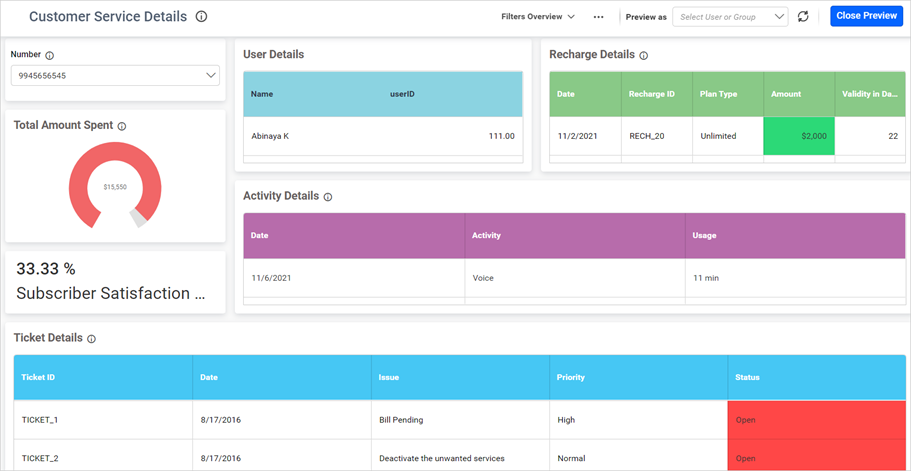
You can refer to the documentation to create a dashboard using Bold BI. Once the dashboard is created, you can preview the dashboard by clicking the Preview button.
Dashboard preview for User 1:
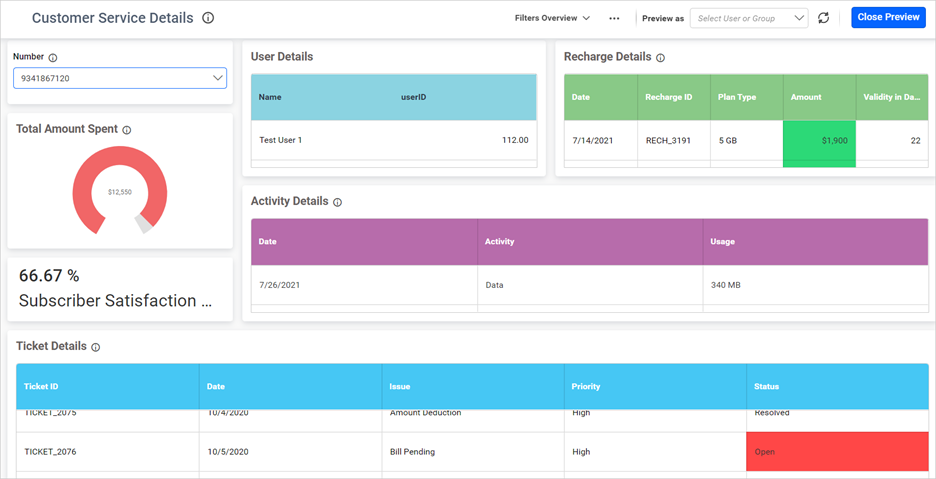
Dashboard preview for User 2:
You can also filter the data based on the users using the Configure User Filters icon, as shown in the following image. Refer to this link to configure the user filters.
![]()
Configuring Dashboard Parameter
Code view supports the dashboard parameter, which allows the user to execute the custom query or stored procedure dynamically based on the parameter while viewing the dashboard.
To configure the dashboard parameter, refer to the documentation.
Here, you can find the configured dashboard parameter in the following image.
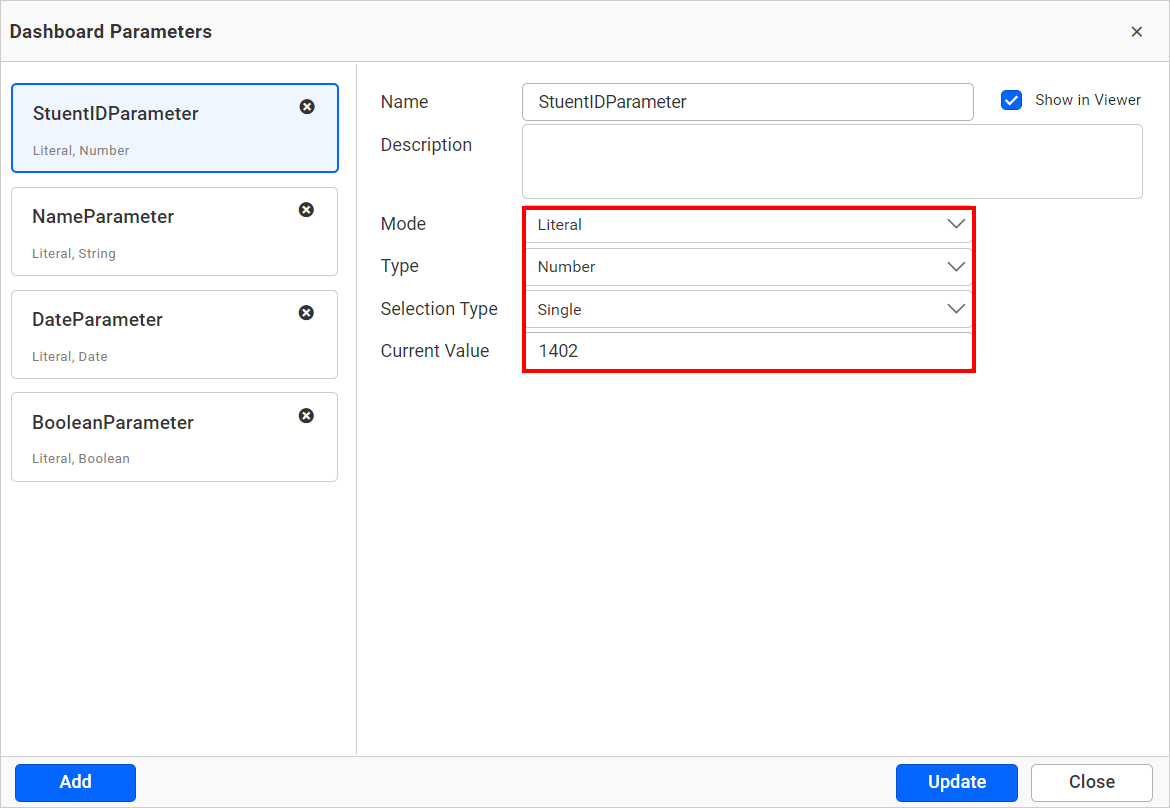
Press the Shift+2 key to list the available parameters. You can use it anywhere in the query editor window.
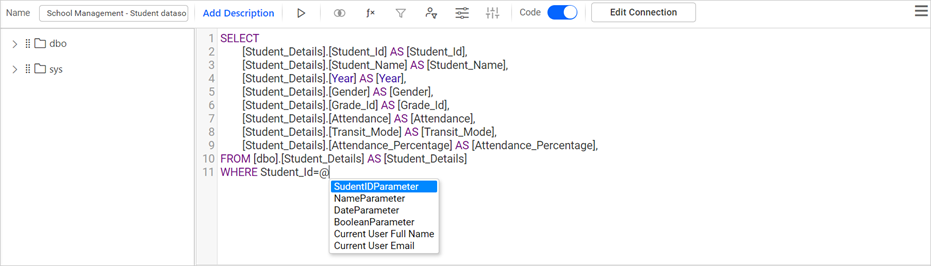
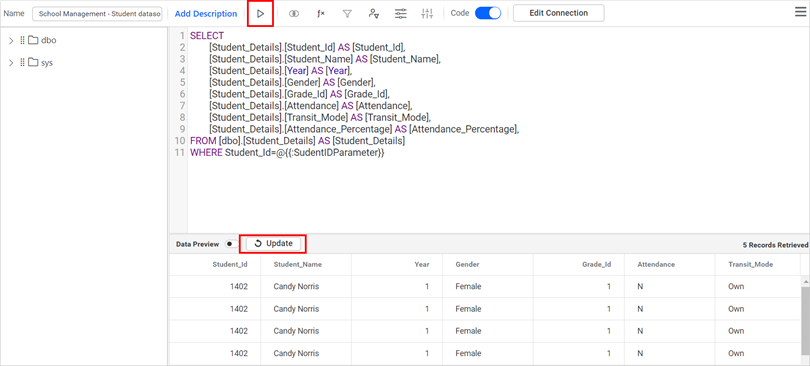
The following image shows the sample SQL query using the dashboard parameter in the code view editor. Using this query, you can fetch the records based on the configured dashboard parameter value. After altering the query, click the Run icon to execute the query and click Update to fetch the filtered data.
You can use this documentation to create a dashboard using Bold BI. Once the dashboard is created, you can preview the dashboard by clicking the Preview button.
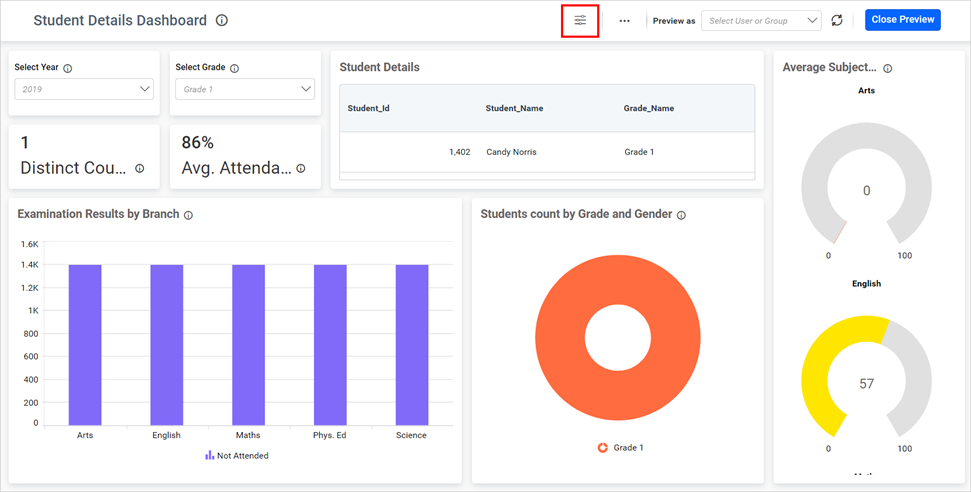
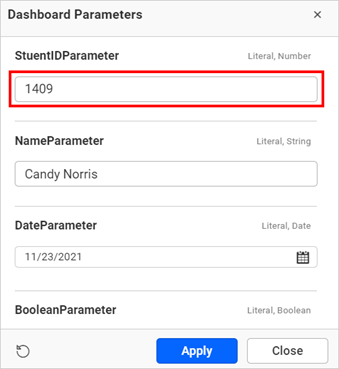
You can also change the parameter value by clicking the dashboard parameters icon, as shown in the following image.
Here, you can find the StudentIDParameter value is changed.
Now, you can view the updated dashboard in the following image.

To know more, please refer to this link.
Sample Query with CUBE and ROLLUP
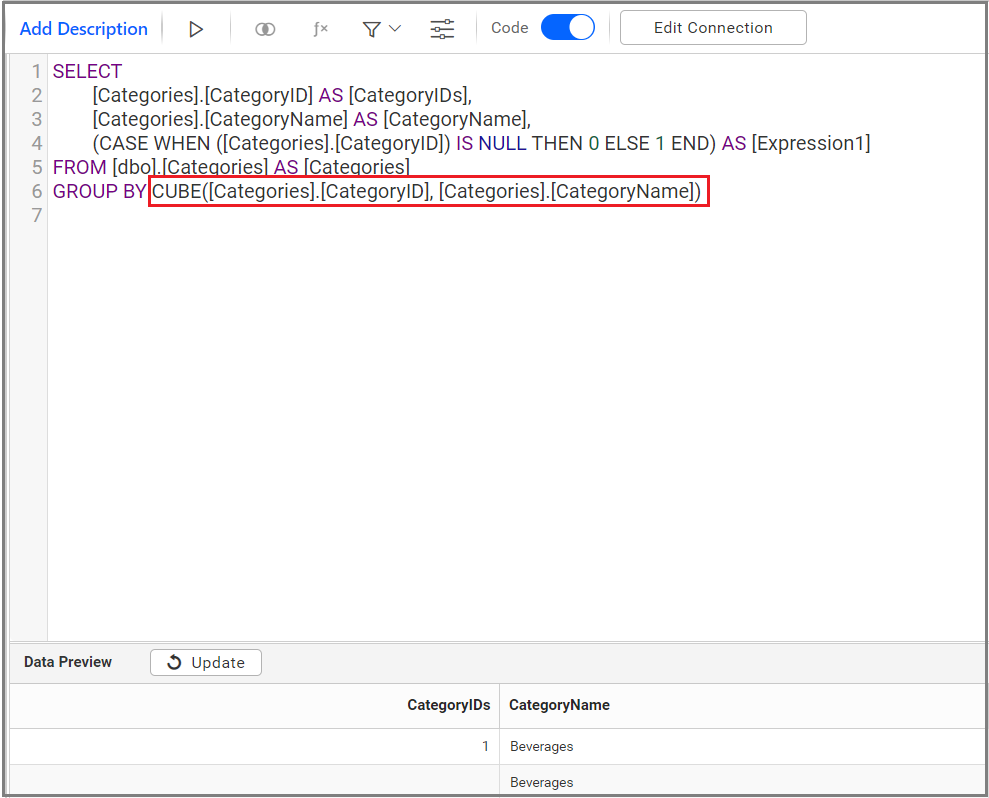
Bold BI supports SQL Server from 2005 and above. We cannot connect SQL server 2003 here, but we can use the statements CUBE and ROLLUP in the Code view by connecting any SQL server from 2005+ in Bold BI dashboard.
The below image shows the sample query for SQL Server CUBE and ROLLUP in Code View editor.
Switch to Design View
If you tried to switch back design view by disabling the Code Slider in tools pane, you will be prompted with an alert message to remove your query for confirmation as proceeding with this action, will reset the code view expression.
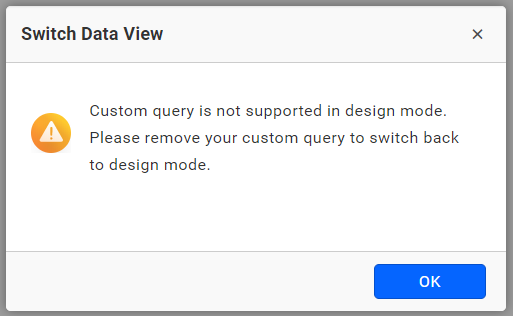
After clicking Ok, remove your query and then disable the Code slider to switch back to design view.
NOTE: In PostgreSQL connection type, the query editor does not support the query with parameters.
Custom SQL Queries Performance Considerations
Code View Mode in Bold BI provides you with the flexibility to write and execute custom SQL queries to perform data transformations and analysis, as discussed in the above sections. However, it is important to understand that Code View Mode is not equivalent to Design Mode, and you might experience slower performance when compared to Design Mode at times.
In Code View Mode, Bold BI issues the custom SQL query as a subquery to the database server. It is important to note that this can have an impact on performance. To mitigate any performance issues, it is crucial to use proper syntax for your custom SQL queries and optimize them with appropriate aggregations if necessary. Additionally, it is recommended to be mindful of query execution time and the number of rows it will return before utilizing it in Bold BI. This will help ensure efficient processing and avoid potential performance bottlenecks. Alternatively, you can consider creating views in your database by utilizing a custom SQL query and connecting them through the design mode in Bold BI.
SQL data source refresh settings
The refresh settings for SQL data source is available only in extract mode. When we refresh the data source in Bold BI, most recent data from the original source connection is retrieved and updated in the data store. Users have the flexibility to refresh the data manually or schedule it according to their requirements. By keeping the data up-to-date, users can rely on accurate and current information for their analyses and visualizations. There are two types of data source refresh available for SQL data sources:
- Full load
- Incremental update
Full load
Full Load Refresh is a process of refreshing a data source in Bold BI by loading all the data from the original database into the intermediate database. This process is typically used when there have been significant changes to the data in the original database, or when you want to start with a clean slate. For full load refresh, the Bold BI designer will truncate all records from extracted table present in intermediate database and extract the entire table from original database to intermediate database.

When should use Full Load Refresh?
You should use Full Load Refresh when:
- There have been significant changes to the data in the original database.
- Starting with a fresh dataset is required.
Incremental update
Incremental Refresh is a feature in Bold BI that allows you to refresh a data source by extracting only the data that has changed since the last refresh. This method is particularly useful when dealing with large databases as it can save time and resources by avoiding the need to extract and load all the data again. The primary requirement is to have a date field and a primary key field included in the table.
When should you use Incremental Refresh? Incremental Refresh is recommended in the following scenarios:
- The data in the original database undergoes frequent changes.
- There is a need to refresh the data quickly.
- Saving time and resources is a priority.
Views : To perform incremental refresh for views, specify the last modified timestamp column while creating the data source in extract mode. Using that last modified column, the Bold BI designer will extract and load the newly updated data from the actual database to the intermediate database table.
- The “Include Unique Column(s)” option is available in Incremental Refresh and allows you to specify the unique or constraint columns that are used to identify and update the modified records in the intermediate database. By enabling and selecting the appropriate unique columns, you ensure that the modified records are correctly updated during the incremental refresh process.
NOTE:
- Incremental update process depends on tables primary key and last modified date time column. If any one of the columns is not available on the table, the extracted table will get full load refresh by truncating the existing data and reload all data from the actual database.
- The Include Unique column(s) toggle button is enabled only when the Incremental Refresh toggle button is in the enabled state. If the Unique column(s) toggle button is not enabled, only the newly added records are fetched rather than the recently modified existing records.
Differences between data refresh, dashboard refresh:
Data refresh and Dashboard refresh are two different processes. Data refresh refers to the process of refreshing the data in a data source. Dashboard refresh refers to the process of refreshing the data in a dashboard.
The main difference between data refresh and dashboard refresh is that data refresh can be scheduled to occur automatically, while dashboard refresh must be initiated manually. In Bold BI, you have the flexibility to configure the scheduled refresh of your dashboards. You can choose to refresh the entire dashboard or specific widgets within a dashboard automatically, based on a predefined timer.
Additionally, data refresh can be used to update the data in a single data source, while dashboard refresh can be used to update the data in multiple data sources.
Best practices to schedule and run data refresh:
Tips for best practice:
- Select the appropriate refresh frequency.
- The data source and the business requirements will determine how often the data is refreshed. You might wish to refresh the data every minute or second, for instance, if the data source is a live stream. You might only need to refresh the data once daily or once weekly if the data source is a static file, though.
- Plan data refresh for off-peak times.
- Data refresh scheduling during non-peak times will lessen the influence on the data source’s performance.
- Before releasing a data refresh to production, test it.
- Prior to publishing data refresh to production, it is crucial to test it.
Connect using custom attribute and dashboard parameter
We have added support for custom attributes and dashboard parameters to the data source connection. You can connect to the data source using custom attributes or dashboard parameters.
Custom Attribute
Dashboard Parameter
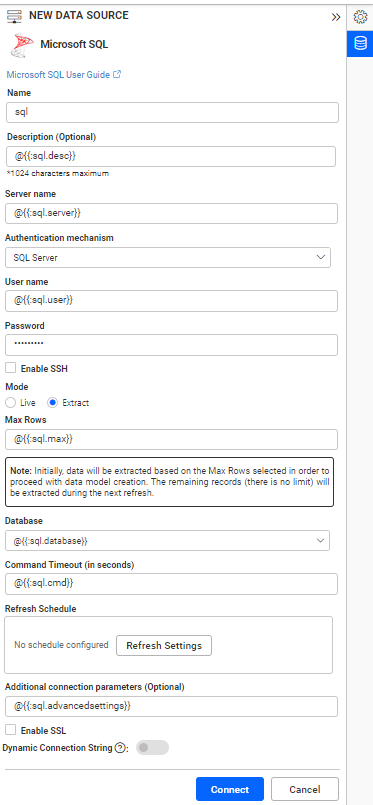
Note: Refer the Dashboard Parameter Documentation and Custom Attributes Documentation for more details.
Connecting Bold BI to Microsoft SQL Server Data Source via REST API
Prerequisites
Supported Server Versions: Microsoft SQL Server (2012, 2014, 2016, 2017, and 2019)
Type while creating the data source needs to be sqlserver.
Modes
Through the REST API, only the live mode data source can be created and edited.
Parameters for creating Data Source
NOTE: The ability to provide join support is available only during the creation of a new data source. Join in edit connection mode is not supported.
| Parameters | Details |
|---|---|
| Servername required | string
Server name or Host name of the connection |
| IntegratedSecurity optional | string
This is used to specify Authentication mechanism. Needed to provide true for Windows Authentication, false for Basic Authentication.
default value is false |
| Username optional | string
A valid user name. Required if Integrated Security is not provided or is provided as false. |
| Password optional | string
A valid Password. Required if Integrated Security is not provided or is provided as false. |
| Database required | string
database which needs to be connected |
| Schemaname required for table mode | string
Enter a valid Schemaname |
| Tablename required for table mode | string
Enter a valid Tablename |
JoinType Required For Join Info | string
Enter a valid JoinType For Example (Inner,Outer) |
| LeftTable Required For Join Info | string
Enter a valid Left Table name |
| RightTable Required For Join Info | string
Enter a valid Right Table name |
| LeftField Required For Join Info | string
Enter a valid Left Table Column Name |
| RightField Required For Join Info | string
Enter a valid Right Table Column Name |
| Condition Required For Join Info | string
Enter a valid Condition For Example (AND,OR) |
| LeftField Required For Join Info | string
Enter a valid Left Table Column Name |
| Operator Required For Join Info | string
Enter a Valid Operator For Example (=,>=) |
| Value Optional For only Join Info | string
Specifically choose the column values. |
| Query required for code view mode | string
Enter a valid Query |
| Impersonate optional | `boolean` Enable or disable user impersonation. By default, it is false. |
| AdvancedSettings optional | string
Additional optional connection parameters can be provided. By default, it is empty. |
| IsEnableSSL optional | `boolean` Enable or disable SSL. By default, it is false. |
| CommandTimeout optional | string
Enter a valid Timeout for connection. By default, it is 300 |
| IsSshConnection optional | `boolean` Enable or disable SSH. By default, it is false. |
| SshServerName optional | string
Enter a valid Ssh Server name. By default, it is empty. |
| SshPort optional | `integer` Enter a valid Ssh Port number. |
| SshUserName optional | string
Enter a valid Ssh Username. By default, it is empty. |
| SshPassword optional | string
Enter a valid Ssh Password. By default, it is empty. |
| Expressions optional | `Array of Objects` |
Parameters for edit the connection while upload the dashboard via API
| Parameters | Details |
|---|---|
| DataSource required | string
Server name or Host name of the connection |
| IntegratedSecurity optional | string
This is used to specify Authentication mechanism. Needed to provide true for Windows Authentication, false for Basic Authentication.
default value is false |
| UserName required | string
A valid username for the connection |
| Password required | string
A valid Password for the connection |
| InitialCatalog required | string
database which needs to be connected |
| Schema required for table mode | string
Enter a valid Schemaname |
| CommandTimeout optional | string
Enter a valid Timeout for connection. By default, it is 300 |
| IsSshConnection optional | `boolean` Enable or disable SSH. By default, it is false. |
| SshServerName optional | string
Enter a valid Ssh Server name. By default, it is empty. |
| SshPort optional | `integer` Enter a valid Ssh Port number. |
| SshUserName optional | string
Enter a valid Ssh Username. By default, it is empty. |
| SshPassword optional | string
Enter a valid Ssh Password. By default, it is empty. |
Parameters for adding expressions when creating Data Source
| Parameters | Details |
|---|---|
| Name required | string
Name of the Expression
|
| Expression required | string
Expression
|
Parameters for editing Data Source
NOTE: For editing Data Source via API. All the parameters are optional. The parameter which needs to be changed can be provided.
Parameters for modifying expressions when editing Data Source
| Parameters | Details |
|---|---|
| Name required | string
Name of the Expression
|
| Expression required | string
Expression
|
| Action optional | string
add/delete/edit
By default, it is add.
|
| NewName optional | string
For renaming the expression. This is applicable only if the Action is edit
|
Connection Sample for Table Mode
For creating connection:
"Connection":
{
"Servername": "string",
"IntegratedSecurity": "false",
"Username": "string",
"Password": "string",
"Database": "string",
"Schemaname": "string",
"Tablename": "string",
"Impersonate": "false",
"AdvancedSettings": "string",
"IsEnableSSL": false,
"CommandTimeout": "300",
"IsSshConnection": "false",
"SshServerName": "string",
"SshPort": 0,
"SshUsername": "string",
"SshPassword": "string",
"Expressions" : [{
"Name": "Expression1",
"Expression" : "SUM(numeric expression)"
    },
    {
"Name": "Expression2",
"Expression" :  "UPPER(string expression)"
}]
}
For creating connection with multiple tables :
"Connection":
{
"Servername": "string",
"Port": "string",
"Username": "string",
"Password": "string",
"Database": "string",
"Tables": [
            {
                "Tablename": "string",
                "Schemaname": "string"
            },
            {
                "Tablename": "string",
                "Schemaname": "string"
            }
        ],
"JoinInfo": [
            {
                "JoinType": "string",
                "LeftTable": "string",
                "RightTable": "string",
                "JoinFieldInfos": [
                    {
                        "Condition": "string",
                        "LeftField": "string",
                        "Operator": "string",
                        "RightField": "string",
                        "Value": "string"
                    },
                    {
                        "Condition": "string",
                        "LeftField": "string",
                        "Operator": "string",
                        "RightField": "string",
                        "Value": "string"
                    }
                ]
            }
        ],
"Impersonate": "false",
"AdvancedSettings": "string",
"IsEnableSSL": false,
"CommandTimeout": "string",
"IsSshConnection": "false",
"SshServerName": "string",
"SshPort": 0,
"SshUsername": "string",
"SshPassword": "string",
"Expressions" : [{
"Name": "Expression1",
"Expression" : "SUM(numeric expression)"
    },
    {
"Name": "Expression2",
"Expression" :  "UPPER(string expression)"
}]
}
For editing connection:
"Connection":
{
"Servername": "string",
"IntegratedSecurity": "false",
"Username": "string",
"Password": "string",
"Database": "string",
"Schemaname": "string",
"Tablename": "string",
"Impersonate": "false",
"AdvancedSettings": "string",
"IsEnableSSL": false,
"CommandTimeout": "300",
"IsSshConnection": "false",
"SshServerName": "string",
"SshPort": 0,
"SshUsername": "string",
"SshPassword": "string",
"Expressions" : [{
"Name": "Expression1",
"Expression" : "SUM(numeric expression)",
"NewName" : "Sum",
"Action": "edit"
    },
    {
"Name": "Expression2",
"Expression" :  "UPPER(string expression)"
"Action": "delete"
}]
}
NOTE: Through Rest API, the data source can be created or edited with only one table. If different table is provided in edit data source, the table will be replaced. The widgets will be retained only if the schema is same as the previous table.
Connection Sample for Code View Mode
"Connection":
{
"Servername": "string",
"IntegratedSecurity": "false",
"Username": "string",
"Password": "string",
"Database": "string",
"Query": "string",
"Impersonate": "false",
"AdvancedSettings": "string",
"IsEnableSSL": "string",
"CommandTimeout": "300",
"IsSshConnection": "false",
"SshServerName": "string",
"SshPort": 0,
"SshUsername": "string",
"SshPassword": "string",
"Expressions" : [{
"Name": "Expression1",
"Expression" : "SUM(numeric expression)"
    },
    {
"Name": "Expression2",
"Expression" :  "UPPER(string expression)"
}]
}
Sample connection for editing the connection while uploading the dashboard via API.
"Connection":  {
      "DataSource": "string",
      "InitialCatalog": "string",
      "UserName": "string",
      "Password": "string",
      "Schema": "string",
      "IntegratedSecurity": "string",
      "AdvancedSettings": "string",
      "CommandTimeout": "string"
  }
Related Links
Dashboard Designer Walkthrough
Microsoft SQL Server Integration
How to connect SQL Server with different port number in a dashboard
- Modes
- Live
- Extract
- How to create Microsoft SQL Server data source
- Create Microsoft SQL Server data source in live mode
- Create Microsoft SQL Server data source in extract mode
- View table schema support
- Connecting to stored procedure in SQL Server database
- Connecting to Stored Procedure in Live mode
- Connecting to stored procedure in extract mode
- Connecting through Custom SQL Query
- Establish Data Connection
- Switch to Code View
- Write query and execute
- Code View for Design View Tables
- Alias Name for Tables and Columns
- Configuring Expression Columns
- Configuring User Filter
- Configuring Dashboard Parameter
- Sample Query with CUBE and ROLLUP
- Switch to Design View
- Custom SQL Queries Performance Considerations
- SQL data source refresh settings
- Full load
- Incremental update
- Differences between data refresh dashboard refresh
- Best practices to schedule and run data refresh
- Connect using custom attribute and dashboard parameter
- Connecting Bold BI to Microsoft SQL Server Data Source via REST API
- Prerequisites
- Modes
- Parameters for creating Data Source
- Parameters for edit the connection while upload the dashboard via API
- Parameters for adding expressions when creating Data Source
- Parameters for editing Data Source
- Parameters for modifying expressions when editing Data Source
- Connection Sample for Table Mode
- For creating connection
- For creating connection with multiple tables
- For editing connection
- Connection Sample for Code View Mode
- Sample connection for editing the connection while uploading the dashboard via API
- Related Links
- Modes
- Live
- Extract
- How to create Microsoft SQL Server data source
- Create Microsoft SQL Server data source in live mode
- Create Microsoft SQL Server data source in extract mode
- View table schema support
- Connecting to stored procedure in SQL Server database
- Connecting to Stored Procedure in Live mode
- Connecting to stored procedure in extract mode
- Connecting through Custom SQL Query
- Establish Data Connection
- Switch to Code View
- Write query and execute
- Code View for Design View Tables
- Alias Name for Tables and Columns
- Configuring Expression Columns
- Configuring User Filter
- Configuring Dashboard Parameter
- Sample Query with CUBE and ROLLUP
- Switch to Design View
- Custom SQL Queries Performance Considerations
- SQL data source refresh settings
- Full load
- Incremental update
- Differences between data refresh dashboard refresh
- Best practices to schedule and run data refresh
- Connect using custom attribute and dashboard parameter
- Connecting Bold BI to Microsoft SQL Server Data Source via REST API
- Prerequisites
- Modes
- Parameters for creating Data Source
- Parameters for edit the connection while upload the dashboard via API
- Parameters for adding expressions when creating Data Source
- Parameters for editing Data Source
- Parameters for modifying expressions when editing Data Source
- Connection Sample for Table Mode
- For creating connection
- For creating connection with multiple tables
- For editing connection
- Connection Sample for Code View Mode
- Sample connection for editing the connection while uploading the dashboard via API
- Related Links